Neue Handelsroboter und Indikatoren für den MetaTrader 4 - 169

Eine der wichtigsten Definitionen für die Überwachung des Devisenmarktes ist der Trend, weshalb der Citizen-Indikator geschaffen wurde, um den Trend in visueller Form anzuzeigen. Sie sollten den Indikator als zusätzlichen Indikator verwenden, d.h. Sie müssen diesen Indikator z.B. verwenden, um Kursbewegungen perfekt anzuzeigen! Seine Signale beruhen auf einem zuverlässigen Algorithmus. Bei gleichzeitiger Verwendung auf mehreren Zeitskalen macht dieser Indikator den Trend wirklich zu Ihrem Freund

Der Hauptzweck des Deathly-Indikators besteht darin, den Markt zu bewerten. Rote Punkte zeigen an, dass vorrangig VERKAUFS-Positionen eröffnet werden sollten. Die blaue Farbe zeigt an, dass es Zeit für KAUF-Positionen ist. Die Verwendung des Indikators ist sehr bequem und einfach. Der Indikator ist universell einsetzbar. Er kann in beliebigen Zeitintervallen angewendet werden. Sie können den Indikator für den Handel mit verschiedenen Vermögenswerten verwenden. Das Tool ist perfekt für den Forex

Der Andhadhun-Trendschritt-Indikator wird Ihnen Stabilität geben, wenn Sie seinen Signalen folgen. Und Sie werden in der Lage sein, zwischen Arbeit und der emotionalen Komponente zu unterscheiden. Er nutzt im Wesentlichen den Prozess der Identifizierung der Änderungsrate des Preiswachstums und ermöglicht es Ihnen, Einstiegs- und Ausstiegspunkte aus dem Markt zu finden. Schauen Sie sich einfach die Screenshots an und Sie werden die Prinzipien der Arbeit mit dem Indikator selbst bestimmen.
Der I

Ein grundlegender technischer Indikator, der es Ihnen ermöglicht, die aktuelle Marktsituation einzuschätzen, um in den Markt des ausgewählten Währungspaares in einem Trend und mit minimalem Risiko einzusteigen.
Viele Anfänger, die zum ersten Mal in den Markt einsteigen, haben oft mehr Glück als ein Profi, der jahrelang gelernt hat. Der Grund für dieses Phänomen ist der unbewusste Einstieg von Anfängern in den Trend, wenn auch ohne Indikatoren klar wird, wohin sich der Markt bewegt.
Der Apartm

Der Man Exclusivet Expert Advisor kann auf jedem Zeitrahmen, auf jedem Währungspaar und auf dem Server eines beliebigen Brokers eingesetzt werden. Einzigartiges Handelssystem! Das Expertensystem arbeitet mit Ticks und nutzt scharfe Tick-Bewegungen. Für den internen Algorithmus ist die elementare Einheit der Analyse ein Tick. Es wird empfohlen, auf liquiden Forex-Paaren mit niedrigem Spread zu arbeiten und VPS zu verwenden. Sie können mit $ 100 und 0,01 Lot beginnen. Es ist auch erwähnenswert, d

Der intelligente Algorithmus des Godfather-Indikators bestimmt präzise den Trend, filtert Marktgeräusche heraus und generiert Ein- und Ausstiegslevel. Der Indikator hilft bei der Suche nach Einstiegspunkten bei der Analyse des Preisdiagramms. Das Programm empfängt zunächst einen "Schnappschuss" des Graphen und analysiert ihn dann. Die Ergebnisse werden dem Trader in Form von Signalen mitgeteilt. Der Hauptzweck dieses Indikators besteht darin, die Ein- und Ausstiegszeitpunkte von Transaktionen z

Mit Hilfe des Algorithmus des Elephant Forex-Indikators können Sie schnell erkennen, welche Art von Trend sich derzeit auf dem Markt entwickelt. Der Indikator zeigt auf dem Diagramm den Haupttrend an, der im Moment auf dem Markt herrscht. Eine Richtungsänderung in Bezug auf die Fundamentaldaten des Marktes bedeutet eine Verschiebung des Handelsinteresses in Richtung Verkäufer oder Käufer.
Wenn man spekulative Ausschläge, die den Gesamttrend nicht beeinflussen, außer Acht lässt, geht dem Moment

Der Vorteil der Arbeit mit dem Special Agent Signalindikator ist, dass der Händler keine eigenständige technische Analyse des Charts durchführen muss. Die Bestimmung des Markttrends ist eine wichtige Aufgabe für Händler, und das Tool gibt fertige Signale in Form von Richtungspfeilen. Dieses Tool ist ein Pfeil (Signal).
Special Agent ist ein Trendindikator, ein technisches Analysewerkzeug, das dabei hilft, die genaue Trendrichtung zu bestimmen: entweder eine Aufwärts- oder eine Abwärtsbewegung
Indikator, der Dir jederzeit die aktuelle Anzahl sowie Gewinn- und Verlustsumme der geschlossenen Deals im eingeloggten Konto für einen einstellbaren Zeitraum anzeigt. Dazu am besten "Komplette Historie" in der Kontohistorie laden und dann den gewünschten Zeitraum (z.B. 1.1.2022-1.1.2023, also Kalenderjahr 2022) eingeben. Eingabe-Optionen: - Zeitraum (Achtung: entsprechende Daten müssen in die Kontohistorie des Terminals geladen werden) - Anzeige Dealanzahl - Anzeige GuV gesamt - Anzeige GuV fü
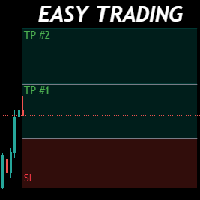
Money Management hilft Ihnen, den Handel mit einem Klick zu vereinfachen, Instanz und Pending, SL zu setzen und die Anzahl Ihrer TP zu verwalten . Sie können diesen Experten für verschiedene Währungspaare, CFDs, Kryptowährungen und Aktien verwenden.
Die grundlegende Formel für die Berechnung des Pip-Wertes und der Positionsgröße , die in diesem Experten verwendet wurde, sind:
Pipettenwert = Positionsgröße * (Wechselkurs (Basiswährung) / Einstiegskurs) * Kontraktgröße * Ziffern Exp. Kontowährun
FREE

Eigenschaften:
- Steigung des gleitenden Durchschnitts für maximal vergangene Balken - Periode der Neigung - Schwellenwerte für die Steigung - Mehrere Slope-Typ-Optionen - Visuelle Darstellung der Steigung als Histogramm - Info-Panel anzeigen/ausblenden Neigungsberechnungen und -typen:
Der Neigungswert wird anhand der Neigungsperiode berechnet. Angenommen, die Periode ist 5, dann wird der MA-Wert für Balken (x) und Balken (x+5) geprüft. Und findet den Steigungswinkel zwischen ihnen.
Eine ausf
FREE

Gartley Hunter - Ein Indikator für die Suche nach harmonischen Mustern (Gartley-Muster) und deren Projektionen. Der Indikator ist mit einem System von Alarmen und Push-Benachrichtigungen ausgestattet. Manual (Be sure to read before purchasing) | Version for MT5 Vorteile
1. 12 harmonische Muster: 7 klassische und 5 exotische. Neue Muster werden mit der Entwicklung des Indikators hinzugefügt. 2. Ständige automatische Suche nach harmonischen Mustern. Der Indikator ist in der Lage, von den kleinste

Es wird Ihren funktionierenden Expert Advisor oder den manuellen Handel mit aktuellen Informationen perfekt ergänzen.
Es gibt eine akustische Benachrichtigung bei Überschreitung der festgelegten Gewinn- und Verlustlimits von offenen SELL- und BUY-Orders.
Außerdem werden für jedes Währungspaar EURUSD, GBPUSD, XAUUSD und andere verschiedene akustische Warnungen in englischer Sprache aktiviert. Die Ergebnisse werden ab dem Zeitpunkt der Aktivierung des Indikators in einem speziellen Panel auf dem C

Diese Strategie ist am besten für Scalping und Binäre Optionen geeignet. Strategie: Es gibt 3 EMAs: Schneller, Mittel und Langsamer. Wenn sich der Kurs im Trend befindet, warten Sie, bis der Kurs einen EMA überspringt, und skalieren Sie bei jedem Überspringen. Merkmale: - Prüfen, ob 3 MAs gestapelt sind - Prüfen Sie, ob der Kurs von den MAs abprallt (Schneller, Mittel, Langsamer) - Min. Abstand zwischen Faster und Medium MA Filter - Maximaler Abstand zwischen Einstiegskurs und schnellerem MA-Fil

Der Bridge-Indikator zeigt potenzielle Einstiegspunkte auf dem Chart als Signale an (Punkte der absoluten Trendumkehr).
Der Algorithmus des Forex-Indikators Bridge wurde auf der Grundlage der ursprünglichen Indikatoren für die Suche nach Extremen erstellt. Der Indikator ist gut geeignet, um eine Umkehr oder einen großen, scharfen Ruck zu einer Seite zu bestimmen, dank ihm werden Sie wissen, wann dies geschieht, er wird Sie mit dem Erscheinen eines blauen Punktes benachrichtigen, um zu kaufen,

Factor EA ist ein vollautomatischer Expert Advisor für Scalping-Strategien, der auf dem M1-Zeitrahmen läuft. Die Einstellungen des Advisors basieren auf einer sicheren Handelsstrategie, deren Kern darin besteht, die Transaktion bei Erreichen einer positiven Rentabilitätsdynamik von mehreren Punkten zu schließen, was dem Benutzer ermöglicht, die Kosten für die Eröffnung von Verlustgeschäften zu reduzieren. Der EA ist multifunktional und erfordert keine bestimmte Art von Konto für den normalen Be
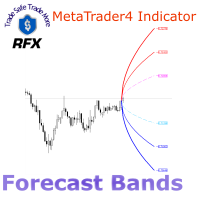
Der RFX Forecast Bands Indikator berechnet die drei signifikanten Konfidenzniveaus 99%, 95% und 68% der Preisbewegung für eine konfigurierbare Anzahl von Balken in der Zukunft. Die Berechnungen beruhen auf einer statistischen Analyse der jüngsten Kursveränderungen eines Vermögenswerts. Diese Niveaus können für viele verschiedene Zwecke in Handelssystemen verwendet werden. Sie können zum Beispiel zur effektiven Festlegung der Zielgewinn- und Stop-Loss-Niveaus verwendet werden. Die extremen oberen

Ilan Universal ist ein automatischer Berater (Handelsroboter), der für den Handel auf allen Finanzmärkten eingesetzt wird. Er ist sowohl bei Anfängern als auch bei erfahrenen Händlern gefragt, da er die exakte Ausführung der Handelsregeln der gewählten Strategie, die Verringerung der Anzahl der subjektiven Fehler und die Entlastung der Zeit des Benutzers ermöglicht. Die empfohlene Einlage beträgt 10.000 $. Der große Wert dieses Algorithmus ist die Möglichkeit der Optimierung durch Eröffnungskur

Der Qv² Halifax - Indikator wurde durch eine komplexe Reihe von Berechnungen entwickelt, die darauf abzielen, Kauf- und Verkaufssignale leicht zu erkennen.
Kaufsignale werden durch Pfeile nach oben angezeigt.
Verkaufssignale werden durch nach unten zeigende Pfeile angezeigt.
Ein wichtiges Detail: Damit der Indikator funktioniert, müssen die Zeitrahmen M1, M5. M15. M30, H1 D1 müssen alle aktualisiert werden.
Er kann für alle Paare verwendet werden (ich verwende ihn für Gold).
Es ist ein seh

Dieses Tool ist sehr hilfreich beim Handel und bei der Steigerung der Gewinne, indem bestimmte (in den Einstellungen definierte) Trades mit gleichen Abständen platziert werden, wenn Sie Kauf-/Verkaufsaufträge erteilen. Es hilft bei der Absicherung des Kontos durch die Verwendung der Layering-Methode. Sobald der Kurs den ersten TP erreicht, verschiebt der EA den SL auf das Einstiegsniveau, und sobald der Kurs den zweiten TP erreicht, verschiebt der EA den Kurs auf das erste TP-Niveau. Alle TP und

Ein intelligenter Analyst STD-Roboter der nächsten Generation. Unter Berücksichtigung aller erdenklichen Fallstricke beim Testen und Arbeiten im realen Modus. Der Bot kann durch die Eröffnung Preise optimiert werden, und arbeiten auf allen Ticks ohne Probleme. Der Bot hat zwei Versionen, es kann erfolgreich arbeiten sowohl auf mt4 und mt5, sowohl auf Netting-und Hedging-Konten. Für diejenigen, die eine der Versionen des Bots gekauft haben, wird die zweite Version zum halben Preis angeboten. Der
Bereit, den Quellcode zu verkaufen, für Details kontaktieren Sie bitte in privaten Nachrichten.
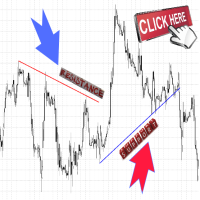
Der Indikator zeichnet horizontale Unterstützungs- und Widerstandslinien, schräge Unterstützungs- und Widerstandslinien, Dreiecke. Funktioniert auf allen Instrumenten und Zeitrahmen.
Dieser Indikator kann im Handel verwendet werden, wobei er sich auf den Ausbruch und den Durchbruch von Niveaus sowie auf die Ausrichtung von Stop-Losses konzentriert.
Der Indikator löscht die Niveaus nicht, sie verble

Wir sind stolz darauf, unseren neuesten Expert Advisor zu präsentieren, der von unseren Handelsspezialisten und Programmierern entwickelt wurde die die wahrscheinlichsten Kursniveaus gefunden haben, auf denen institutionelle Firmen, Banken, Hedge-Fonds und andere große Unternehmen ihre Aufträge. Der Expert Advisor ist so voreingestellt, dass er bei diesen speziellen Niveaus ein Grid-Order-System startet, das einen eingebauten intelligenten Algorithmus, um diese Niveaus zu erkennen. Der Expert A

NEW : Integration mit Ofir Signals, um personalisierte Alarme zu senden Ofir Notify ist ein Tool, das Benachrichtigungen über Trades an Telegram sendet Alarmierung bei jedem Ereignis, das eine Position betrifft: Eröffnung, Schließung, Änderung (SL, TP) Senden von Alarmen an Chats, Gruppen und Kanäle Alarmierung bei Equity-Änderungen Anzeige des Risikos, der Belohnung und des Verlaufs von Gewinn/Verlust für jede Position Individuelle Anpassung von Alarmen Senden von Charts-Screenshots mit Alarme
FREE

Handelssystem mit 1% Risiko je mehr Geld auf dem Konto ist, desto größer ist das Los, aber das Risiko ist 1%
Erste Einzahlung 50.00 Spread 10 Nettogewinn 6.71 Gesamtgewinn 51.97 Gesamtverlust -45.26 Rentabilität 1.15 Erwartung des Gewinns 0.02 Absoluter Drawdown 26.79 Maximaler Drawdown 29.21 (55.47%) Relative Absenkung 55.47% (29.21) Gesamte Abschlüsse 427 Short-Positionen (% der Gewinner) 219 (72.60%) Long-Positionen (% der Gewinner) 208 (72.12%) Gewinnbringende Abschlüsse (% aller Absch

** Alle Symbole x Alle Zeitrahmen scannen nur durch Drücken der Scanner-Taste ** *** Kontaktieren Sie mich , damit ich Ihnen eine Anleitung schicken und Sie in die "ABCD-Scanner-Gruppe" aufnehmen kann, um Erfahrungen mit anderen Benutzern auszutauschen oder zu sehen. Einführung Dieser Indikator scannt AB=CD Retracement-Muster in allen Charts. Das ABCD ist ist die Grundlage für alle harmonischen Muster und hoch repetitiv mit einer hohen Erfolgsrate . Der ABCD-Scanner-Indikator ist ein ABCD-Umkeh

NEW : Integration mit Ofir Signals, um personalisierte Alarme zu senden Ofir Notify ist ein Tool, das Benachrichtigungen über Trades an Telegram sendet Alarmierung bei jedem Ereignis, das eine Position betrifft: Eröffnung, Schließung, Änderung (SL, TP) Senden von Alarmen an Chats, Gruppen und Kanäle Alarmierung bei Equity-Änderungen Anzeige des Risikos, der Belohnung und des Verlaufs von Gewinn/Verlust für jede Position Individuelle Anpassung von Alarmen Senden von Charts-Screenshots mit Alarme

Wenn Sie dieses Projekt mögen, hinterlassen Sie eine 5-Sterne-Bewertung. Oft sind wir mit Brokern, die außerhalb der GMT-0 Zeitzone sind, diese
nicht nur Dinge kompliziert, aber, es kann zu sehen, wenn eine Trading-Sitzung beginnt
ein bisschen schwieriger, als es sollte. Mit diesem Indikator können Sie einen Zeitzonen-Offset einstellen, der eine vertikale Linie für den: Tag. Woche. Monat. Quartal. Jahr.
FREE
Hochgradig konfigurierbarer Force-Index-Indikator. Merkmale: Hochgradig anpassbare Alarmfunktionen (bei Levels, Kreuzen, Richtungsänderungen per E-Mail, Push, Sound, Popup) Multi-Timeframe-Fähigkeit Farbanpassung (bei Pegeln, Kreuzen, Richtungsänderungen) Optionen für lineare Interpolation und Histogramm-Modus Funktioniert im Strategie-Tester im Multi-Timeframe-Modus (auch am Wochenende ohne Ticks) Einstellbare Levels Parameter:
Force Index Timeframe: Sie können den aktuellen oder einen höheren
FREE

Spread und Gewinn hängen von Greed_Size = 1 bis 1000 ab. 1% = am sichersten, wird die Position früher verlassen bei 100% = Lotberechnung wird maximal sein bei 200% = maximal verdoppelt, der Ausstieg aus der Position wird ebenfalls verzögert. Symbol XAUUSD (Gold (Spot)) Zeitraum 1 Minute (M1) 2022.01.10 01:05 - 2022.01.21 23:54 (2022.01.08 - 2022.01.24)
Barren in der Geschichte 9896 Modellierte Ticks 629527 Qualität der Modellierung 25.00% Fehler bei der Diagrammabweichung 0 Ursprüngliche Ein

Dieser Expert Advisor ist speziell für XAU USD oder GOLD optimiert. Sie können es auch andere Währungen und Insturments verwenden. Optimierte Parameter für M5 Zeitrahmen in XAU USD, ecn Broker, niedriger Spread und niedrige Kommission. Andere erfolgreiche Ergebnisse können M15 , H1 und H4 Zeitrahmen mit verschiedenen Einstellungen gefunden werden. Ich werde später weitere Zeitrahmeneinstellungen hinzufügen. * Bevor Sie die Strategie testen, vergewissern Sie sich, dass die Daten in der Historie I
Der leistungsfähige Trendindikator zeigt den aktuellen Trend perfekt an. Der Powerful Trend Indikator wird nicht neu gezeichnet und ändert seine Werte nicht. Ich empfehle Ihnen, drei Perioden des Indikators zu verwenden, um Signale zu filtern. Der Powerful Trend Indikator zeigt den aktuellen Trend perfekt an. Der Powerful Trend-Indikator wird nicht neu gezeichnet und ändert seine Werte nicht. Ich empfehle Ihnen, drei Perioden des Indikators zu verwenden, um Signale zu filtern.

Diese Strategie verwendet einen langsameren RSI mit Periode 14, um zu verkaufen, wenn der RSI über den Wert von 55 ansteigt (oder zu kaufen, wenn der Wert unter 45 fällt), mit der klassischen Bollinger-Bänder-Strategie, um zu verkaufen, wenn der Preis über dem oberen Bollinger-Band liegt und darunter fällt (und zu kaufen, wenn der Preis unter dem unteren Band liegt und darüber steigt). Diese Strategie wird nur dann ausgelöst, wenn sich sowohl der RSI als auch die Bollinger-Bänder-Indikatoren gl

Der Indikator zeigt perfekt die Preisextreme an. Um mit diesem Indikator zu handeln, empfehle ich, mit Signalen älterer Zeitrahmen zu handeln. Der Indikator wird nicht neu gezeichnet und ändert keine Werte in der Geschichte. Der Indikator zeigt perfekt die Preisextreme an. Um mit diesem Indikator zu handeln, empfehle ich, mit den Signalen der höheren Timeframes zu handeln. Der Indikator wird nicht neu gezeichnet und verändert die Werte in der Historie nicht.

Indikator für Unterstützungs- und Widerstandsebenen. Er wird nicht neu gezeichnet und ändert seine Werte nicht, wenn Sie den Zeitrahmen wechseln. Sie können mit dem Indikator sowohl beim Durchbruch von Niveaus als auch beim Wiederanstieg von Unterstützungs- und Widerstandsniveaus arbeiten Indikator für Unterstützungs- und Widerstandsniveaus. Der Indikator wird nicht neu gezeichnet und ändert seine Werte beim Wechsel des Zeitrahmens nicht. Mit dem Indikator können Sie sowohl auf den Durchbruch de

Der Super-MA-Indikator ist ein Trendindikator und eignet sich hervorragend, um den aktuellen Trend zu erkennen. Er kann sowohl für Scalping als auch für den Intraday-Handel verwendet werden. Die Signale des Indikators werden nicht neu gezeichnet und ändern ihre Werte nach dem Schließen des Balkens nicht. Der Super-MA-Indikator ist ein Trendindikator und eignet sich hervorragend für die Bestimmung des aktuellen Trends. Er kann sowohl für das Scalping als auch für den Intraday-Handel verwendet wer
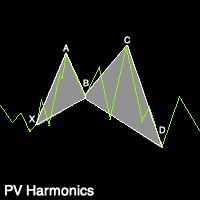
PV-Oberschwingungen - Zeichnet harmonische Dreiecke und Muster auf Live-Charts, um aktuelle harmonische Muster anzuzeigen. - Zeichnet Pfeile auf Charts über die harmonischen Muster, um erstklassige Ein- und Ausstiegspunkte zu signalisieren. - Äußerst schneller und vielseitiger Indikator. - Äußerst genau. - Zeichnet nicht nach. (Zeichnet keine Einstiegs-/Ausstiegssignale nach) - Kommt mit zahlreichen Anpassungseinstellungen.
Der Indikator für Unterstützungs- und Widerstandsniveaus zeigt perfekt alle Leistungsniveaus aller Zeitrahmen auf dem Chart an. Ich empfehle, die Niveaus der älteren Zeitrahmen zu handeln. Der Indikator für den aktuellen Zeitrahmen wird aktualisiert, sobald ein neues Setup auf dem Chart erscheint Der Indikator der Unterstützungs- und Widerstandsniveaus zeigt perfekt alle Leistungsniveaus aller Zeitrahmen auf dem Chart an. Ich empfehle den Handel auf höheren Zeitebenen. Der Indikator für den aktu
Der Volumenindikator ist ein hervorragender Assistent beim Handel. Der Indikator wird nicht neu gezeichnet und ändert seine Werte beim Wechsel der Zeitrahmen nicht. Der Volumenindikator MTF zeigt den aktuellen Trend auf den Charts an. Ich empfehle den Handel mit Signalen aus höheren Zeitrahmen. Der Volumenindikator ist ein großartiger Helfer beim Handel. Der Indikator wird nicht neu gezeichnet und ändert seine Werte nicht, wenn der Zeitrahmen gewechselt wird. Der MTF-Volumenindikator zeigt den a

Dies ist eine neue Strategie für SUPPLY DEMAND Bereiche Sie basiert auf einer Berechnung, bei der das Tick-Volumen verwendet wird, um die große Preisaktion auf dem Markt sowohl für Bären- als auch für Bullenaktionen zu erkennen. diese intelligenten Volumenkerzen werden verwendet, um die Angebots- und Nachfragebereiche zu bestimmen Preise zwischen den Hauptangebots- und -nachfragelinien zeigen einen Seitwärtsmarkt an Aufwärtspfeile werden angezeigt, wenn sich die Preise oberhalb der Hauptangebots
ZigZag wurde für die Analyse von Kursbewegungen mit einer bestimmten Amplitude entwickelt. Der Indikator zeigt nur die wichtigsten Umkehrungen an, was die Auswertung der Charts erheblich erleichtert. Die Pfeile zeigen den BAR an, an dem das letzte Low/High vollständig ausgebildet ist. ZigZag ist für die Analyse von Kursbewegungen mit einer bestimmten Amplitude konzipiert. Der Indikator zeigt nur die wichtigsten Umkehrungen an, was die Auswertung der Charts erheblich erleichtert. Die Pfeile zeige
FxGold Marathon BreakOut ist ein einfaches, aber effektives Handelssystem, das auf ausbrechenden Kurspartnern basiert. EA ist ein langfristiges stabiles Wachstum Handelssystem mit realistischen Ergebnis . EA wurde für XAUUSD (GOLD) entwickelt, ein volatiler und hochliquider Rohstoff. Eigenschaften: Konto-Schutz durch akzeptable konsekutive Verlust. Auto MM Brauchen Sie nicht schnell VPS nur Laptop oder PC und stabile Internetverbindung, können Sie am Wochenende herunterfahren dann starten Sie e

Trading Expert Advisor auf Breakout-Strategie mit der Verwendung von Martingal. Vik Plan B Like ist eine verkürzte Version von Vik Plan B mit minimalen Einstellungen. Es verwendet Candlestick-Analyse, um einen Handel einzugehen. Eingabeparameter: StartHour - Handelsbeginn StopHour - Handelsstopp FixLot - festes Los UseMartin_Mini - martin ein/aus Kol_ord - Begrenzung der Anzahl der Aufträge Schritt - martin Schritt MuitiLots - Lot-Multiplikator für martin MaxLot - Losgrenze für martin UseCloseAl

Der Super Ma Arrows-Indikator besteht aus einem modifizierten gleitenden Durchschnitt und Pfeilen. Der Indikator ist für das Scalping konzipiert. Der Super Ma Arrows-Indikator wird nicht neu gezeichnet und ändert seine Werte nicht, wenn Sie den Zeitrahmen wechseln. Der Super Ma Arrows Indikator besteht aus einem modifizierten gleitenden Durchschnitt und Pfeilen. Der Indikator ist für das Scalping konzipiert. Der Super Ma Arrows-Indikator wird nicht neu gezeichnet und ändert seine Werte beim Wech

Hallo Trader schönes Scalping-Tool
dieser Indikator Design für den besten Punkt zu finden, um den Markt in allen Zeitrahmen eingeben
Indikator kein Repaint, kein Redraw, kein Lagging sehr genauer Indikator Testen Sie es einfach in Strategie-Tester und sehen Sie selbst!
Sie können ihn für alle Paare und Indizes CFD verwenden Die Basis dieses Indikators ist cci, so dass Sie die Periode in den Eingabemasken des Indikators ändern können, aber die Voreinstellung ist bereits optimiert! Viel Glück
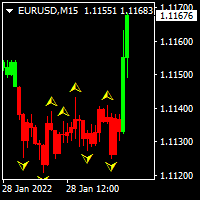
Dieser Indikator hilft Ihnen, Positionen aufzubauen und zu profitieren, wenn sich der Markt zu Ihren Gunsten wendet. Sie bauen Ihre volle Position auf, indem Sie viele kleine Positionen handeln. Wenn eine grüne Kerze auf dem Chart zu sehen ist, können Sie eine Long-Position aufbauen. Wenn eine rote Kerze auf dem Chart zu sehen ist, können Sie eine Short-Position aufbauen. Ich persönlich verteile meine große Position auf 5-10 kleine Positionen. Ich verwende ein kleines Ziel von 2-5 Pips für das E
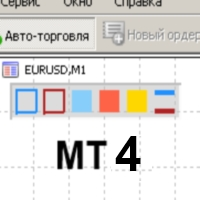
Color Levels ist ein praktisches Tool für alle, die technische Analysen mit Tools wie Trendlinie und Rechteck durchführen. Es ist möglich, zwei leere Rechtecke, drei farbige Rechtecke und zwei Trendlinien einzurichten. Die Einstellungen des Indikators sind sehr einfach und in nummerierte Blöcke unterteilt: Mit den Nummern 1 und 2 am Anfang - Einstellungen von leeren Rechtecken (Rahmen); Mit den Nummern 3, 4 und 5 - Einstellungen für farbige Rechtecke; Mit den Nummern 6 und 7 - Einstellungen von

Dieser Indikator hat einen universellen Handelsalgorithmus, der auf dem Preisimpuls basiert. Alles ist maximal vereinfacht - nur Kauf- und Verkaufssignale . Es gibt Alarme, damit Sie die Eröffnung einer Position nicht verpassen.
Erfordert keine Optimierung und zusätzliche Einstellungen!
Für alle Arten von Instrumenten: Währungen, Öl, Metalle, Kryptowährungen. Für alle Zeitrahmen: von M1 bis D1 . Für jeden Handelsstil: Scalping, Intraday, Swing, Long Term . Wenn Sie weitere Informationen benöt
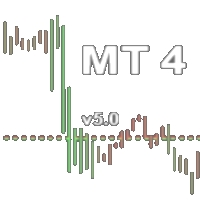
Der Indikator malt die Balken farbig an, die Wahl der Farbe basiert auf dem Handelsvolumen des Währungsinstruments. die vertikale Linie kann verschoben werden, um historische Daten zu studieren die horizontalen Linien sind für den maximalen und minimalen Balken verantwortlich grün großes Volumen rot kleines Volumen Einstellungen: Auswahl der Breite der Balkenfarbe Auswahl der Anzahl der Balken für die Berechnung
Es ist möglich, die Einstellungen individuell zu ändern: Ausgabe von Tonsignalen Au

Der Indikator (Aktuelle Stärke) wird in einem separaten Fenster durch ein blaues und rosa Histogramm dargestellt. Der Parameter NPeriod gibt die Anzahl der Balken an, auf denen wir die Variation der Kräfte berechnen. Der empfohlene Wert ist 5. Das blaue Histogramm misst die Kraft der Käufer , während das rosa Histogramm die Kraft der Verkäufer misst. Die Veränderung der Farbe zeigt die Veränderung der Kraft an, die den Preis beeinflusst. Jeder Rückgang (insbesondere unter 52,8) nach dem Erreiche

" Optopus GBPJPY ist eine gute Wahl für Anleger, die eine langfristige Investition in GBPJPY planen.
#Non-Martingale #Always SL #Robust #Adaptive #Voll automatisiert #AI #GBPJPY
Wir sind ein Team aus erfahrenen Händlern, Softwareentwicklern und Datenwissenschaftlern.
Optopus GBPJPY ist ein Non-Martingale-Expertenberater , der von unserer KI-gesteuerten Pipeline generiert wird, die diversifizierte Handelsstrategien aus 10-jährigen historischen Daten des GBPJPY-Marktes erlernt.
Das Optopus GB
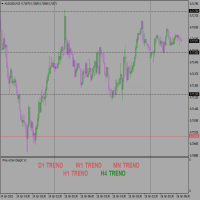
Dies ist ein Preis-Aktion-Händler Freude, Zu viel von Indikatoren sind schlecht auf dem Chart so auch zu viel der Analyse kann Analyse Lähmung verursachen. Keine Notwendigkeit für Top-Down-Analyse, Die EA tut, dass für Sie auf monatliche, wöchentliche, tägliche und 4 Stunden Trend Lesungen auf dem gleichen Fenster. Unterstützt alle Zeitrahmen des Handels. Erleichtert Ihren Handel und bringt ihn auf die nächste Stufe. Seine neue und erste seiner Art mit 5yrs Entwicklungsprozess. Arbeiten Sie einf
Dieser Indikator hilft Ihnen, in die richtige Richtung des Marktes zu handeln, indem Sie die Tendenz des Marktes kennen. Wenn Sie ein Swing-Trader sind, ist dies der beste Indikator für Sie. Sie werden die Tendenz einfach oben rechts auf Ihrem Chart/Bildschirm sehen. Sie können manchmal auf Umkehrungen warten und dann mit dem Trend/Bias fortfahren. Der Indikator basiert auf gleitenden Durchschnitten und zeigt die tägliche Tendenz des Marktes an. BEACHTEN SIE, DASS DIE TENDENZ NUR DEN TÄGLICHEN Z
Unterstützungs- oder Widerstandsniveaus bilden sich, wenn sich die Kursbewegung eines Marktes umkehrt und die Richtung ändert, wobei ein Höchst- oder Tiefststand (Swing-Punkt) auf dem Markt zurückbleibt. Unterstützungs- und Widerstandsniveaus können Handelsbereiche bilden. Der Indikator identifiziert Hoch und Tief auf der Grundlage der Periode.
Hauptmerkmale Ein Schlüsselkonzept der technischen Analyse besteht darin, dass sich die Rolle des Indikators umkehrt, wenn ein Widerstands- oder Unters

SouthEast ist ein Expert Advisor, der aus meiner Erfahrung im manuellen Handel entwickelt und automatisiert wurde. SouthEast wurde speziell entwickelt, um mit kleinen Einlagen maximale Gewinne zu erzielen, wobei die Sicherheit Ihrer Mittel im Vordergrund steht. Warum SouthEast?
SouthEast erfordert keine komplizierten Einstellungen und ist einfach zu bedienen, da der Benutzer nur eine bereits vorhandene Datei hochladen muss. Derzeit gibt es Setdateien für 20 Devisenpaare. Der beste GRID EA mit

Price Action Trade Panel MT4 berechnet den Saldo der Kauf-/Verkaufskraft jedes Symbols/Instruments basierend auf reinen Price Action-Daten der angegebenen (standardmäßig 8) vergangenen Kerzen. Auf diese Weise erhalten Sie die bestmögliche Marktstimmung, indem Sie die Preisbewegung von 32 Symbolen/Instrumenten überwachen, die auf dem Indikatorfeld verfügbar sind. Ein Kauf-/Verkaufsstärke-Niveau von über 60% ergibt ein recht solides Niveau für den Kauf/Verkauf des spezifischen Symbols (bei Verwen

DIVO EA ist ein währungsübergreifendes, flexibles, vollautomatisches und vielseitiges Tool zur Identifizierung von Schwachstellen im Markt Weihnachtsverkäufe ! Nur noch 8 von 10 Exemplaren übrig für 590 $ Nächster Preis 1475 $
Not Grid , Not Martingale , Not AI , Not Neural Network. Default Settings for One chart GBPUSD M15 (Supports 1OHLC mode for weak PCs) Einstellungen FAQ Optimierung Über Einstellungen Echte Überwachung Wie installiert man S
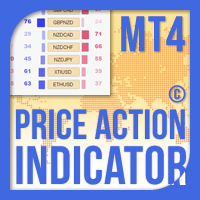
Der Price Action Indicator MT4 berechnet den Saldo der Kauf-/Verkaufskraft jedes Symbols/Instruments basierend auf reinen Price Action-Daten der angegebenen (standardmäßig 8) vergangenen Kerzen. Auf diese Weise erhalten Sie die bestmögliche Marktstimmung, indem Sie die Preisbewegung von 32 Symbolen/Instrumenten überwachen, die auf dem Indikatorfeld verfügbar sind. Ein Kauf-/Verkaufsstärke-Niveau von über 60% ergibt ein recht solides Niveau für den Kauf/Verkauf des spezifischen Symbols (bei Verw

Arbeitssymbol XAUUSD Arbeitszeitrahmen: M1 Mindesteinlage: $100 Mindesthebel 1:20 Eigenschaften:
Es werden keine Martingale, Gitter, Absicherungen oder andere gefährliche Methoden des Geldmanagements verwendet Der Stop-Loss ist sehr eng und der Take Profit ist maximal mit langen Pips mit Trailing Stop; wenn der Trailing Stop noch nicht bereit ist, wird der Gewinn durch einen Timer geschlossen Nicht sehr empfindlich gegenüber den Brokerbedingungen, aber je niedriger der Spread bei Gold, desto b

Rabatt-Roboter. Das Geld auf der Einzahlung dreht sich um Null, während viele Transaktionen getätigt werden und ein Rabatt angesammelt wird.Die Einzahlung wird nicht belastet, es gibt einen Stop-Loss und einen Take-Profit. Dies ist eindeutig ein Trend auf dem Tages-Chart. Bei langen Umkehrungen verliert der Roboter, aber es passiert sehr langsam und relativ sicher, daher wird empfohlen, den Trend mindestens einmal am Tag zu verfolgen und ihn auszuschalten, wenn es Anzeichen für eine Umkehrung au
Der Tick-Indikator
ist ein sehr leistungsfähiges Werkzeug für das Scalping. Es zeigt Ihnen die Auf- und Abwärtsbewegung auf dem Markt.
Auf diese Weise können Sie die Richtung viel schneller erkennen.
Der Indikator ist sehr einfach zu installieren und kann in allen Zeitrahmen und allen Paaren Forex, Bitcoin .....
Installieren Sie einfach die Datei im Indikatorordner Ihres MT4-Terminals, aktualisieren oder starten Sie das Terminal neu und ziehen Sie es auf das Diagramm, das Sie handeln möchte

Volatilität unter Kontrolle. Der Indikator zeigt die optimale Tiefe für die Festlegung von Zielen innerhalb des Tages und des durchschnittlichen Trends an. Er bildet auch Pivot-Zonen für die geschätzte Korrekturtiefe. Begleitend dazu werden die Schlüsselniveaus der Struktur für mehrere Zeitrahmen angezeigt. Für die Berechnung werden die klassischen Volatilitätsindikatoren ATR & ADX auf festen Zeitskalen verwendet. Die Berechnung berücksichtigt den Spread, und wenn der Markt leicht volatil ist, w
FREE
100% GARANTIERT!
Mit diesem Indikator können Sie den Trend der Finanzpaare erkennen, in denen er geladen ist. Anhand einer Pfeilgrafik, die sich definitiv NICHT wiederholt, zeigt Ihnen dieser Indikator, wohin der aktuelle Trend geht.
Er hat auch den Vorteil, dass Sie den Trend in den verschiedenen Zeiträumen (wie Sie in den Screenshots sehen können) in einer oberen Leiste sehen können, in der Sie die verschiedenen Zeiträume je nach Fall in grün (bullisch) oder rot (bärisch) sehen können. So kö

Piccoline ist ein sehr interessanter Trendindikator. Der Piccoline-Indikator hilft, entweder einen neuen oder einen bestehenden Trend zu erkennen. Einer der Vorteile des Indikators ist, dass er sich recht schnell neu aufbaut und auf verschiedene Veränderungen im Chart reagiert. Das hängt natürlich von den Einstellungen ab, nämlich von der angegebenen CalcBars-Periode. Je größer diese ist, desto glatter ist die Trendlinie. Je kürzer die Periode ist, desto mehr Marktgeräusche werden bei der Bildu

In monatelanger Arbeit haben wir mit Hilfe von Neuronalen Netzen das ultimative Tool entwickelt, das Sie zur Identifizierung von wichtigen Kursniveaus (Unterstützungen und Widerstände) sowie von Angebots- und Nachfragezonen benötigen. Perfekt geeignet, um Ihre Trades auszulösen, Ihre zukünftigen Aktionen festzulegen, Ihre Take Profit- und Stop Loss-Niveaus zu bestimmen und die Marktrichtung zu bestätigen. Der Preis wird sich immer zwischen diesen Niveaus bewegen, abprallen oder brechen; von eine

Sie können den Viking Trend-Indikator als Hauptindikator verwenden, um den Trend zu bestimmen. Der Indikator kann sowohl für Einstiegspunkte als auch als Filter eingesetzt werden. Es handelt sich um einen hybriden Trendindikator, da er auf den Signalen elementarer Indikatoren und einem speziellen Algorithmus für die Analyse basiert. Der Indikator gibt Informationen in visueller Form wieder und kann sowohl für Pipsing in kurzen Zeiträumen als auch für den langfristigen Handel verwendet werden. De
Das Prinzip dieses Indikators ist sehr einfach: Erkennung des Trends mit dem gleitenden Durchschnitt, Vorhersage von KAUF- und VERKAUFSSIGNALEN mit Pfeilen, Alarmen und Benachrichtigungen. Die Parameter sind festgelegt und automatisch auf D1 Zeitrahmen berechnet. Sie können mit kleinen Zeitrahmen handeln oder Dash DIY Ai Robot, Dash Smart Majors Strategy für Autotrading auf jedem Zeitrahmen und jedem Währungspaar verwenden. Sie können die Vorlage und die Voreinstellungsdatei für Autotrading mit
Das Prinzip dieses Indikators ist sehr einfach: Erkennung des Trends mit dem gleitenden Durchschnitt, Vorhersage von KAUF- und VERKAUFSSIGNALEN mit Pfeilen, Alarmen und Benachrichtigungen. Die Parameter sind festgelegt und automatisch auf M30 Zeitrahmen berechnet. Sie können mit kleinen Zeitrahmen handeln oder Dash DIY Ai Robot, Dash Smart M30 Strategy für Autotrading auf jedem Zeitrahmen und jedem Währungspaar verwenden. Sie können die Vorlage und die Voreinstellungsdatei für Autotrading mit Da
Das Prinzip dieses Indikators ist sehr einfach: Erkennung des Trends mit dem gleitenden Durchschnitt, Vorhersage von KAUF- und VERKAUFSSIGNALEN mit Pfeilen, Alarmen und Benachrichtigungen. Die Parameter sind festgelegt und automatisch auf M30 Zeitrahmen berechnet. Sie können mit kleinen Zeitrahmen handeln oder Dash DIY Ai Robot, Dash Smart Boxing5 Strategy für Autotrading auf jedem Zeitrahmen und jedem Währungspaar verwenden. Sie können die Vorlage und die Voreinstellungsdatei für Autotrading mi
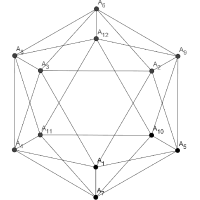
Extremums Max ist ein Indikator für Trend- und Handelssignale, der auf dem Prinzip einer kombinierten Analyse von berechneten Referenzpunkten innerhalb des Kanals sowie von überkauften und überverkauften Niveaus basiert.
Der Indikator bildet Pfeile (standardmäßig rot und blau). Der Indikator wird wie üblich auf ein beliebiges Handelssymbol mit beliebigem Zeitintervall gesetzt.
Vorteile des Indikators Hohe Genauigkeit; Arbeitet mit beliebigen Handelssymbolen; Funktioniert in beliebigen Zeitint
MetaTrader Market bietet jedem Entwickler eine einfache und bequeme Plattform für den Verkauf von Programmen.
Wir unterstützen Sie bei der Veröffentlichung des Produkts und beraten Sie gerne, wie man eine Beschreibung für den Market vorbereitet. Alle Produkte, die im Market verkauft werden, sind durch eine zusätzliche Verschlüsselung geschützt und können nur auf dem Rechner des Kunden gestartet werden. Illegales Kopieren ist ausgeschlossen.
Sie verpassen Handelsmöglichkeiten:
- Freie Handelsapplikationen
- Über 8.000 Signale zum Kopieren
- Wirtschaftsnachrichten für die Lage an den Finanzmärkte
Registrierung
Einloggen
Wenn Sie kein Benutzerkonto haben, registrieren Sie sich
Erlauben Sie die Verwendung von Cookies, um sich auf der Website MQL5.com anzumelden.
Bitte aktivieren Sie die notwendige Einstellung in Ihrem Browser, da Sie sich sonst nicht einloggen können.