Kostenpflichtige technische Indikatoren für den MetaTrader 4 - 97

The Fisher Transform is a technical indicator created by John F. Ehlers that converts prices into a Gaussian normal distribution. The indicator highlights when prices have moved to an extreme, based on recent prices. This may help in spotting turning points in the price of an asset. It also helps show the trend and isolate the price waves within a trend. The Fisher Transform is a technical indicator that normalizes asset prices, thus making turning points in price clearer. Takeaways Turning poi
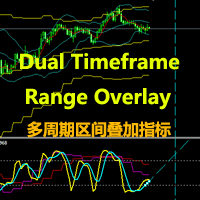
Don't miss any trading opportunities! Purchase the Dual Timeframe Range Overlay indicator today to make your trading analysis more intuitive and precise, helping you easily grasp market dynamics.
Are you looking for a more intuitive and accurate way to analyze market trends and catch trading opportunities? We present to you the Dual Timeframe Spatial Overlay indicator, a powerful tool that will help you predict potential price movements and accurately time your trades. The indicator consist

The standard RSI indicator is very helpful in identifying overbought or oversold areas during a flat, but gives a lot of false signals when the market is trending. For example: during an uptrend, the standard indicator often enters the "oversold" zone and extremely rarely (most often, when the trend has already ended) enters the "overbought" zone. This indicator takes into account the trend movement and, with the selected settings, can enter the zone opposite to the trend direction, giving a sig

This Rattling Signal Point indicator is designed for signal trading. This indicator generates trend signals.
It uses many algorithms and indicators to generate this signal. It tries to generate signals from the points with the highest trend potential.
This indicator is a complete trading product. This indicator does not need any additional indicators.
The indicator is never repainted. The point at which the signal is given does not change. When the signal comes the arrows are put back

This Great Entry System indicator is designed for signal trading. This indicator generates trend signals.
It uses many algorithms and indicators to generate this signal. It tries to generate signals from the points with the highest trend potential.
This indicator is a complete trading product. This indicator does not need any additional indicators.
The indicator is never repainted. The point at which the signal is given does not change. When the signal comes the arrows are put back one
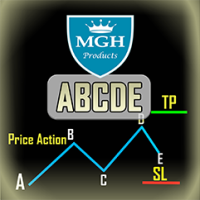
ABCDE-Indikator
Dieser Indikator basiert auf den primären abc-Mustern der Preisaktion (d.h. Ausbruch, Rückzug, Bewegung). Diese Muster ähneln dem Rallye-Basis-Rallye-Muster, und eine Reihe von Analysen wie Trendanalyse und Divergenzanalyse werden überprüft, um das genaue Signal auszugeben. Er bietet ziemlich genaue Handelssignale und sagt Ihnen, wann es am besten ist, einen Trade zu eröffnen und zu schließen. Er kann auf jedem Finanzinstrument angewendet werden: Devisen, Kryptowährungen, Metal
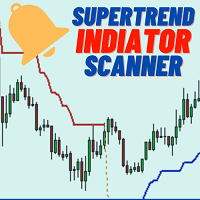
Welcome to the world of advanced trading with the Supertrend Indicator Scanner! Maximize your trading experience with our powerful MT4 indicator designed for seamless analysis and real-time insights. Key Features: Effortless Supertrend Scanning: Unlock the full potential of the Supertrend Indicator Scanner by effortlessly scanning multiple currency pairs. Receive instant alerts when specific Supertrend conditions are met, ensuring you stay ahead of market movements. Comprehensive Dashboard Insi
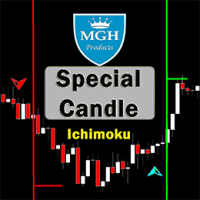
Besondere Kerze
Möchten Sie einen der besten Forex-Indikatoren mit einer erfolgreichen Ichimoku-Strategie verwenden? Sie können diesen großartigen Indikator verwenden, der auf der Ichimoku-Strategie basiert. Die MT5-Version finden Sie hier.
Erste Strategie:
Diese Strategie beinhaltet das Identifizieren ähnlich starker Kreuzungen, die selten vorkommen. Die besten Zeiträume für diese Strategie sind 30 Minuten (30M) und 1 Stunde (H1). Geeignete Symbole für den 30-Minuten-Zeitraum sind:
• CAD/J
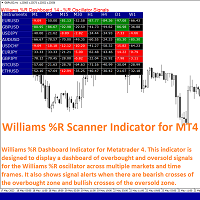
Williams R Scanner Indicator is a technical tool for Metatrader 4 designed to display a simple dashboard showing the values of the Williams %R oscillator across multiple markets and time frames of the trader's choosing. The dashboard also shows when the Williams %R indicator reaches an overbought or oversold condition which may precede market reversals.
The trader also has the option of viewing signal alerts on the platform that indicate when the Williams %R has made a bullish or bearish cros
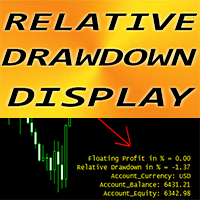
Forex Indicator "Relative Drawdown Display" for MT4 , Trading Support tool. This is MUST HAVE indicator for traders who use grid trading systems !!! Relative Drawdown Display indicator shows current Relative DD or Floating Profit in % on your account. PC and Mobile Alerts are built-in with adjustable Trigger level Indicator also indicates account Balance and Equity It is possible to locate indicator values in any corner of the chart : 0 - for top-left corner, 1 - top-right, 2 - bottom-le

Wir stellen Ihnen den Donchian Channels Indikator für MQL4 vor, ein leistungsstarkes technisches Analysewerkzeug, das darauf abzielt, Ihren Handelserfolg zu steigern. Dieser Indikator besteht aus vier Linien, die die oberen und unteren Grenzen der Preisbewegung über einen bestimmten Zeitraum darstellen. Mit dem Donchian Channels Indikator können Sie potenzielle Ausbrüche und Umkehrungen auf dem Markt leicht identifizieren. Die obere Linie zeigt das höchste Hoch des festgelegten Zeitraums an, wäh
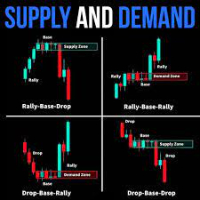
indicators included supply and demand indicator Specification Buy trade A SUPPORT zone (or immediately forms above the support zone) if the candle sticks are below either the middle or the lower band NO BUY TRADE IN THE RESISTANCE ZONE (RED HIGHLIGHTED ZONE), Sell trade A RESISTANCE zone (or immediately forms below the resistance zone) if the candle sticks are above either the middle or the upper band NO SELL TRADE IN THE SUPPORT ZONE (GREEN HIGHLIGHTED ZONE), In the supply zone, the prices are

Tendenceris - MT4 Trendindikator Tendenceris - Verbessern Sie Ihre Trading-Fähigkeiten! Mit diesem großartigen Indikator für MetaTrader 4 können Sie Trends in Echtzeit auf verschiedenen Zeitrahmen anzeigen. Verpassen Sie keine Handelsmöglichkeiten! Hauptfunktionen: Erkennt und zeigt Trends auf verschiedenen Zeitrahmen von 1 Minute bis 1 Tag an. Klare und intuitive Benutzeroberfläche, die Trendinformationen auf dem Chart übersichtlich darstellt. Wird in Echtzeit aktualisiert und liefert Ihnen die
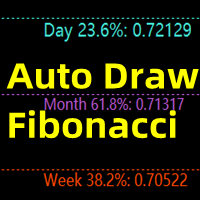
This indicator is mainly used to analyze future support and resistance levels for better trade analysis.
If the support level is effectively supported for many times, the market will break through the previous high point, and the effective trend breakout will be long.
After the down, the market cannot overshoot the pressure level for many times, and then goes down and breaks through the previous low price again, and the effective trend breaks through the short position.
When the marke
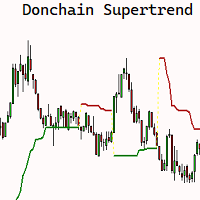
Der SuperChannel-Indikator für MQL4 ist ein leistungsstarkes technisches Analysewerkzeug, das entwickelt wurde, um Ihnen bei fundierten Handelsentscheidungen zu helfen. Basierend auf dem beliebten SuperTrend-Indikator bietet dieser Indikator einen einzigartigen Ansatz, bei dem Hochs und Tiefs über einen bestimmten Zeitraum anstelle der durchschnittlichen wahren Reichweite (ATR) zur Konstruktion der Linie verwendet werden. Der SuperChannel-Indikator ermöglicht es Ihnen, Markttrends leicht zu erke

Discover PM - Your Ultimate Precision Forex Indicator for Informed Trading Decisions! In the fast-paced and ever-changing world of Forex trading, having a reliable and accurate indicator can make all the difference between success and missed opportunities. Say hello to PM, the revolutionary Precision Momentum indicator, engineered to empower traders with unparalleled insights into market dynamics, volatility, and trends. At the heart of PM's power lies its ability to precisely identify moments

Pips Forex ist ein fertiges Handelssystem. Dieser Indikator zeigt mit Pfeilen im Diagramm an, wann und in welche Richtung Sie eine Order eröffnen müssen. Wenn der Pfeil grün ist, eröffnen wir ein Kaufgeschäft, und wenn der Pfeil rot ist, eröffnen wir ein Verkaufsgeschäft. Alles ist sehr einfach und sehr effektiv. TakeProfit setzt 15-25 Punkte. StopLoss auf Punktniveau eingestellt. Wenn sich die Punkte bewegen, überschreiben wir sofort den StopLoss. Empfohlener Zeitrahmen für den Handel mit M1 u

"TOP G ARROWS" shows price reversal points designed for scalping and intraday trading.
Contains internal reversal filters (ATR, HHLL, RSI). Can be used on all time frames and trading instruments. Can be used on M1, M5, M15 time frames for scalping or M30, H1, H4 for intraday trading, Recommended for M30 and H1. The arrows are built on candle close (appears on previous bar at the open of the new candle)

Thanks to this indicator, you can easily see the new ABCD harmonic patterns in the chart.
If the two price action lengths are equal, the system will give you a signal when it reaches the specified level.
You can set the limits as you wish. For example, You can get the signal of the price, which occurs in the Fibonaci 38.2 and 88.6 retracements, and then moves for the same length, at the level you specify. For example, it will alarm you when the price reaches 80% as a percentage.
In vertic

Welcome to the world of advanced trading with the RSI Multicurrency Scanner! Maximize your trading experience with our powerful MT4 indicator designed for seamless analysis and real-time insights. Key Features: Effortless RSI Scanning: Unlock the full potential of the RSI Multicurrency Scanner by effortlessly scanning multiple currency pairs. Receive instant alerts when specific Relative Strength Index (RSI) conditions are met, ensuring you stay ahead of market movements. Comprehensive Dashboar
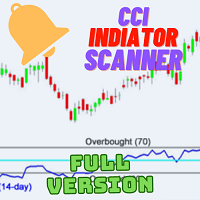
Welcome to the world of advanced trading with the CCI Multicurrency Scanner! Elevate your trading experience with our powerful MT4 indicator designed for seamless analysis and real-time insights. Key Features: Effortless CCI Scanning: Unlock the full potential of the CCI Multicurrency Scanner by effortlessly scanning multiple currency pairs. Receive instant alerts when specific Commodity Channel Index (CCI) conditions are met, ensuring you stay ahead of market movements. Comprehensive Dashboard

If you have been anywhere near Forex forums or social media lately, you have no doubt been hearing people talk about Smart Money Concepts (SMC) trading. You may be wondering what SMC is, and whether it deserves all the hype. In this post, we will introduce Smart Money Concepts trading to you so you can make an informed decision about whether or not to give this strategy a try in your own trading. What is SMC Forex trading? Smart Money Concepts (SMC) is one of many forex trading methods. SMC
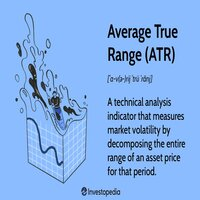
The "Wilder's Average True Range (ATR)" tool is used to measure the volatility of a financial instrument. It was developed by J. Welles Wilder Jr. and is commonly used by traders to assess the potential price range and volatility of an asset. The ATR indicator provides valuable information for setting stop loss levels, determining position sizes, and identifying potential breakouts. Here's how to use the "Wilder's Average True Range (ATR)" tool: Install the indicator: Add the ATR indicator to yo

The Time Segmented Volume (TSV) is a technical indicator that measures the volume of a financial instrument within specific time segments. It helps traders identify buying and selling pressure based on volume analysis. The TSV indicator can be used as part of a trading strategy to generate trade signals and confirm market trends. Let's explore how to use the TSV indicator as a trading strategy. To begin, add the TSV indicator to your trading platform. The TSV is typically represented as a line o
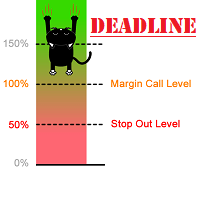
The indicator can display Stop Out, Free Margin and Margin Call lines on the chart. Y ou can also set your own line at the custom level.
Displaying these lines on the chart is especially useful for people who trade with high leverage or go all-in, where the risk is very high. You can adjust the line color, style, thickness and visibility ( for each one separately). The last parameter that can be changed is the refresh interval. If you have open orders on several stocks, the line levels will c

The Chaikin Oscillator is a technical indicator developed by Marc Chaikin that combines price and volume data to measure the accumulation and distribution of a financial instrument. It aims to identify potential buying and selling opportunities in the market. The Chaikin Oscillator is calculated by subtracting a 10-day exponential moving average of the Accumulation Distribution Line (ADL) from a 3-day exponential moving average of the ADL. Here's how to use the Chaikin Oscillator indicator in tr

Indicator show best signals for buy and sell orders. Indicator uses only 2 inputs: DEMA Fast Period - fast double exponential moving average period DEMA Slow Period - slow double exponential moving average period Crossings of fast and slow double double exponential moving averages shows buy and sell signals, which are drawn as green and magenta arrows respectively.

Indicator show best signals for buy and sell orders. Indicator uses only 3 inputs: DEMA Fast Period - fast double exponential moving average period DEMA Slow Period - slow double exponential moving average period DEMA Trend Period - trend double exponential moving average period
Position of price according to trend double double exponential moving average and crossings of fast and slow double double exponential moving averages shows buy and sell signals, which are drawn as gree

Indicator show best signals for buy and sell orders. Indicator uses only 2 inputs: PEMA Bounce Period - bounce percentage exponential moving average period PEMA Confirm Period - confirm percentage exponential moving average period Positions of price according to bounce and confirm percentage exponential moving averages and directions of bounce and confirm percentage exponential moving average shows buy and sell signals, which are drawn as green and magenta arrows respectively.
Automated Supply and Demand Trading Edge MT4 These videos demonstrate how we apply the supply and demand system to our latest trading review and market analysis. US Tech 100 Index Trade Setup time laps 12/6/2023. https://youtu.be/zHdjHnr3GNo https://youtu.be/JJanqcNzLGM , https://youtu.be/l70MIHaQQa4 , https://youtu.be/pg0oiT5_8y0 Enhance your Trading Strategy with the Supply and Demand Trading Edge MT4. Gain a competitive market advantage with the Supply and Demand Trading Edge MT4

The indicator has been designed to function on any time-frame and any pair. This regime filter will help the trader better evaluate whether the current market is trending, and in which direction. It quickly reacts to changes in market dynamics using a series of advanced calculations. The user is able to select whether the calculation remains standard, or if a further filter constraint is added to the calculation. A Yellow moving average of the signal has been included for the trader to smoot
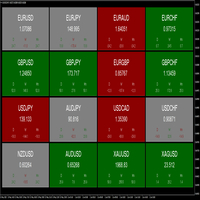
The dashboard indicator has been designed to quickly show the trader the price movements of various currency pairs. The user is able to select 3 different timeframes to analyse. When the pip difference for each respective timeframe is either positive or negative, the pair block will be coloured green or red respectively. This allows the trader to view which timeframes are in agreement, as well as the pip movements therein. A good visual tool to view multiple pairs and timeframes at once. T
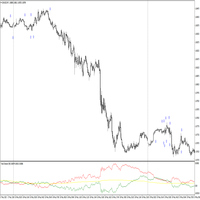
The indicator has been designed to function on any time-frame and any pair, although it is best suited for 5-minute charts. This trend filter will help the trader better evaluate whether the current market is trending, and in which direction. A dynamic filter threshold has been added to help the trader avoid choppy market conditions, and add greater confidence when entering, with an added functionality of plotting signal arrows on the chart to aid in detecting possibly entries. The Yellow in
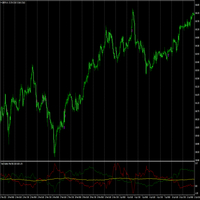
The indicator has been designed to function on any time-frame and any pair, although it is best suited for currency pairs on 5-minute charts, and used in conjunction with the Trend Direction Filter Indicator . This trend volatility filter will help the trader better evaluate whether the current market is trending, and in which direction. A dynamic filter threshold has been added to help the trader avoid choppy market conditions, and add greater confidence when entering, with an added functiona
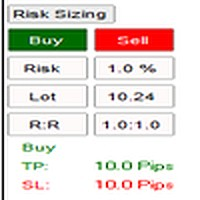
The indicator has been designed to function on any time-frame and any pair. The user is able to input their desired risk percentage per trade based on their account size, and choose whether they wish to calculate risk based on a limit order or market order. When initialised, a non-invasive button will appear on the left-hand side of the chart. Upon selection, a drop down will appear with a Buy and Sell button, these will in turn place movable lines on the chart that are used to appropriately
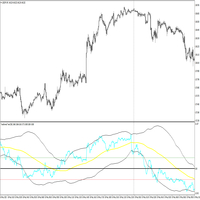
The indicator has been designed to function on any time-frame and any pair, although it is best suited for 5-minute charts. This price transformation will help the trader better evaluate whether the current market is trending, and in which direction. A dynamic filter has been added to help the trader avoid possibly entering against the trend. Two filter threshold lines may enable the trader to avoid choppy or flat market conditions. The Yellow indicator line is the filter and the Blue indica
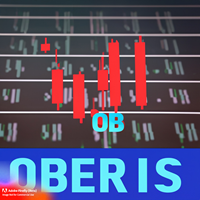
Möchten Sie Ihren Handel mit einem Orderblock-Indikator verbessern? Auftragsblöcke sind Bereiche des Marktes, in denen sich Kauf- oder Verkaufsaufträge anhäufen, die zu Trendänderungen oder starken Bewegungen führen können. Die Identifizierung dieser Orderblöcke kann sehr hilfreich sein, um Ein- und Ausstiegsmöglichkeiten zu finden sowie Risiken und Gewinne zu verwalten. Das manuelle Auffinden dieser Bestellblöcke kann jedoch schwierig und mühsam sein. Aus diesem Grund haben wir Oberis entwickel
Supply and Demand Tracker MT4
US PPI, Fed Interest Rates, and FOMC Trade Setup Time Lapse: U.S. dollar(DXY) and Australian dollar vs U.S. dollar(AUD/USD) https://youtu.be/XVJqdEWfv6s May CPI Trade Setup Time Lapse: Gold, Euro/US dollar, US Tech 100, and USDX Experience the power of our cutting-edge supply and demand system as we delve into the captivating world of market dynamics surrounding the release of the consumer price index (CPI). Our system, built on the principles of supply and dema
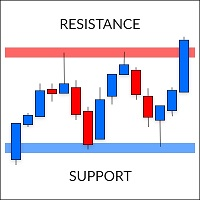
Supports and Resistances is a quick and easy tool for finding support and resistance levels. It was created according to the "run and forget" idea to automate daily routines and speed up the decision-making process.
The indicator analyzes the chart and determines all the zones found with the power assigned to them. Power in this case means the amount of confirmation. The zones are classified into three types: weak, normal and strong - each with a different color. The program implements two ty

Wir stellen den Hull Moving Average Scanner vor, einen fortschrittlichen Multisymbol- und Multitimeframe-Indikator für MT4. Dieses leistungsstarke und vielseitige Tool wurde entwickelt, um Ihre Handelsentscheidungen zu verbessern. Der Indikator berücksichtigt den Hull Moving Average (HMA) und bietet zusätzliche Funktionen für schnelle und zuverlässige Warnungen. Mit dem Hull Moving Average Scanner können Sie von den einzigartigen Eigenschaften des Hull Moving Average über mehrere Währun

Introducing the Gold Multiply Funds EA - a revolutionary trading tool that is based on the powerful principle of compounding. MT4 Version : https://www.mql5.com/en/market/product/90177
MT5 Version : https://www.mql5.com/en/market/product/95784
Brief description EA for XAUSUD: AI & machine learning detect/respond to market trends with precision. Trading Strategy Advanced pattern recognition using AI and Machine learning for profitable trades 65-70% correct prediction accuracy in 10

Wir stellen den Moving Average Crossover Scanner Pro vor, einen leistungsstarken und vielseitigen Multi-Symbol-Scanner. Mehrere Zeiträume Indikator, der Ihre Handelsentscheidungen verbessern soll. Dieser fortschrittliche Indikator umfasst Kreuzungen des gleitenden Durchschnitts (MA) und bietet zusätzliche Funktionen, um schnelle und zuverlässige Warnungen bereitzustellen.
Mit dem Moving Average Crossover Scanner Pro können Sie von den einzigartigen Eigenschaften von MA-Crossovers
Einführung des "Draw On Chart Indicator": Entfesseln Sie Ihre Kreativität auf den Charts!
Sind Sie es leid, sich beim Annotieren Ihrer Handelsdiagramme abzumühen, um Ihre Analysen zu verstehen oder Ihre Ideen effektiv zu kommunizieren? Suchen Sie nicht weiter! Wir präsentieren stolz den Draw On Chart Indicator, ein bahnbrechendes Werkzeug, das es Ihnen ermöglicht, mühelos mit nur wenigen Klicks oder Strichen Ihres Stiftes direkt auf Ihren Charts zu zeichnen und zu annotieren.
Unser innovati
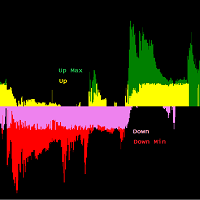
Trend Reversal Identifier es un indicador de análisis profundo que no repinta de alto rendimiento que sirve para detectar y confirmar Pullbacks, Soportes y Resistencias. También posee un alto valor para detectar divergencias al tener los movimientos alcista y bajistas dados por separado con mucha claridad. Debido a la estructura implícita del algoritmo es plenamente válido para cualquier par/periodo y no necesita configuración. Tenemos dos zonas principales: Zona Up y Zona Down, las cuales a s

URGENT REMINDER> Only 5 remaining Copies for next unlimited price to be 360$ (THIS IS A SPECIAL OFFER TOOL) If you are looking for FAST , RELIABLE and PROFITABLE indicator to help you take easy trades then this is the tool to go with. Trading is very tricky, frustrating, confusing, embarrassing and even can make you go broke if you approach the market with gambling mindset, poor entry and exit strategies, unreliable indicators or signals, poor money management skills and lack of knowledge. Many
Sind Sie es leid, unzuverlässige binäre Optionen Indikatoren zu verwenden, die falsche Signale liefern und zu Verlusten und Frustration führen? Suchen Sie nicht weiter als den CLOCK INDICATOR - den besten binären Optionsindikator, der für die MT4-Handelsplattform verfügbar ist!
Mit seinem fortschrittlichen Algorithmus und leistungsstarken technischen Analysetools ist der CLOCK INDICATOR das ultimative Handelsinstrument sowohl für Anfänger als auch für erfahrene Trader. Er prognostiziert Markt

The Binary Tend Follower indicator has been designed especially for Binary options trading. The best time frame to use the indicator on is a 1M chart with 1Min expiry's as soon as the signal candle closes. There is no need to over complicate your trading as all the thinking has been done for you. The indicator was designed as simple as possible to take out all the subjectivity of trying to follow a complicated strategy, and allowing the trader to focus on extremely simple entry's. Buy: When th

Erleben Sie die Leistungsfähigkeit des Parabolic Breakout Scanner Pro, eines fortschrittlichen Multisymbol- und Multitimeframe-Indikators, der Ihre Handelsreise verändern wird. Mit beispielloser Genauigkeit ermöglicht Ihnen dieser Indikator, SAR-Ausbrüche zu erkennen und zeitnahe Benachrichtigungen über optimale Ein- und Ausstiegspunkte zu erhalten. Entdecken Sie den Komfort eines benutzerfreundlichen Dashboards, anpassbarer Parameter, automatischer Chartöffnung und eines umfassenden Warnsystems

The indicator visualizes the result of the CalculateScientificTradePeriod script (which, of course, also needs to be downloaded), which, firstly , estimates how many Mx bars of the active chart the future trend will most likely continue and what is its quality, and, secondly , calculates the optimal the averaging period (which is also equal to Mx) of the ScientificTrade indicator, which gives the maximum profit according to the extremely effective ScientificTrade strategy. For the FindS

Scalping Entry Points - ist ein manuelles Handelssystem, das sich an Preisbewegungen anpassen und Signale für offene Geschäfte ohne Neuzeichnung geben kann. Der Indikator bestimmt die Richtung des Trends anhand des zentralen Unterstützungs- und Widerstandsniveaus. Der Punktindikator liefert Signale für Ein- und Ausstiege. Geeignet für manuellen Intraday-Handel, Scalping und binäre Optionen. Funktioniert für alle Zeitrahmen und Handelsinstrumente.
Der Indikator gibt verschiedene Arten von Warnun

Jerk Trend is a new product that allows you to identify the current market phase (uptrend, downtrend or flat). Represents a typical investor strategy that usually indicates a trend change from bearish to bullish. A tool that allows you to determine the direction and strength of a trend. Unlike most indicators, Jerk Trend finds longer-term trends and gives fewer false signals.
This indicator displays arrows of different colors depending on the current state of the market and thus signals the u

Wir stellen Ihnen den F-16 Plane Indicator vor, ein hochmodernes MT4-Tool, das Ihr Trading-Erlebnis revolutionieren wird. Inspiriert von der unvergleichlichen Geschwindigkeit und Präzision des F-16-Kampfflugzeugs kombiniert dieser Indikator fortschrittliche Algorithmen und modernste Technologie, um eine beispiellose Leistung auf den Finanzmärkten zu bieten. Mit dem F-16 Plane Indicator schweben Sie über der Konkurrenz, da er Echtzeit-Analysen liefert und äußerst präzise Trading-Signale generiert

Ready-made trading strategy on the signals of the "Myforexfunds" indicator:
1. Market entry point: When the indicator draws a blue line, open the cover to buy (long). When the indicator draws a red line, open the cover to sell (short). You can enter the market at the close of the bar, when a new signal is formed.
2. Market exit point: Set-stop-loss (stop-loss) at the old distance from the entry point, eliminating potential losses in case of wrong market direction. For example, you can set a

The Accurate Werewolf indicator tracks market trends, ignoring sharp swings and market noise. The indicator can work both for entry points and as a filter.
The Accurate Werewolf indicator displays information in a visual way. It will help in finding entry points in the analysis. Suitable for trading on low timeframes because it ignores sudden price spikes or corrections in price action by reducing market noise around the average price.
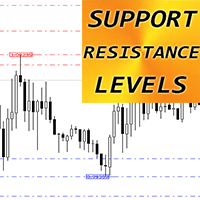
Forex Indicator "Support Resistance Levels" for MT4 Indicator " Support Resistance Levels" is very useful auxiliary indicator for trading 'Support' and 'Resistance' are important zones on chart respected by price
Support level is where the price regularly stops falling and bounces back up
Resistance level is where the price normally stops rising and dips back down I ndicator " Support Resistance Levels" shows the recent levels: Resistance levels - red lines. S upport levels - blue lines

The Shock Trend indicator shows the moments for entering the market with arrows. This is a hybrid indicator, as it is based on the signals of several two well-known products - the average true range indicator, which determines the range of minimum and maximum price fluctuations, as well as closing prices. As a result - indicates the current market volatility. Also an indicator of the oscillator family. The indicator helps to calculate the oversold and overbought levels of a trading instrument.

Love Trend indicator showing buy and sell areas. The indicator follows the price movement around the opening price. It also displays information about the trend following the breakout of the low and high. The indicator has a very simple but effective graphic: an orange dot is displayed above the open price, and a blue dot is displayed below the open price. The indicator also includes an audible alert and a pop-up window to alert you when the candle closes at these important levels. The indicator

When it comes to trading in the financial markets, there's no question that the banks have a major advantage. They have access to vast amounts of resources, including high-powered trading algorithms, in-depth market research, and teams of experienced traders. But what if you could level the playing field and trade like the banks do? That's exactly what our Smart Money Indicator allows you to do. By providing you with critical insights into market structure and supply and demand zones, you can ma
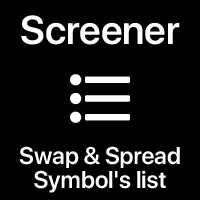
Market screener: Spread and Swap, for selected Symbols. You can customize the list: set only the Symbols (currency pairs) that are needed. The number of Symbols is unlimited. The list can be sorted in ascending or descending order (Symbol name). The panel can be moved to any place on the chart. You can also minimize the panel. Displayed values: Current market price (BID); Spread size; Swap, for Long positions; Swap, for Short positions; Overall P/L of the entire account; My #1 Utility : includ

TrendXplorer indicator is designed to provide valuable insights into market trends, helping you navigate the dynamic world of trading with confidence. Key Features: Accurate Trend Analysis: TrendXplorer utilizes a special algorithm to analyze trends combined with price action. This enables easier trend detection and is less prone to change during price manipulation. Built-in Risk Calculator: Take control of your risk management with TrendXplorer's built-in risk calculator. This feature assesses

Forex indicator "Search for a reversal" is a technical tool designed for traders involved in scalping in the Forex currency market. Scalping is a trading strategy that aims to make small profits from frequent trades on short-term time frames. The "Search for a reversal" indicator helps traders identify the best entry and exit points in the market, taking into account short-term trends and price fluctuations. The main purpose of the "Search for a reversal" indicator is to provide traders with th

Der Indikator ist wie eine Schwiegermutter, die oft redet, viel und oft unangemessen.
Der Indikator gibt uns nicht nur ein Einstiegssignal für Parameter, die ich dann auflisten werde, sondern überwacht auch den Trend des stündlichen Zeitrahmens, OSMA, um die Einstiegsrichtung zu verstehen, RSI, um überkaufte oder überverkaufte Bedingungen zu erkennen, von denen wir absehen sollten, ATR für Volatilität und ADX für den Trend.
Indikator nicht für Neulinge empfohlen.
Erst die menschliche Beurtei

The Structural Trend indicator helps to analyze the market on the selected time interval. It defines the mainstream. Easy to set up and works on all pairs and all time frames. Trend indicators make it possible to classify the direction of price movement by determining its strength.
Structural Trend is a trend trading and filtering solution with all the important features of a trend tool built into one tool! The Structural Trend indicator is a development for trend trading.
Good for any trad

TruRange is a Next-Level trend and range detection created from algorithms based on price action. No other indicator apart from ATR is used in the computing of the main line indicator
It separates Trending and Ranging market conditions without any lag. It's good to separate mean reverting strategies from trending/breakout strategies.
Settings : Bars : number of bars to compute Sensitivity : a lower value will have longer range periods while a higer value will have more smaller ranging peri
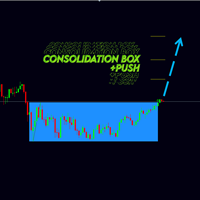
Новая версия индикатора консолидаций Consolidation box Generator. Предыдущая версия тут . Примеры настроек на индикатор тут . На данный момент этот инструмент анализа рынка уже нельзя назвать просто индикатором. Потому как это торговая стратегия. Наше ноу-хау заключается в том, что данный индикатор не требует огромного количества тестов в тестере стратегий. В индикаторе реализован блок статистики - при нанесении на график вам сразу будет видна результативность работы стратегии. Вы можете настро

The Relative Currency Strength Indicator is a tool designed to analyze and compare the strength of a quote currency against four different currency pairs on a selected timeframe. It provides a visual representation of the relative strength of currencies, helping traders identify potential trading opportunities. Key Features: Customizable quote currency: Select a specific currency to measure its strength against multiple currency pairs. Multi-timeframe analysis: Choose the desired timeframe to ev

Using the Arrow Effect forex indicator algorithm, you can quickly understand what kind of trend is currently developing in the market. The Elephant indicator accompanies long trends, can be used without restrictions on instruments or timeframes. With this indicator, you can try to predict future values. But the main use of the indicator is to generate buy and sell signals. The indicator tracks the market trend, ignoring sharp market fluctuations and noises around the average price. The indicator
Dear Forex Trader,
We all know that our fx products has remained the buzz of the forex market ever since its inception. Thanks to our subscribers who have been sending their trade history results to us in a viewable format. You've also seen the crazy consistent pips these subscribers generate on a daily basis, What boils down is just a question of whether or not you are ready to change your trading for the better this year. Why not include any of our trading packages in your investment plan t

XP Speed Meter the best indicator that measures the price/tick’s currency speed for you. It will give you the ability to know when the pair moving fast or slow . So, you can trade or not trade. It’s very important tool for scalper traders – news traders. Even for trend traders it will be useful to know if the market is trending fast or slow . XP Speed Meter is better than the volume type indicators of course. Because it shows the currency speed on the run-time without any lacking like what the v

Dear traders I am happy to introduce to you my new tool called "Brilliant Oscillator" Indicator. This is one of the indicators that can be used as a stand alone indicator. WHAT I LIKE ABOUT THIS TOOL IS Fast and reliable signals Purpose The purpose of this tool is to assist both newbie and Advanced traders to analyze the market with high level of accuracy in both bearish and bullish market trends. The inputs In the input section you will be able to change colors of the indicator only. Currency p
Erfahren Sie, wie man einen Handelsroboter im MetaTrader AppStore, dem Shop für Applikationen für die MetaTrader Handelsplattform, kaufen kann.
Das Zahlungssystem der MQL5.community ermöglicht Zahlungen mit PayPal, Kreditkarten und den gängigen Zahlungssystemen. Wir empfehlen Ihnen eindringlich, Handelsroboter vor dem Kauf zu testen, um eine bessere Vorstellung von dem Produkt zu bekommen.
Sie verpassen Handelsmöglichkeiten:
- Freie Handelsapplikationen
- Über 8.000 Signale zum Kopieren
- Wirtschaftsnachrichten für die Lage an den Finanzmärkte
Registrierung
Einloggen
Wenn Sie kein Benutzerkonto haben, registrieren Sie sich
Erlauben Sie die Verwendung von Cookies, um sich auf der Website MQL5.com anzumelden.
Bitte aktivieren Sie die notwendige Einstellung in Ihrem Browser, da Sie sich sonst nicht einloggen können.