Technische Indikatoren für den MetaTrader 4 - 2

Just another Auto Fibonacci Retracement indicator . However, this is the most Flexible & Reliable one you can find for FREE. If you use this indicator and you like it, please leave a review/comment. If you are looking for a more advanced Fibo indicator, check this Free Trend-Based Fibo indicator .
### FEATURES ### Auto-calculate up to 7 Fibonacci levels on your customized frame. Adjust levels as your need. Use High/Low price or Open/Close price to calculate. Freeze the levels and don't re
FREE

About:
A Fibonacci indicator is best used with other indicators like Pivots, Support/Resistance etc. Price tends to use Fibo levels as Support or Resistance lines. So, this indicator is very useful to know when price might reverse or if a level is crossed, price might continue the trend. Also, to find the best Take Profit and StopLoss lines. Don't use Fibo Indicator alone for trading as it might not always be accurate. Use it to make your strategies better as a supporting indicator.
Settings:
FREE

Auto Fibonacci Button The Fibonacci retracement is a popular and reliable technical analysis tool for traders to determine support and resistance areas. It employs the "Golden Ratio," a mathematical pattern seen throughout nature and even the universe, to forecast particular levels of support level and resistance level. This tool is generated in technical analysis by dividing the vertical distance between two extreme points on the chart (typically a peak and a low) by the important Fibonacci

Our 5 Star Best Seller Beginner or Professional our best selling multi-timeframe Pivot Prof will enhance your trading and bring you great trade opportunities with the Support and Resistance levels that professionals use. Pivot trading is a simple effective method for entering and exiting the market at key levels and has been used by professionals for decades and works on all symbols: Forex, Crypto, Stocks, Indicies etc. Pivot Prof brings premium levels to the trader where the market is most like
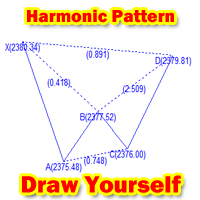
Are you a harmonic trader?
Are you still troubled by having to go to a T website to draw the harmonic index XABCD?
This tool for drawing harmonic indicators on MT4 is just for you!
Instructions: After loading the indicator on MT4, you can set the X postion and Y postion of the indicator. And the color of the line drawn by XABCD (default is blue) After loading the indicator, if postion have not changed, a "Draw" button will appear in the lower right corner by default. After the button
FREE

Der Chart High Low Indicator ist ein Indikator für META TRADER 4 mit der Funktion, die wöchentlichen MAXIMUM-, wöchentlichen MINIMUM-, monatlichen MAXIMUM- und monatlichen MINIMUM-Werte zu analysieren und anzuzeigen.
Dies kann beim Erstellen einer Trendlinie oder sogar beim Zeichnen Ihrer FIBONNACI-Linie sehr hilfreich sein, da für die Analyse der MAXIMUM-/MINIMUM-Werte kein Zugriff auf Internetseiten erforderlich ist.
Der Indikator verfügt über „Mark“-Funktionen, mit denen Bereiche mit ein
FREE

Harmonische Muster eignen sich am besten, um Marktumkehrpunkte vorherzusagen. Sie bieten eine hohe Erfolgsquote und zahlreiche Handelsmöglichkeiten innerhalb eines Handelstages. Unser Indikator identifiziert die beliebtesten harmonischen Muster basierend auf den Prinzipien in der Literatur zum harmonischen Handel. WICHTIGE ANMERKUNGEN: Der Indikator malt nicht um, hängt nicht hinterher (er erkennt ein Muster am Punkt D) und zeichnet nicht neu (das Muster ist entweder gültig oder abgebrochen). VE
FREE

LordAutoTrendLine ist ein Indikator für MetaTrader, der mit der Absicht entwickelt wurde, Auf- und Abwärtstrendlinien auf dem Finanzmarkt zu analysieren.
Trendlinien werden verwendet, um zusammen mit einem Fibonnaci beispielsweise das Hoch und Tief eines Währungspaares zu berechnen.
Im Beispiel der H4-Bilder sehen wir eine Linie, die das Hoch von 1790 und das Tief von 1784 kreuzt. Ein Beispiel: Wenn ein Unterschreiten von 1784 einen Verkauf bedeutet, kann es der Linie zufolge mit großer Sic

All Indicator extras and template: https://abiroid.com/extras/best-heiken-ashi-vqzz-system-extras
The Best Heiken Ashi System is a simple trading system for trading based only two indicators for generate signals: Heiken ashi smoothed and Vqzz indicator multi-timeframe. The system was created for scalping and day trading but can also be configured for higher time frames. As mentioned, the trading system is simple, you get into position when the two indicators agree. Get Scanner dashboard her
FREE

Ein vorgefertigtes Handelssystem, das auf der automatischen Konstruktion und Wartung von Fibonacci-Levels für den Verkauf und Kauf auf jedem Instrument (Symbol) und auf jeder beliebigen Periode des Charts basiert. Bestimmung der Richtung des Trends (14 Indikatoren). Konstruktion von horizontalen Ebenen, Unterstützungs- und Widerstandslinien, Kanälen. Auswahl einer Variante zur Berechnung von Fibonacci-Stufen (6 verschiedene Methoden). Benachrichtigungssystem (auf dem Bildschirm, E-Mail, Push-Ben

All Symbols AND All Time frames Scan
Document Introduction
The ABCD is a basic harmonic pattern. The ABCD pattern is a visual, geometric chart pattern comprised of three consecutive price swings. It looks like a diagonal lightning bolt and can indicate an upcoming trading opp

indicators to facilitate analysis based on Oma Ally's BBMA strategy by displaying CSAK (CSD), CSM and Extreme labels on the chart 1. Displays the Bollinger Band line 2. LWMA 5-10 High and Low 3. EMA 50 4. Fibonacci 5. MHV . area 6. Alert & Show labels BBMA consists of the use of 2 indicators: Moving Averages Bollinger Bands BBMA consists of 3 types of entries: Extreme MHV Re-Entry Moving Average Settings: There are 5 MAs used in the system: 2 High Moving Averages, 2 Low Moving Averages and
FREE

Free automatic Fibonacci is an indicator that automatically plots a Fibonacci retracement based on the number of bars you select on the BarsToScan setting in the indicator. The Fibonacci is automatically updated in real time as new highest and lowest values appears amongst the selected bars. You can select which level values to be displayed in the indicator settings. You can also select the color of the levels thus enabling the trader to be able to attach the indicator several times with differe
FREE

Der Indikator synchronisiert acht Arten von Markierungen auf mehreren Charts eines Handelsinstruments.
Dieser Indikator kann bequem in Verbindung mit "Multichart Dashboard" oder einem ähnlichen Assistenten verwendet werden, mit dem Sie gleichzeitig mit mehreren Charts arbeiten können.
"Multichart Dashboard" finden Sie unter dem Link auf meinem Youtube-Kanal.
Die Einstellungen:
Aktivieren die vertikale Liniensynchronisation
Aktivieren die horizontale Liniensynchronisation
Aktivieren die T
FREE

Support and Resistance zones indicator for MT4 is a multi-timeframe panel and alert that finds support and resistance zones and pivot points for all timeframes of MetaTrader 4 and gives alert when price has interaction with them. Download demo version (works on GBPUSD, EURJPY and NZDUSD symbols) Read the full description of scanner parameters in the blog page . Many unique features in one indicator:
Integrating support and resistance zones and pivot points in one indicator with powerful filte
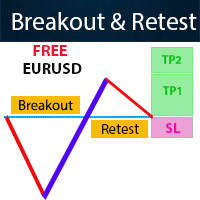
It is free on EURUSD chart.
Contact me for any questions All Symbols version! Introduction The breakout and retest strategy is traded support and resistance levels. it involves price breaking through a previous level. The break and retest strategy is designed to help traders do two main things, the first is to avoid false breakouts. Many false breakouts start with a candlestick that breaks out of a level but ends with an immediate candlestick that brings the price back into the level. Th
FREE
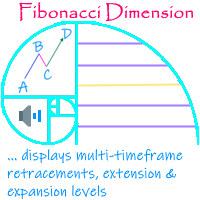
'Fibonacci Dimension' indicator allows display of preset or user-defined multi-timeframe Fibonacci levels. It automatically takes the previous high and low for two user-defined timeframes and calculates their Fibonacci retracement levels. It also considers the retraced level to draw the expansions on every change of price. A complete visual dimension in multiple timeframes allows deriving profitable strategies for execution. The functionalities included are: Provides an option to consider a pres
FREE

This indicator finds Three Drives patterns. The Three Drives pattern is a 6-point reversal pattern characterised by a series of higher highs or lower lows that complete at a 127% or 161.8% Fibonacci extension. It signals that the market is exhausted and a reversal can happen. [ Installation Guide | Update Guide | Troubleshooting | FAQ | All Products ] Customizable pattern sizes
Customizable colors and sizes
Customizable breakout periods Customizable 1-2-3 and 0-A-B ratios
It implements visua
FREE

Introduction Excessive Momentum Indicator is the momentum indicator to measure the excessive momentum directly from raw price series. Hence, this is an extended price action and pattern trading. Excessive Momentum Indicator was originally developed by Young Ho Seo. This indicator demonstrates the concept of Equilibrium Fractal Wave and Practical Application at the same time. Excessive Momentum detects the market anomaly. Excessive momentum will give us a lot of clue about potential reversal and

Fibonacci Sniper MT4 - No Repaint
Features:
- Indicator sends signals and notifications on key Fibonacci Retracement and Fibonacci Extensions Levels
- Once the buy/sell signal is set, targets ( TP1 TP2 TP3 )and stop loss levels are drawn by the indicator.
- Fibonacci Calculations and Custom Patterns are identified by the last 3 or 5 Zig Zag exterum.
- You can easily identify key harmonic patterns like Gartley, Bat, Butterfly and Crab patterns.
Important Settings: - Choose the Zig

- Real price is 90$ - 50% Discount ( It is 45$ now )
Contact me for instruction, any questions! Introduction V Bottoms and Tops are popular chart patterns among traders due to their potential for identifying trend reversals. These patterns are characterized by sharp and sudden price movements, creating a V-shaped or inverted V-shaped formation on the chart . By recognizing these patterns, traders can anticipate potential shifts in market direction and position themselves according

Provides instant signals on the chart in panel form. Equipped with signal description and trading analysis tools such as drawing auto trendlines, support/resistance area, regression channel, Fibonacci levels, Pivot levels and current signal price, signal time, signal expiry and stoploss recommendation. Also sending alert messages to all available mt4 alert tool. A detailed description panel provides information about where the signal comes from and what indicators are behind the signal. Includin

Are you tired of plotting fibonacci retracements or extensions manually? This indicator displays fibonacci retracements or extensions automatically, calculated from two different price points, without human intervention or manual object anchoring. [ Installation Guide | Update Guide | Troubleshooting | FAQ | All Products ] Easy to use Manual anchoring is not needed Perfect for price confluence studies The indicator evaluates if retracements or extensions are needed Once drawn, you can manually
FREE

Contact me after payment to send you the User-Manual PDF File. Harmonic Trading The secret is the Fibonacci. It has been proven in the markets that price always reacts to Fibonacci levels. Fibonacci levels are one of the most important indicators of price changes. Sometimes the sequence of reactions to these levels in the chart make geometric shapes, which are called harmonic patterns. The price creates harmonic patterns with its fluctuation and reaction to Fibonacci levels. Harmonic patterns c

"TPA Sessions" indicator is a very important tool to complement "TPA True Price Action" indicator . Did you ever wonder, why many times the price on your chart suddently turns on a position you can`t explain? A position, where apparently no support or resistance level, or a pivot point, or a fibonacci level is to identify? Attention!!! The first run of the TPA Session indicator must be in the open market for the lines to be drawn correctly.
Please visit our blog to study actual trades with

ZigZag Fibo Retracement Indicator Optimize Your Trading Strategy! Are you seeking to optimize your trading strategy in the financial markets? Explore the unique features of the ZigZag Fibo Retracement Indicator, a powerful tool designed to help you identify potential support and resistance levels based on the combination of ZigZag patterns and Fibonacci ratios. Integration of ZigZag Patterns and Fibonacci: The ZigZag Fibo Retracement Indicator combines the effectiveness of ZigZag patterns, helpi
FREE

It is a custom non-repaint indicator to identify trade opportunities in swing action as prices move within an upper and lower band. Inspired by the Keltner Channel, the most popular channel Indicator introduced by Chester Keltner. It is different with a Bollinger Bands. It represents volatility using the high and low prices, while Bollinger's studies rely on the standard deviation. The algorithm for this indicator is also available in the EntryMaximator EA. Including the option to use it or not.
FREE

Introducing the Super Pivot and Fibo Indicator: Your Ultimate Trading Companion Are you ready to take your trading to the next level? The Super Pivot and Fibo Indicator is here to revolutionize your trading strategy. This powerful tool combines key elements such as pivot points, Fibonacci retracement and extension levels, high-low values, and Camarilla points to provide you with a comprehensive and accurate analysis of the market. Key Features: Pivot Points: Our indicator calculates daily, weekl
FREE

Die Ebenen des zentralen Pivot-Bereichs werden um einen zentralen Pivot-Punkt herum gebildet.
Diese Niveaus in Bezug auf den zentralen Pivot können verwendet werden, um zahlreiche Marktverhalten und mögliche Ergebnisse zu bestimmen.
Die Entfernung vom zentralen Pivot und der Preis, den sich neue Niveaus im Verhältnis zu den Niveaus des Vortages bilden, können verwendet werden, um die Trendrichtung und -stärke der folgenden Tage zu bestimmen.
Central Pivot Ranges können als Unterstützung u
FREE

MT5-Version Fibonacci-Bollinger-Bänder MT4 Fibonacci Bollinger Bands ist ein hochgradig anpassbarer Indikator, der Unterstützungs- und Widerstandsbereiche anzeigt. Dieser Indikator kombiniert die Logik für die Bollinger-Bänder mit dem Fibonacci-Level. Fibonacci-Bollinger-Bänder sind der Erste Indikator auf dem Markt, der es dem Benutzer ermöglicht, bis zu 12 Fibonacci-Levels, den Typ des gleitenden Durchschnitts und die für die Berechnungen zu verwendende Preisdatenquelle zu 100% anzupasse
FREE

The most Flexible & Reliable Trend-Based Fibonacci indicator by Safe Trading. This indicator helps you calculate Trend-Based Fibonacci levels base on the main and retracement trends to predict future price . If you just looking for a simple Fibonacci Retracement indicator, please use this Free indicator .
### FEATURES ### Auto-calculate up to 7 Trend-Based Fibonacci levels on adjustable frame. Adjust Fibonacci levels as your need. Adjust the start and the end of calculated frame in indicato
FREE

The indicator displays overbought and oversold levels, calculating them using the Fibonacci golden ratio formula.
It enables both trend-following and counter-trend trading, accommodating breakouts and rebounds from these levels.
It operates on all timeframes, across various currency pairs, metals, and cryptocurrencies.
Suitable for binary options trading.
Key Features: Based on the Fibonacci golden ratio Shows overbought and oversold levels Suitable for market and pending orders Sim
FREE

Introduction RSI divergence is a main technique used to determine trend reversing when it’s time to sell or buy because prices are likely to drop or pick in the charts. The RSI Divergence indicator can help you locate the top and bottom of the market. This indicator finds Regular divergence for pullback the market and also finds hidden RSI Divergence to show continuing trend. This indicator shows divergence on the RSI that is a strong hint for an excellent entry point and finds immediately with
FREE

Monster Harmonics Indicator is a harmonic pattern indicator. It recognizes Gartley, Bat, Crab, Butterfly, Cypher, White Swan, Black Swan, Shark and several other patterns. Projected patterns that are not yet completed are recognized, too. Monster even shows the PRZ (Potential Reversal Zone). Users can add their own user defined patterns to Monster. Besides the current pattern, Monster also shows all patterns in the symbols history. Monster will provide alerts for developing patterns. Introduced

The OHLC indicator shows the current and historical values of High, Low, Open, Close and Mid for a specific time period. It can plot the current values or the values from the previous session. The indicator's range can be calculated from a daily, weekly, monthly, or user-specified session.
Levels High of the current or previous session. Low of the current or previous session. Open of current or previous session. Close of the current or previous session. Midpoint of the current or pre
FREE

Pivot Classic, Woodie, Camarilla, Fibonacci and Demark
Floor/Classic Pivot-Punkte oder einfach Pivots sind nützlich, um potenzielle Unterstützungs-/Widerstandsniveaus, Handelsspannen, Trendumkehrungen und die Marktstimmung zu identifizieren, indem sie die Höchst-, Tiefst- und Schlusswerte eines Vermögenswerts untersuchen. Die Floor/Classic Pivot Points können wie folgt berechnet werden. Pivot Point (P) = (High + Low + Close)/3 S1 = P * 2 - High S2 = P - (High - Low) S3 = Low – 2*(High - P) R1
FREE

Discover the power of precision and efficiency in your trading with the " Super Auto Fibonacci " MT4 indicator. This cutting-edge tool is meticulously designed to enhance your technical analysis, providing you with invaluable insights to make informed trading decisions. Key Features: Automated Fibonacci Analysis: Say goodbye to the hassle of manual Fibonacci retracement and extension drawing. "Super Auto Fibonacci" instantly identifies and plots Fibonacci levels on your MT4 chart, saving you tim
FREE

Informative & optimized Zigzag, Accumulated volume, Price change A rewrite of the traditional zigzag tool with new additions. Features:- Optimized code Displays accumulated volume between peaks Displays price change between peaks Usage:- Identify trend swings Identify high volume swings Compare price changes between swings Drawing Fibonacci tool on strong price change or high volume swings
FREE

Automatically scans the chart to find Harmonic Patterns, and give you the chance to enter early in good operations. Also if selected, it will alert you in advance when future patterns appears, showing you a projection of a posible future pattern. The main goal for this algorithm is to determine with high precision the moment when a trend ends and a new one begins. Giving you the best price within a reversal. We have added the "Golden Trade", we define it as the perfect order: For those orde

A forex pivot point strategy could very well be a trader’s best friend as far as identifying levels to develop a bias, place stops and identify potential profit targets for a trade. Pivot points have been a go-to for traders for decades. The basis of pivot points is such that price will often move relative to a previous limit, and unless an outside force causes the price to do so, price should stop near a prior extreme. Pivot point trading strategies vary which makes it a versatile tool for
FREE

This Indicator was used on EA Advanced Fibo levels . Indicator is designed to trade for most popular Fibonacci strategy that's completely automated. It automatically identifies and show Entry levels included Support/ Resistance Zones , according to the time zone candle by Fibonacci levels. As well as the traditional Fibonacci tool also included. However, it is very user friendly rather than default available one. On the other hand one more tool included. It automatically identifies real Suppo
FREE

This indicator will detect harmonic patterns that are drawn on the chart by manual and automatic methods. You can see user manual from this link: https://www.mql5.com/en/blogs/post/719257 There is a free version (it detect only Gartley and Nenstar Patterns) to try this product. You can buy the full MT4 version from: https://www.mql5.com/en/market/product/104689
Notes When you use this indicator and change the settings, add indicators like Moving Average or Bollinger Bands, this indicator will
FREE

Daily pivot are relatively important in trading. This indicator have options to select 5 commonly use pivot point calculations. User input Choose Pivot Point Calculation ( Method Classic, Method Camarilla, Method TomDeMark, Method Fibonacci or Method Woodies. ) Choose Applied Timeframe for the calculation (M5, M15, H1, H4, D1, W1 etc) Can be attached to any timeframe Choose color of Pivot point For MT5 version, please refer here: https://www.mql5.com/en/market/product/38816
FREE

The Pivot Indicator is a vital tool for technical analysis used by traders in the financial markets. Designed to assist in identifying potential reversal points or trend changes, this indicator provides valuable insights into key levels in the market. Key features of the Pivot Indicator include: Automatic Calculations: The Pivot Indicator automatically calculates Pivot Point, Support, and Resistance levels based on the previous period's high, low, and close prices. This eliminates the complexity
FREE

Das 123-Muster ist eines der beliebtesten, leistungsstärksten und flexibelsten Diagrammmuster. Das Muster besteht aus drei Preispunkten: einem Boden, einem Gipfel oder Tal und einem Fibonacci-Retracement zwischen 38,2% und 71,8%. Ein Muster gilt als gültig, wenn der Preis jenseits des letzten Gipfels oder Tals abbricht, in dem der Indikator einen Pfeil zeichnet, einen Alarm auslöst und der Handel platziert werden kann. [ Installationsanleitung | Update-Anleitung | Fehlerbehebung | FAQ | Alle Pr

You can find full version here: Harmonic Pattern Scanner MT4 Harmonic Pattern Scanner MT5 Introduction Harmonic Patterns are best used to predict turning point. Harmonic Patterns give you high win rate and high opportunities for trade in during one day. This indicator detects the best and successful patterns base on Harmonic Trading books by Mr. Scott M.. Main Features Detect the best and most successful patterns : Gartley, Bat, Crab, Butterfly, Cypher, Shark, Alt_Bat, Deep_Crab Easy-
FREE

Draw and Sync Objects Multiple Charts 1. Draw objects by key press. ( You must: 1. Press Function key => 2. Click where you want to draw => 3. Draw it => 4. Press ESC to complete). (If you don't want to draw after pressing function key, you must press ESC to cancel). 2. Developing : Sync selected objects to multiple charts by button. 3. Developing: Hide objects that do not belong to the current symbol (Objects drawn with this indicator will belong to the symbol they are plotted
FREE

MACD Intraday Trend PRO ist ein Indikator, der durch eine Adaption des ursprünglichen MACD von Gerald Appel in den 1960er Jahren entwickelt wurde.
Im Laufe der Jahre des Handels wurde beobachtet, dass wir durch die Änderung der Parameter des MACD mit Fibonacci-Proportionen eine bessere Darstellung der Kontinuität der Trendbewegungen erreichen, wodurch es möglich ist, den Beginn und das Ende eines Preistrends effizienter zu erkennen.
Aufgrund seiner Effizienz bei der Erkennung von Kurstrends

Der Indikator analysiert die angegebene Anzahl von Kerzen und zeichnet Fibonacci-Niveaus basierend auf dem Hoch-Tief. Da sich die Ebenen neu anordnen, interessieren wir uns für die rechte Seite des Bereichs. Der Preis magnetisiert die Niveaus und reagiert auf die Berührung. Verwenden Sie dieses Tool, um nach einer Korrektur einen Trendeintrittspunkt zu finden. Wenn wir links sehen, dass die Pegel perfekt angestiegen sind, können wir davon ausgehen, dass wir das Ende der Bewegung am Extrempunkt g
FREE

FZR indicator determines fractal zigzag reversal pattern of all the time frames of the chosen symbol and shows the information in the Info label. Indicator draws the detected pattern in the chosen time frame and also you can select in the menu to draw the trend line according to FZR peaks. What it is FZR? See the first picture in the screenshots. As you can see for every peak of FZR the AO indicator must cross zero line. FZR indicator determines the trend direction.
How to use FZR for trading?
FREE

M1Arrows is a MT4 trend arrows Indicator
* Smart Scalper Setup (M1) :: Signal 5 Main 20 + Signal 20 Main 80 + Fibonacci ZigArcs 20
(Screenshot1) Add the indicator with first setting,
then add it again to the same graph with other settings.
You can add as many as you want, but 2 M1Arrows in just one graph is enought
Never open orders againt the slow setting trend
Do not open more than 3 orders per slow setting trend
It will work better in Europe/USA markets, * M15 Day Trade Setup: Sig
FREE

The ZUP is based on two ideas. Idea 1 - combine a variety of methods for identifying extremums (minimums and maximums) on the market price charts in a single indicator. Idea 2 - make it possible to easily bind various graphical tools, which allow to analyze the market behavior, to the identified extremums. To implement the first idea , the following has been made in the indicator. Included multiple ZigZag algorithms. Standard ZIGZAG algorithm. The basis of this algorithm is taken from the ZigZag

The Pivot Point indicator automatically calculates and displays the pivot point line and support and resistance levels. Pivot can be calculated according to the Classic, Floor, Fibonacci, Woodie, Camarilla or DeMark formula. It is also possible to select the period for calculating the indicator. A trader can choose from daily, weekly, monthly, or user-defined periods.
Types of pivots Classic Floor Fibonacci Woodie Camarilla DeMark
Main features The indicator shows the current and histor
FREE

It is an indicator that analyzes the high and low prices in real time by Dow theory, draws a trend line, and draws the predicted arrival point in the Box format after breaking the low price and the high return price. The high and low prices are determined by the nBars parameter (initial value = 5), but displaying the corresponding moving averages (SMA and EMA 4 to 5 times nBars) at the same time makes it easier to understand the trend change. (D ownload the demo version of the free GreenBox and

Pattern Trader No Repaint Indicator
MT5 Version of the indicator: https://www.mql5.com/en/market/product/57462 Advanced Chart Patterns Tracker MT4: https://www.mql5.com/en/market/product/68550
I ndicator searches for 123 Pattern, 1234 Pattern, Double Top, Double Bottom Patterns , Head and Shoulders, Inverse Head and Shoulders and ZigZag 1.618 Pattern.
Pattern Trader indicator uses Zig Zag Indicator and Improved Fractals to determine the patterns. Targets and Stop Loss Levels are defined

Mean Reversion Supply Demand Indicator Mean Reversion Supply Demand is the indicator to detect the important supply demand zone in your chart. The concept of supply demand trading relies on the quantity mismatching between buying and selling volumes in the financial market. Typically, supply demand zone serves to predict the turning point. The wave pattern, for any supply demand zone to work as an successful trade, looks like the price must touch the base zone, move away and then return to zone

This SuperZig indicator is special design for some trader trade with ZigZag and Fibonacci . ( !!! NEW !!! +++ Support and Resistance +++ ) It will draw least two Fibonacci automatically in your chart period. Alerts when Created/Touced the Support/Resistance Box, it will send phone push/email notification to you at the same time.
ZigZag + Fibo + BreakOutLine + SupportResistance = SuperZig !!!
Input Parameter:
" Show ZigZag " :: Show ZigZag indicator with your own style ; " Show BreakOut

Fibonacci SR Indicator
This indicator creates support and resistance lines. This indicator is based on Fibonacci Retracement and Extension levels. It will consider many combinations of the Fibonacci levels and draw support/resistance lines based on these. This indicator uses tops and bottoms drawn by the ZigZag indicator in its calculations. The ZigZag can also be drawn on the chart, if necessary. The indicator considers many combinations of past reversal points and Fibonacci ratio levels, and
FREE
Thomas DeMark Relative Retracement uses an objective and consistent approach to Fibonacci Trading by establishing a minimum of three reference points which may provide support or resistance in the market. A great tool for anticipating continued price trends and/or price exhaustions!
Bullish levels are calculated once a potential price low has occurred. This low is compared to previous price action to locate an earlier price low which is equal or lower than the current low. The intervening high
FREE

Pivot-Ebenen sind eine etablierte technische Ebene, die in jedem Markt anerkannt ist. Dieser Indikator zeichnet die aktuellen vierteljährlichen, monatlichen, wöchentlichen, täglichen und vierstündlichen Pivots für jedes Symbol auf dem Chart. Sie können auch die Unterstützungs- und Widerstandsstufen für jeden Zeitraum anzeigen und auswählen, welche von Stufen 1 bis 4 angezeigt werden sollen. Wählen Sie den Pivot-Typ aus: Standard Camarilla DeMark Woodie Fibonacci Bitte beachten Sie, dass DeMa

The indicator shows the Fibonaccia golden ratio levels and the price balance line Has three different sensitivity options Allows you to visually navigate what state the market is in and where trend reversals are possible Works on all timeframes, on any currency pairs, metals and cryptocurrencies Can be used when working with binary options Distinctive features Based on the golden Fibonacci value; Determines the balance line of price equilibrium Has three different sensitivity settings; Simple an
FREE

Wir stellen Ihnen Ms. Fibonacci vor, einen leistungsstarken und kostenlosen Indikator, der das Zeichnen und Anpassen von Fibonacci-Levels in Ihrem Diagramm vereinfacht. Dieser Indikator identifiziert und markiert automatisch die neuen höchsten und niedrigsten Fibonacci-Werte und gewährleistet so eine genaue und präzise Platzierung. Eines der Hauptmerkmale von Ms. Fibonacci ist seine Fähigkeit, Fibonacci-Ebenen Punkt für Punkt korrekt zu zeichnen und die entsprechenden Preisniveaus zu markier
FREE

14 Indicators and auxiliary tools for convenient trading This utility contains 14 additional tools that can be useful for certain actions of the trader, thereby simplifying and speeding up the trading process. My #1 Utility : includes 65+ functions | Contact me if you have any questions Due to the different monitor resolutions, some users may encounter the fact that the labels will be displayed with an overlay or be too small. If you encounter such a problem, you can adjust the font size

Scanning Multi Symbols Scalping Signals based on 3 kinds of Market Analysis methods. Trend, Signal, and Reversator. And each method consists of its own multi timeframes algorithm functions. Summarized to become clear signals direction BUY/SELL, including the signals strength scoring and sending message to all available alert tools. Displayed on a User Friendly and customizable Dashboard. Size, colors, coordinates, highlight, hidden/show and more. Base Timeframe: M15. And M5 to Daily to confirm

An indicator from the zigzag family with levels. First of all, I will point out arguments in favor of the advisability of using a level indicator. They give the trader the following benefits:
Alternative points of view - the level indicator helps to look at the levels from the side, compare them with several automatic systems, identify errors;
Saving time - reducing the cost of effort for self-building lines;
Exact mathematical calculation - quick calculation of levels, ratios of indicato
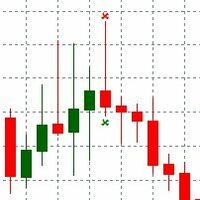
PinBar indicator is an Indicator identifies price reversal, pattern and timely identifies that price trend is changed. The Trend change is immediately identified over the chart. Alert is send over the Chart and Email address. Indicator generated Signal Price is displayed over the chart near the PinBar. Please make sure to use on Higher time frames if you are swing trader. for day traders who want to use M30 or M15 time frames, Take profit should be kept minimal. Lower than M15 is not recommende
FREE

The VWAP indicator is our version of the popular Volume-Weighted Average Price indicator. The VWAP is the ratio between the value traded (price multiplied by the number of volume traded) and the total volume traded over a specific time period. As a result, it measures the average price of the instrument much better than the simple moving average. Although there are many ways to use the VWAP, most investors use it to calculate the daily average.
The indicator works in five modes: Moving

Fibonacci retracement is really one of the most reliable technical analysis tools used by traders. The main problem with using these levels in trading is that you need to wait until the end of the impulse movement to calculate the retracement levels, making difficult to take a position for limited retracement (0.236 or 0.382). Fibo Dynamic solves this problem. Once the impulse movement is identified the retracement levels are automatically updated allowing very dynamic trading in trends with onl
FREE

Basic Fibonacci Calculation Indicator
shows Trend, Stoploss, Profit 1,2,3, will show you your daily Highs and your Daily Lows , it will also show you where it expects the price to move to. best time frame is H1 or higher .
For a better system that also includes my Non-repaint Indicator please check out my paid Fibo Indicator https://www.mql5.com/en/market/product/82323
FREE

The indicator shows the regression channel, in the calculation of which the gold Fibonacci section is used Levels are not built as graphical objects, but use indicator buffers - this allows using this indicator in Expert Advisors Near the channel borders price corrections and reversals are most probable Allows trend and counter trend trading within the channel The slope of the channel shows the direction of the market, and its width - the current volatility. Works on all timeframes, all currency
FREE
MetaTrader Market - Handelsroboter und technische Indikatoren stehen Ihnen direkt im Kundenterminal zur Verfügung.
Das MQL5.community Zahlungssystem wurde für die Services der MetaTrader Plattform entwickelt und steht allen registrierten Nutzern der MQL5.com Webseite zur Verfügung. Man kann Geldmittel durch WebMoney, PayPal und Bankkarten einzahlen und sich auszahlen lassen.
Sie verpassen Handelsmöglichkeiten:
- Freie Handelsapplikationen
- Über 8.000 Signale zum Kopieren
- Wirtschaftsnachrichten für die Lage an den Finanzmärkte
Registrierung
Einloggen
Wenn Sie kein Benutzerkonto haben, registrieren Sie sich
Erlauben Sie die Verwendung von Cookies, um sich auf der Website MQL5.com anzumelden.
Bitte aktivieren Sie die notwendige Einstellung in Ihrem Browser, da Sie sich sonst nicht einloggen können.