Diskussion zum Artikel "Analyse von Kurs-Zeit-Lücken in MQL5 (Teil II): Erstellung einer Heatmap der Liquiditätsverteilung über die Zeit"
Das hat mich daran erinnert: Vor langer, langer Zeit habe ich so etwas schon einmal gemacht,
meiner Meinung nach ist es bei Ihnen noch ganz leicht unvollständig – es bleibt noch, die regelmäßige Struktur aufzudecken (oder zu zeigen, dass es keine gibt).
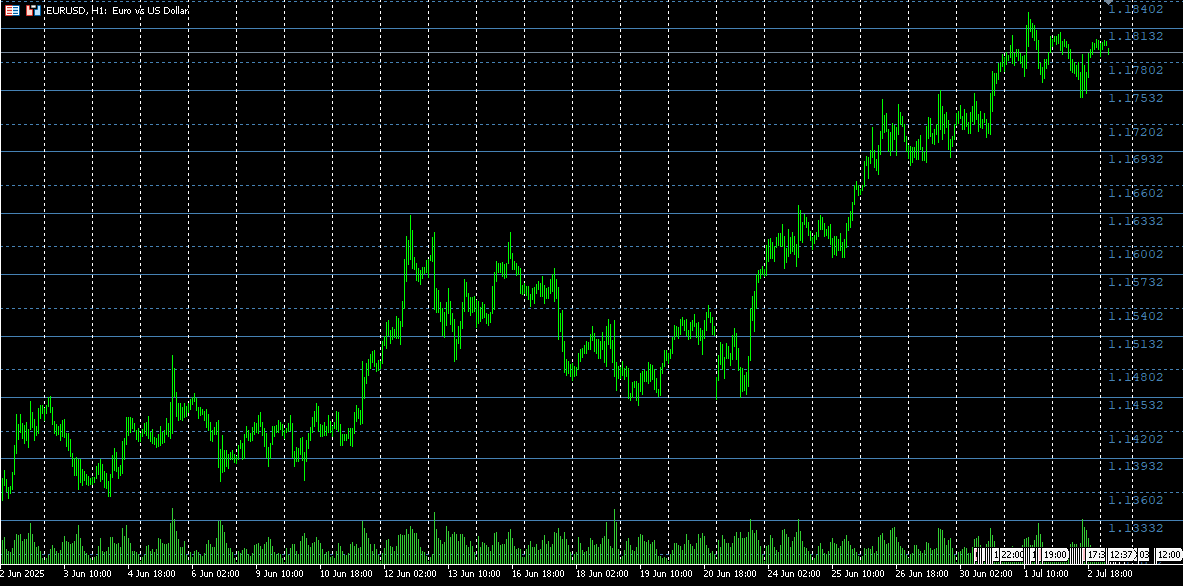
Das ist natürlich keine Heatmap – es werden lediglich die Extremwerte des regelmäßigen Teils einer solchen Temperaturkarte dargestellt.
Übrigens wurde die Karte mit einer Methode berechnet, die als äußerst aufwendig und fehleranfällig gilt.
Es geht auch einfacher: Für jede Kerze werden zwei Paare {price, weight} in die Sammlung aufgenommen: { price=high, weight=-1; } { price=low, weight=+1; }. Die Sammlung wird nach „price“ sortiert, und die kumulierte Summe nach „weight“ ergibt die Heatmap. Anschließend wird nach Belieben quantisiert.
//+------------------------------------------------------------------+
//|             Heat Map Plus – modifizierte Version 3.00                     |
//|   Behält Puffer/Warnmeldungen bei und fügt ADX, Statistiken und Rangliste hinzu     |
//+------------------------------------------------------------------+
#property copyright "Chart Coloring by Time and Volume Distribution"
#property link      "https://www.mql5.com"
#property version   "3.00"
#property indicator_chart_window
#property strict

#include <Math\Stat\Math.mqh>    // MathMean, MathStdDev
#include <Indicators\Trend.mqh>     // ADX zum Erkennen von Trends

// Puffer für EA
#property indicator_buffers 3
#property indicator_plots   0
double LevelPriceBuffer[];
double LevelStrengthBuffer[];
double LevelTypeBuffer[];

//--- Eingabeparameter
sinput group "=== Heat Map Settings ==="
input int      AnalysisPeriod   = 500;
input int      MaxHistory       = 10000;
input double   TickSize         = 0;
input bool     UseTickVolume    = true;
input double   VolumeWeight     = 0.5;
input int      SessStartHour    = 8;
input int      SessEndHour      = 17;
input double   MinBarRange      = 10;
input bool     EnableAlerts     = true;

//+------------------------------------------------------------------+
//|                                                                  |
//+------------------------------------------------------------------+
sinput group "=== Farben (1 % → 100 %) ==="
input color    Color1Percent    = clrRed;
input color    Color25Percent   = clrOrange;
input color    Color50Percent   = clrYellow;
input color    Color75Percent   = clrAqua;
input color    Color100Percent  = clrBlue;
input int      Transparency     = 70;

//--- Globale Variablen
struct PriceLevel {
 double price, price_high, price_low;
 long   time_spent;
 long   volume;
 double presence_percent;
 color  level_color;
 string object_name; };
PriceLevel      levels[];
datetime        startTime, endTime, lastUpdate;
int             totalPriceLevels = 0;
long            maxTimeSpent = 0, minTimeSpent = LONG_MAX;
long            maxVolume = 0,    minVolume    = LONG_MAX;
bool            calculated = false;

//--- ADX-Handle
CiADX   adx;

//+------------------------------------------------------------------+
//| Initialisierung                                                  |
//+------------------------------------------------------------------+
int OnInit() {
// Puffer für EA
 SetIndexBuffer(0, LevelPriceBuffer);
 SetIndexBuffer(1, LevelStrengthBuffer);
 SetIndexBuffer(2, LevelTypeBuffer);
 if(AnalysisPeriod < 50 || MaxHistory < AnalysisPeriod) {
  Print(„Falsche Parameter: 50 <= AnalysisPeriod <= MaxHistory“);
  return(INIT_PARAMETERS_INCORRECT); }
 if(VolumeWeight < 0 || VolumeWeight > 1) {
  Print("VolumeWeight deve estar em [0,1]");
  return(INIT_PARAMETERS_INCORRECT); }
// ADX(14)
 if(!adx.Create(_Symbol, _Period, 14)) {
  Print("Erro ao criar ADX");
  return(INIT_FAILED); }
 ArrayResize(levels, 0);
 lastUpdate = 0;
 calculated = false;
 totalPriceLevels = 0;
 return(INIT_SUCCEEDED); }

//+------------------------------------------------------------------+
//| Berechnung                                                     |
//+------------------------------------------------------------------+
int OnCalculate(const int rates_total,
                const int prev_calculated,
                const datetime &time[],
                const double &/*open*/[],
                const double &high[],
                const double &low[],
                const double &/*close*/[],
                const long &tick_volume[],
                const long &volume[],
                const int &/*spread*/[]) {
 if(rates_total < AnalysisPeriod) return(0);
// wird erst bei einer neuen Kerze neu berechnet
 if(lastUpdate == time[rates_total - 1]) return(rates_total);
 lastUpdate = time[rates_total - 1];
 calculated = false;
 if(!calculated) {
  // ADX aktualisieren
  adx.Refresh(1);
  // Hauptberechnung
  CalculateTimeDistribution(time, high, low, tick_volume, volume, rates_total);
  ColorChart();
  ExportBuffers(rates_total);
  calculated = true; }
 return(rates_total); }

//+------------------------------------------------------------------+
//| Gleitendes Fenster + Sitzungs- und Volatilitätsfilter               |
//+------------------------------------------------------------------+
void CalculateTimeDistribution(const datetime &time[],
                               const double &high[],
                               const double &low[],
                               const long &tick_volume[],
                               const long &volume[],
                               int rates_total) {
 ArrayResize(levels, 0);
 int historyStart = MathMax(0, rates_total - MaxHistory);
 startTime = time[historyStart];
 endTime   = time[rates_total - 1];
// Preisklasse
 double maxP = high[ArrayMaximum(high, historyStart, MaxHistory)];
 double minP = low [ArrayMinimum(low,  historyStart, MaxHistory)];
 double priceRange = maxP - minP;
 if(priceRange <= 0) return;
// Tick-Größe
 double tk = (TickSize > 0 ? TickSize : Point());
 totalPriceLevels = (int)(priceRange / tk);
 totalPriceLevels = MathMin(1000, MathMax(50, totalPriceLevels));
 double realTick = priceRange / totalPriceLevels;
// Ebenen initialisieren
 ArrayResize(levels, totalPriceLevels);
 for(int i = 0; i < totalPriceLevels; i++) {
  levels[i].price       = minP + i * realTick;
  levels[i].price_high  = levels[i].price + realTick / 2;
  levels[i].price_low   = levels[i].price - realTick / 2;
  levels[i].time_spent  = 0;
  levels[i].volume      = 0;
  levels[i].object_name = "HeatLevel_" + IntegerToString(i); }
// durchläuft die Balken
 for(int bar = historyStart; bar < rates_total; bar++) {
  // Sitzungsfilter
  int hr = TimeHour(time[bar]);
  if(hr < SessStartHour || hr > SessEndHour) continue;
  // Volatilitätsfilter
  double amp = (high[bar] - low[bar]) / Point();
  if(amp < MinBarRange) continue;
  long barVol = UseTickVolume ? tick_volume[bar] : volume[bar];
  // Betroffene Ebenen ermitteln
  int st = MathMax(0, (int)((low[bar]  - minP) / realTick));
  int en = MathMin(totalPriceLevels - 1,
                   (int)((high[bar] - minP) / realTick));
  for(int li = st; li <= en; li++) {
   if(DoesBarTouchLevel(high[bar], low[bar], levels[li])) {
    levels[li].time_spent++;
    levels[li].volume    += barVol; } } }
// acha min/max
 maxTimeSpent = 0; minTimeSpent = LONG_MAX;
 maxVolume    = 0; minVolume    = LONG_MAX;
 for(int i = 0; i < totalPriceLevels; i++) {
  long t = levels[i].time_spent;
  long v = levels[i].volume;
  if(t > maxTimeSpent) maxTimeSpent = t;
  if(t > 0 && t < minTimeSpent) minTimeSpent = t;
  if(v > maxVolume)    maxVolume    = v;
  if(v > 0 && v < minVolume)    minVolume    = v; }
 if(minTimeSpent == LONG_MAX) minTimeSpent = 0;
 if(minVolume   == LONG_MAX) minVolume   = 0;
// Prozentangaben und Farben
 CalculatePercentsAndColors(); }

//+------------------------------------------------------------------+
//| Prozentsätze & Kerne                                                |
//+------------------------------------------------------------------+
void CalculatePercentsAndColors() {
 long tr = maxTimeSpent - minTimeSpent;  if(tr <= 0) tr = 1;
 long vr = maxVolume    - minVolume;     if(vr <= 0) vr = 1;
 for(int i = 0; i < totalPriceLevels; i++) {
  double tp = levels[i].time_spent > 0 ?
              ((levels[i].time_spent - minTimeSpent) / (double)tr) * 100.0 : 0;
  double vp = levels[i].volume > 0 ?
              ((levels[i].volume - minVolume) / (double)vr) * 100.0 : 0;
  double comb = (1.0 - VolumeWeight) * tp + VolumeWeight * vp;
  levels[i].presence_percent =
   MathMax(1.0, MathMin(100.0, comb));
  levels[i].level_color =
   GetPercentageColor(levels[i].presence_percent); } }

//+------------------------------------------------------------------+
//| Diagrammfärbung + Warnmeldungen                                         |
//+------------------------------------------------------------------+

//+------------------------------------------------------------------+
//|                                                                  |
//+------------------------------------------------------------------+
void ColorChart() {
 ClearPreviousObjects();
 datetime nowTime = TimeCurrent();
 double lastBid = SymbolInfoDouble(_Symbol, SYMBOL_BID);
// Array mit Zonennamen
 string zoneNames[5] = {"", „Reversão“, „Tendência“, „Lateralisierung“, "Barreira" };
// 1) Lagerbestand nach Typ und Durchschnittspreis
 int    types[]; ArrayResize(types, totalPriceLevels);
 double mids[];  ArrayResize(mids,  totalPriceLevels);
 for(int i = 0; i < totalPriceLevels; i++) {
  types[i] = (int)LevelTypeBuffer[ArraySize(LevelTypeBuffer) - 1 - i];
  if(types[i] < 1 || types[i] > 4)
   types[i] = 4;
  mids[i] = (levels[i].price_low + levels[i].price_high) / 2.0; }
// 2) Erzeugt Zonenobjekte (farbige Rechtecke)
 for(int i = 0; i < totalPriceLevels; i++) {
  string nm = levels[i].object_name;
  // Rechteck der Zone
  if(ObjectCreate(ChartID(), nm, OBJ_RECTANGLE, 0,
                  startTime, levels[i].price_low,
                  nowTime,   levels[i].price_high)) {
   ObjectSetInteger(ChartID(), nm, OBJPROP_COLOR, levels[i].level_color);
   ObjectSetInteger(ChartID(), nm, OBJPROP_BACK, true);
   ObjectSetInteger(ChartID(), nm, OBJPROP_FILL, true);
   ENUM_LINE_STYLE style = (Transparency > 50) ? STYLE_DOT : STYLE_SOLID;
   ObjectSetInteger(ChartID(), nm, OBJPROP_STYLE, style);
   ObjectSetInteger(ChartID(), nm, OBJPROP_WIDTH, 1); }
  // Warnmeldungen
  if(EnableAlerts) {
   static double lastPrice = 0;
   bool cross = ((lastPrice < levels[i].price && lastBid >= levels[i].price) ||
                 (lastPrice > levels[i].price && lastBid <= levels[i].price));
   if(cross) {
    Alert(„HeatMap: Der Kurs hat die Marke ‚‘ überschritten“,
          DoubleToString(levels[i].price, _Digits),
          " [", zoneNames[types[i]], "]"); }
   lastPrice = lastBid; } }
//// 3) Gruppiere nach zusammenhängenden Typen und zeichne eine Linie pro Gruppe
// struct Segment {
//  int type;
//  int start;
//  int end; };
// Segment segs[];
// ArrayResize(segs, 0);
// int currentType = types[0];
// int segStart = 0;
// for(int i = 1; i < totalPriceLevels; i++) {
//  if(types[i] != currentType) {
//   Segment seg;
//   seg.type  = currentType;
//   seg.start = segStart;
//   seg.end   = i - 1;
//   ArrayResize(segs, ArraySize(segs) + 1);
//   segs[ArraySize(segs) - 1] = seg;
//   currentType = types[i];
//   segStart    = i; } }
//// letztes Segment
// Segment lastSeg;
// lastSeg.type  = currentType;
// lastSeg.start = segStart;
// lastSeg.end   = totalPriceLevels - 1;
// ArrayResize(segs, ArraySize(segs) + 1);
// segs[ArraySize(segs) - 1] = lastSeg;
//// 4) Zeichne pro Segment eine mittlere horizontale Linie
// for(int j = 0; j < ArraySize(segs); j++) {
//  int s = segs[j].start;
//  int e = segs[j].end;
//  int type = segs[j].type;
//  // Median der Durchschnittspreise
//  double avgPrice = 0;
//  for(int k = s; k <= e; k++)
//   avgPrice += mids[k];
//  avgPrice /= (e - s + 1);
//// Horizontale Linie einfügen
//  string lineName = StringFormat(zoneNames[types[s]] + "linha", s, e);
//  if(ObjectCreate(ChartID(), lineName, OBJ_HLINE, 0, 0, avgPrice)) {
//   ObjectSetInteger(ChartID(), lineName, OBJPROP_COLOR, clrWhite);
//   ObjectSetInteger(ChartID(), lineName, OBJPROP_WIDTH, 4);
//   ObjectSetInteger(ChartID(), lineName, OBJPROP_STYLE, STYLE_SOLID);  }
//// Text rechts ausrichten (letzte sichtbare Kerze)
//  double textOffset = SymbolInfoDouble(_Symbol, SYMBOL_POINT) * 100; // vertikaler Versatz oberhalb der Zeile
//  double textPrice = avgPrice + textOffset;
//  datetime timeRight = iTime(_Symbol, _Period, 0);  // Zeitpunkt der letzten Kerze
//  string textName = StringFormat(zoneNames[types[s]] + "texto", s, e);
//  if(ObjectCreate(ChartID(), textName, OBJ_TEXT, 0, timeRight, textPrice)) {
//   ObjectSetInteger(ChartID(), textName, OBJPROP_COLOR, clrBlack);
//   ObjectSetInteger(ChartID(), textName, OBJPROP_FONTSIZE, 10);
//   ObjectSetInteger(ChartID(), textName, OBJPROP_CORNER, CORNER_RIGHT_LOWER); // optional, falls Sie die Angabe in Pixel wünschen
//   ObjectSetString(ChartID(), textName, OBJPROP_TEXT, zoneNames[types[s]]);
//   ObjectSetInteger(ChartID(), textName, OBJPROP_ANCHOR, ANCHOR_RIGHT);       // rechts vom Punkt verankern
//  } }
}
//+------------------------------------------------------------------+
//|                                                                  |
//+------------------------------------------------------------------+
int CountZLineObjects() {
 int total = ObjectsTotal(ChartID());
 int count = 0;
 for(int i = 0; i < total; i++) {
  string name = ObjectName(ChartID(), i);
  if(StringFind(name, "ZLine_") == 0) // Prüft, ob der Name mit „ZLine_“ beginnt
   count++; }
 return count; }
//+------------------------------------------------------------------+
//| Puffer für EA exportieren + Zoneneinteilung                 |
//+------------------------------------------------------------------+
void ExportBuffers(int rates_total) {
// Statistiken-Array zusammenstellen
 double stats[]; ArrayResize(stats, totalPriceLevels);
 for(int i = 0; i < totalPriceLevels; i++)
  stats[i] = levels[i].presence_percent;
 double mean = MathMean(stats);
 double sd   = MathStdDev(stats, mean);
 if(sd <= 0) sd = mean * 0.1;
 double adxValue = adx.Main(0);
 int cnt = MathMin(totalPriceLevels,
                   ArraySize(LevelPriceBuffer));
 for(int i = 0; i < cnt; i++) {
  // Art des Gebiets
  double p = levels[i].presence_percent;
  int ztype = 4; // BARREIRA als Standard
  if(p < mean - sd)                                 ztype = 1; // RÜCKGANG
  else if(p > mean + sd && adxValue >= 25.0)        ztype = 2; // TREND
  else if(adxValue < 20.0)                          ztype = 3; // LATERALISIERUNG
  LevelPriceBuffer   [rates_total - 1 - i] = levels[i].price;
  LevelStrengthBuffer[rates_total - 1 - i] = p;
  LevelTypeBuffer    [rates_total - 1 - i] = ztype; } }

//+------------------------------------------------------------------+
//| Hilfsfunktionen                                                         |
//+------------------------------------------------------------------+
bool DoesBarTouchLevel(double high, double low,
                       const PriceLevel &L) {
 return(high >= L.price_low && low <= L.price_high); }

//+------------------------------------------------------------------+
//|                                                                  |
//+------------------------------------------------------------------+
void ClearPreviousObjects() {
 int tot = ObjectsTotal(ChartID());
 for(int i = tot - 1; i >= 0; i--) {
  string nm = ObjectName(ChartID(), i);
  if(StringFind(nm, "HeatLevel_") == 0)
   ObjectDelete(ChartID(), nm); } }

//+------------------------------------------------------------------+
//|                                                                  |
//+------------------------------------------------------------------+
color GetPercentageColor(double p) {
 if(p <= 1.0)      return Color1Percent;
 else if(p <= 25.) return InterpolateColor(
                            Color1Percent,
                            Color25Percent,
                            (p - 1) / 24);
 else if(p <= 50.) return InterpolateColor(
                            Color25Percent,
                            Color50Percent,
                            (p - 25) / 25);
 else if(p <= 75.) return InterpolateColor(
                            Color50Percent,
                            Color75Percent,
                            (p - 50) / 25);
 else              return InterpolateColor(
                            Color75Percent,
                            Color100Percent,
                            (p - 75) / 25); }

//+------------------------------------------------------------------+
//|                                                                  |
//+------------------------------------------------------------------+
color InterpolateColor(color c1, color c2, double f) {
 int r1 = (c1 >> 16) & 0xFF, g1 = (c1 >> 8) & 0xFF,
     b1 = c1 & 0xFF;
 int r2 = (c2 >> 16) & 0xFF, g2 = (c2 >> 8) & 0xFF,
     b2 = c2 & 0xFF;
 int r = int(r1 + (r2 - r1) * f),
     g = int(g1 + (g2 - g1) * f),
     b = int(b1 + (b2 - b1) * f);
 return (r << 16) | (g << 8) | b; }

//+------------------------------------------------------------------+
//|                                                                  |
//+------------------------------------------------------------------+
int TimeHour(const datetime time) {
 MqlDateTime dt;
 TimeToStruct(time, dt);
 return dt.hour; }
//+------------------------------------------------------------------+
//+------------------------------------------------------------------+
//| DrawAndExport                                                    |
//+------------------------------------------------------------------+
//+------------------------------------------------------------------+
//| Berechnet den Mittelwert eines Arrays vom Typ „double“                            |
//+------------------------------------------------------------------+
double MathMean(const double &a[], const int count) {
 if(count <= 0) return 0.0;
 double sum = 0.0;
 for(int i = 0; i < count; i++)
  sum += a[i];
 return sum / count; }
//+------------------------------------------------------------------+
//| Berechnet die Stichprobenstandardabweichung eines Double-Arrays           |
//+------------------------------------------------------------------+
double MathStdDev(const double &a[], const int count) {
 if(count < 2) return 0.0;
 double mean = MathMean(a, count);
 double sumSq = 0.0;
 for(int i = 0; i < count; i++)
  sumSq += MathPow(a[i] - mean, 2);
 return MathSqrt(sumSq / (count - 1));  // Stichprobenstandardabweichung
}
//+------------------------------------------------------------------+

- 2025.07.15
- www.mql5.com

- Freie Handelsapplikationen
- Über 8.000 Signale zum Kopieren
- Wirtschaftsnachrichten für die Lage an den Finanzmärkte
Sie stimmen der Website-Richtlinie und den Nutzungsbedingungen zu.
Neuer Artikel Analyse von Kurs-Zeit-Lücken in MQL5 (Teil II): Erstellung einer Heatmap der Liquiditätsverteilung über die Zeit :
Im ersten Teil haben wir das Konzept der Zeitlücken und deren Verbindung mit institutionellen Handelsaktivitäten untersucht. Das Erkennen dieser Lücken ist jedoch nur ein Teil der Aufgabe. Um effektiv zu handeln, muss ein Trader das Gesamtbild sehen: wo der Kurs viel Zeit verbringt, wo er wenig Zeit verbringt und wie diese Zonen miteinander interagieren.
Hier kommt unser Indikator ins Spiel – ein Werkzeug, das unsichtbare Zeitmuster in eine visuelle Heatmap verwandelt. Während wir im ersten Teil nach Anomalien (Lücken) gesucht haben, konstruieren wir nun eine vollständige Heatmap des normalen Kursverhaltens.
Die Grundidee ist einfach: Der gesamte Kursbereich wird als Menge von Mikrozonen dargestellt, und für jede Zone wird berechnet, wie lange sich der Kurs darin aufgehalten hat. Je länger die Zeit, desto „heißer“ die Zone, desto wichtiger ist sie für den Markt. Das Ergebnis wird durch ein Farbschema von kühlem Rot bis heißem Blau visualisiert.
Autor: Yevgeniy Koshtenko