Nirundorn Promphao / 新闻源
- 信息
|
8+ 年
经验
|
80
产品
|
58
演示版
|
|
0
工作
|
0
信号
|
0
订阅者
|
Waiting to serve you all.
Mr.Nirundorn Promphao
CEO WOW DASH Trading System
Cheeky Monkey Trading System
Multi Gold and Boxing Trading System
WinWiFi Thailand
WinWiFi Robot Series
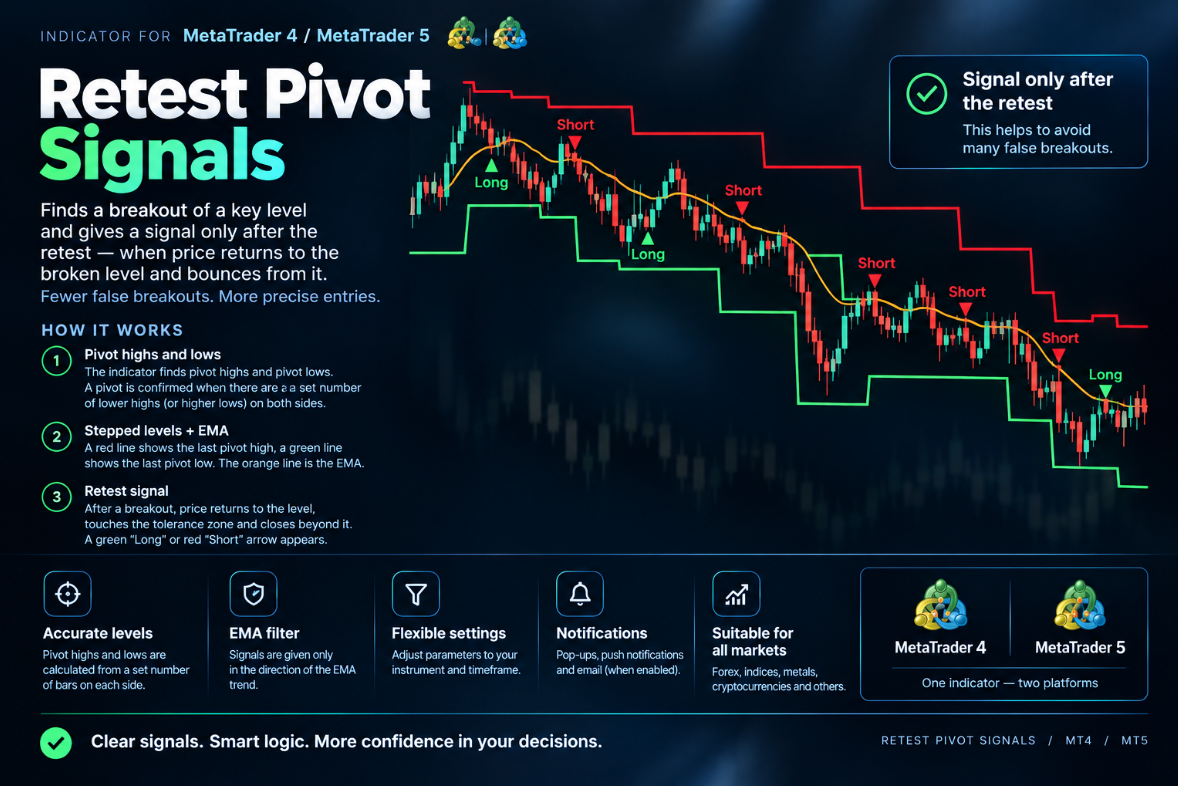
A signal appears when price comes back to test the broken level, within the Retest Tolerance (%) range, and closes back on the breakout side. A "Long" arrow is drawn below the bar after an upside breakout and a successful retest of the former resistance. A "Short" arrow is drawn above the bar after a downside breakout and a retest of the former support. Each breakout produces at most one signal, so the chart stays clean. The optional EMA trend filter (Use EMA Trend Filter, EMA Length) keeps only the signals that agree with the trend: longs above the EMA and shorts below it. The signals are generated on bar close, and the arrows automatically keep their distance from the candles when you zoom or resize the chart. The indicator can notify you by pop-up alert, push notification or email (Alerts, Push Notifications, Email Notifications).
MT5-version: https://www.mql5.com/en/market/product/200224
MT4-version: https://www.mql5.com/en/market/product/200236
Retest Pivot Signals 是一款 MetaTrader 5 指标,用于识别关键枢轴位(pivot)的突破,并且只在价格回踩该位置之后才发出信号,即价格回到被突破的线并从该处反弹。这样可以过滤一部分假突破:信号出现在价位得到确认之后,而不是突破的瞬间。 MT5-version: https://www.mql5.com/en/market/product/200224 工作原理 指标寻找枢轴高点和枢轴低点。当某个高点(或低点)左右两侧各有设定数量的K线,且其高点更低(或低点更高)时,该枢轴被确认。 图表上绘制两条阶梯线: 红色 为最近的枢轴高点, 绿色 为最近的枢轴低点。橙色线为 EMA。 做多(Long): 收盘价高于最近的枢轴高点(向上突破),随后价格回到该位置,触及容差区域,并重新收于该位置之上。K线下方出现绿色向上箭头,标注“Long”。 做空(Short): 相反。收盘价低于最近的枢轴低点,价格从下方回到该位置,并收于其下方。K线上方出现红色向下箭头,标注“Short”。 开启 EMA 过滤后,只有收盘价高于 EMA 才允许 Long,低于 EMA
Retest Pivot Signals 是一款 MetaTrader 5 指标,用于识别关键枢轴位(pivot)的突破,并且只在价格回踩该位置之后才发出信号,即价格回到被突破的线并从该处反弹。这样可以过滤一部分假突破:信号出现在价位得到确认之后,而不是突破的瞬间。 MT4-version: https://www.mql5.com/en/market/product/200236 工作原理 指标寻找枢轴高点和枢轴低点。当某个高点(或低点)左右两侧各有设定数量的K线,且其高点更低(或低点更高)时,该枢轴被确认。 图表上绘制两条阶梯线: 红色 为最近的枢轴高点, 绿色 为最近的枢轴低点。橙色线为 EMA。 做多(Long): 收盘价高于最近的枢轴高点(向上突破),随后价格回到该位置,触及容差区域,并重新收于该位置之上。K线下方出现绿色向上箭头,标注“Long”。 做空(Short): 相反。收盘价低于最近的枢轴低点,价格从下方回到该位置,并收于其下方。K线上方出现红色向下箭头,标注“Short”。 开启 EMA 过滤后,只有收盘价高于 EMA 才允许 Long,低于 EMA
Master Ice — Algorithmic Forex Expert Advisor for MT4 Master Ice is a fully automated Forex Expert Advisor for MetaTrader 4, designed for systematic market analysis, automated trade execution, and dynamic position management. The EA combines a configurable signal engine with money management, spread and volatility filters, pending-order management, basket trailing, and trading-series controls. How Master Ice Works Master Ice continuously analyzes market data using its Primary and Secondary
Arrival — Advanced Algorithmic Forex Expert Advisor for MT5 Arrival is a fully automated Forex Expert Advisor for MetaTrader 5, designed for systematic market analysis, algorithmic trade execution, and flexible position management. The EA combines a multi-level signal engine with automated money management, spread and volatility filters, pending-order management, basket trailing, and trading-series controls. How Arrival Works Arrival continuously processes market data through its Primary and
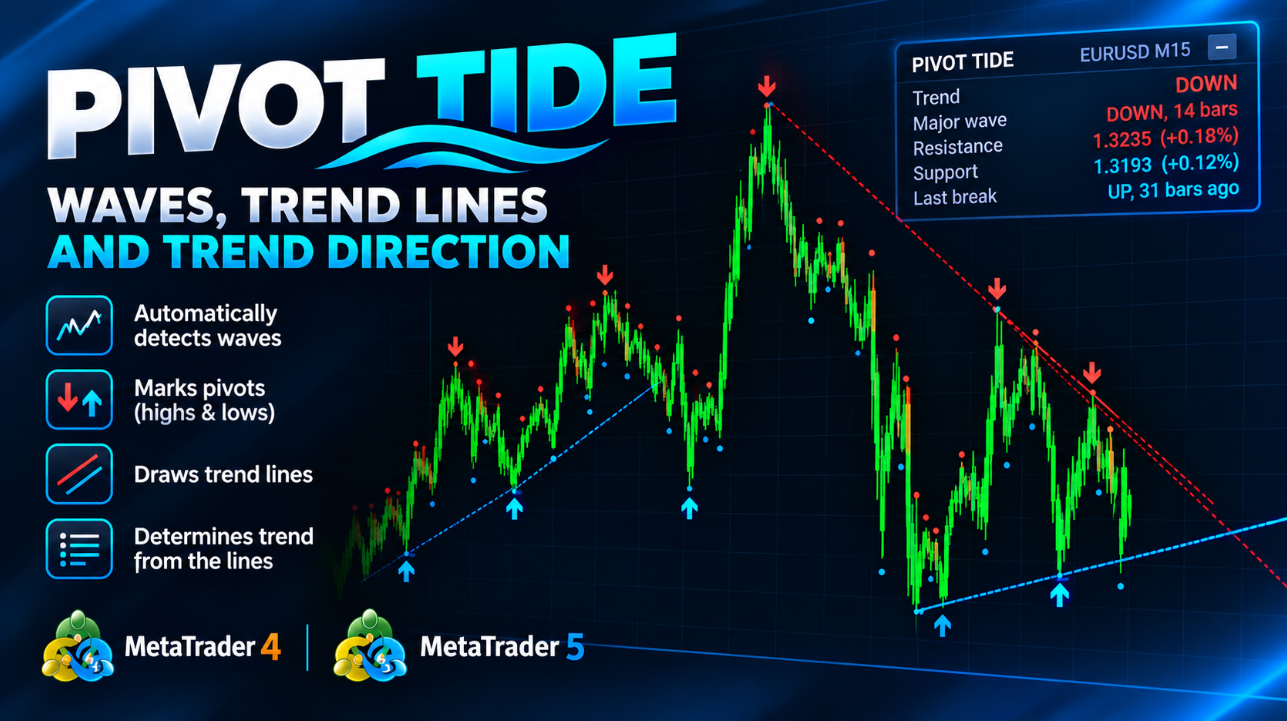
Pivots are joined into automatic trend lines: resistance through two falling peaks, support through two rising troughs. A line counts as broken when a candle closes beyond it, and live lines can extend to the right.
Trend comes from the lines. If both support and resistance are intact, it is a range. If only support survives, the trend is up. If only resistance survives, it is down. If neither survives, the last breakout decides. An optional draggable panel shows the trend, wave length, key levels and the last breakout, and alerts or push notifications fire on every trend change.
MT5-version: https://www.mql5.com/en/market/product/199662
MT4-version: https://www.mql5.com/en/market/product/199656
Pivot Tide — 波段拐点、自动趋势线与基于趋势线的趋势方向判断 Pivot Tide 是一款适用于 MetaTrader 4 的指标。它会自动把图表划分为若干波段,标记每个波段的高点和低点,通过这些拐点绘制趋势线,并根据趋势线的状态判断趋势方向。所有内容都直接显示在图表上,并附带一个紧凑的信息面板。 适用于任何品种、任何周期。 MT4-version: https://www.mql5.com/en/market/product/199656 指标的功能 识别波段。 波段由两条移动平均线的相对关系决定:快速 SMA 和慢速 LWMA。快线在慢线上方时为上升波段,快线在慢线下方时为下降波段。 标记拐点。 当波段结束(两条均线交叉)时,指标会在该波段的极值处放置标记:上升波段的最高点,或下降波段的最低点。 绘制趋势线。 通过相邻的同类拐点连线。 跟踪趋势线突破。 如果价格收盘突破某条趋势线,该线即视为已被突破,并在突破的K线处截断。 根据趋势线判断趋势 ,并在面板上显示(UP、DOWN 或 RANGE)。 波段在两个级别上计算: 主要波段 (较大的波段,默认长度
Pivot Tide — 波段拐点、自动趋势线与基于趋势线的趋势方向判断 Pivot Tide 是一款适用于 MetaTrader 4 的指标。它会自动把图表划分为若干波段,标记每个波段的高点和低点,通过这些拐点绘制趋势线,并根据趋势线的状态判断趋势方向。所有内容都直接显示在图表上,并附带一个紧凑的信息面板。 适用于任何品种、任何周期。 MT5-version: https://www.mql5.com/en/market/product/199662 指标的功能 识别波段。 波段由两条移动平均线的相对关系决定:快速 SMA 和慢速 LWMA。快线在慢线上方时为上升波段,快线在慢线下方时为下降波段。 标记拐点。 当波段结束(两条均线交叉)时,指标会在该波段的极值处放置标记:上升波段的最高点,或下降波段的最低点。 绘制趋势线。 通过相邻的同类拐点连线。 跟踪趋势线突破。 如果价格收盘突破某条趋势线,该线即视为已被突破,并在突破的K线处截断。 根据趋势线判断趋势 ,并在面板上显示(UP、DOWN 或 RANGE)。 波段在两个级别上计算: 主要波段 (较大的波段,默认长度
⭐️The classic trading style without any risky strategy (grid, martingale, doubling)
⭐️Every order has SL and trailing profit
⭐️ Bonus: any EA for free
Confluence Meter:26 个指标,一个综合评级 Confluence Meter 会计算 26 个常用指标的信号,并将它们汇总为简洁的"卖出 / 中性 / 买入"评级。无需打开几十个窗口,也不必手动比对读数。看一眼面板,就能知道所选周期上市场偏向哪一边。 MT5-version: https://www.mql5.com/en/market/product/199466 Our products: https://www.mql5.com/en/users/trendhunter/seller 图表上显示的内容 **Oscillators 仪表盘。**由 11 个震荡指标组成的评级:RSI、Stochastic、CCI、ADX、Awesome Oscillator、Momentum、MACD、Stochastic RSI、Williams %R、Bulls/Bears Power 和 Ultimate Oscillator。 **Moving Averages 仪表盘。**由 15 个趋势指标组成的评级:周期为 10、20、30、50、100、200 的
Confluence Meter:26 个指标,一个综合评级 Confluence Meter 会计算 26 个常用指标的信号,并将它们汇总为简洁的"卖出 / 中性 / 买入"评级。无需打开几十个窗口,也不必手动比对读数。看一眼面板,就能知道所选周期上市场偏向哪一边。 MT4-version: https://www.mql5.com/en/market/product/199466 Our products: https://www.mql5.com/en/users/trendhunter/seller 图表上显示的内容 **Oscillators 仪表盘。**由 11 个震荡指标组成的评级:RSI、Stochastic、CCI、ADX、Awesome Oscillator、Momentum、MACD、Stochastic RSI、Williams %R、Bulls/Bears Power 和 Ultimate Oscillator。 **Moving Averages 仪表盘。**由 15 个趋势指标组成的评级:周期为 10、20、30、50、100、200 的
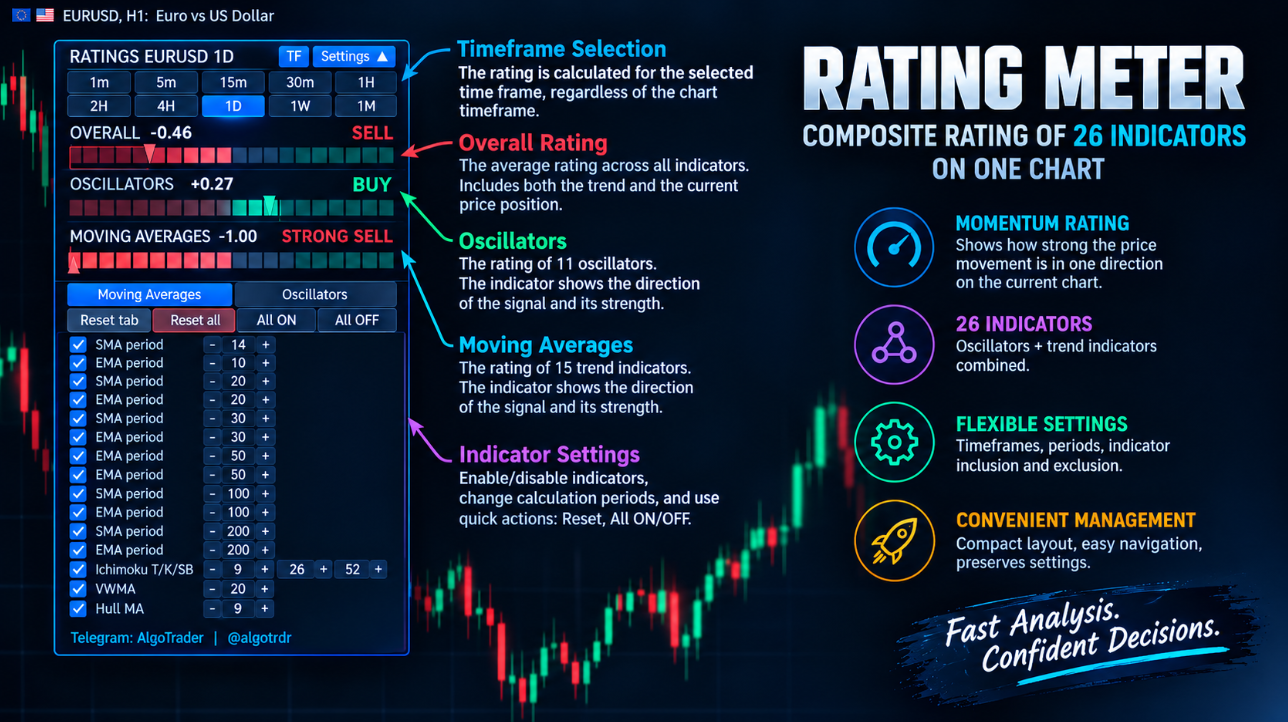
Rating Meter is a technical analysis panel for MetaTrader 5 that reads 26 popular indicators for you: 15 trend indicators (SMA and EMA on six periods, Ichimoku, VWMA and Hull MA) and 11 oscillators (RSI, Stochastic, MACD, CCI, ADX and others).
Each indicator casts a simple buy, neutral or sell vote, and the votes are averaged into a single rating from STRONG SELL to STRONG BUY. Two gauges show the oscillator and moving-average ratings separately, and an overall bar combines them. Each gauge has a needle and a vote counter, so you can see at a glance which way the market is leaning.
The panel is fully interactive. You can switch the rating between timeframes from 1 minute to 1 month, turn individual indicators on or off, and adjust their periods with plus and minus buttons, with the rating updating instantly.
The panel can be dragged anywhere on the chart, collapsed to show only the gauges, and it remembers your settings between restarts. It draws nothing on the price chart and opens no trades. It is a decision-support tool to use alongside your own strategy and risk management.
https://www.mql5.com/en/market/product/199402
Rating Meter:26 个指标,一个综合评级 Rating Meter 会自动计算 26 个常用指标的信号,并将它们汇总为简洁的"卖出 / 中性 / 买入"评级。无需逐个打开指标窗口手动对比,看一眼面板,就能知道所选周期上市场偏向哪一边。 Our products: https://www.mql5.com/en/users/trendhunter/seller 面板显示的内容 **Oscillators 仪表盘:**由 11 个震荡指标组成的评级:RSI、Stochastic、CCI、ADX、Awesome Oscillator、Momentum、MACD、Stochastic RSI、Williams %R、Bulls/Bears Power 和 Ultimate Oscillator。 **Moving Averages 仪表盘:**由 15 个趋势指标组成的评级:周期为 10、20、30、50、100、200 的 SMA 和 EMA,以及 Ichimoku、VWMA 和 Hull MA。 **Overall 综合条:**所有已启用指标的综合评级。
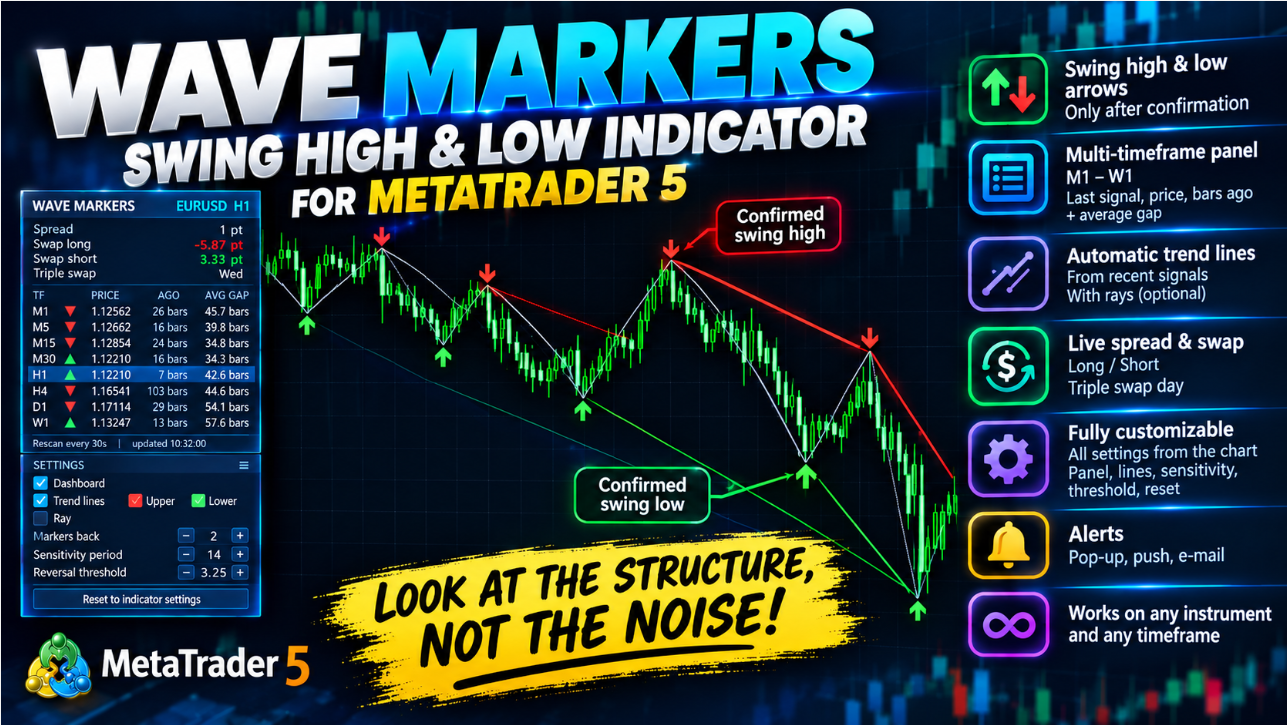
Wave Markers:自适应波浪图,附多周期信息面板 看清市场的真实结构,而不是噪音:已确认的波段高点与低点、穿过它们的趋势线,以及从 M1 到 W1 所有周期的情况,全部集中在一个面板里。 这是什么 Wave Markers 是适用于 MetaTrader 5 的图表结构指标。它会找出价格的转折点(波段高点和波段低点),用简洁的箭头标出,并围绕这些点提供实用工具:趋势线、全周期表格,以及实时点差和隔夜利息(Swap)显示。 指标不会发出"买入"或"卖出"指令,也不承诺任何结果。它只专注做好一件事:告诉你市场在哪里真正发生了转折,帮助你更快、更一致地阅读市场结构。 MT5-version: https://www.mql5.com/en/market/product/199158 为什么它不是又一个 ZigZag 传统的 ZigZag 使用固定距离(点数或百分比)来判断什么算转折。这一个数字大多数时候都不合适:市场平静时太大,会错过真正的波浪;市场快速时太小,会产生大量噪音。 Wave Markers 的做法不同: 反转阈值会根据当前波动率自动调整。
Wave Markers:自适应波浪图,附多周期信息面板 看清市场的真实结构,而不是噪音:已确认的波段高点与低点、穿过它们的趋势线,以及从 M1 到 W1 所有周期的情况,全部集中在一个面板里。 这是什么 Wave Markers 是适用于 MetaTrader 5 的图表结构指标。它会找出价格的转折点(波段高点和波段低点),用简洁的箭头标出,并围绕这些点提供实用工具:趋势线、全周期表格,以及实时点差和隔夜利息(Swap)显示。 指标不会发出"买入"或"卖出"指令,也不承诺任何结果。它只专注做好一件事:告诉你市场在哪里真正发生了转折,帮助你更快、更一致地阅读市场结构。 为什么它不是又一个 ZigZag 传统的 ZigZag 使用固定距离(点数或百分比)来判断什么算转折。这一个数字大多数时候都不合适:市场平静时太大,会错过真正的波浪;市场快速时太小,会产生大量噪音。 Wave Markers 的做法不同: 反转阈值会根据当前波动率自动调整。
Cosmos Orion — 黄金 H2 三点结构突破 EA 在混乱的市场里,建立秩序。 大多数黄金 EA,要么在猜方向,要么把风险藏在网格和马丁里。Cosmos Orion 两样都不做。 它不预测行情,只等价格走出确认的三点结构,真正突破才入场,并且每一单都有硬止损保护。 一套为真实交易而生的实战系统。 早鸟价 $299——仅限前 10 份。 现在购买的用户还送内部使用的精品EA一个。只限10份(还剩4) 赠品EA实盘信号: https://www.mql5.com/en/signals/2388805 和赠品EA的混用实盘信号:(即将上线) 重要:购买后私信我或者在评论区留言,获取使用说明配置文件等。 加入我们的频道能获取更新信息,福利活动,交易使用技巧等信息 https://www.mql5.com/en/channels/tendmaster 交易逻辑 - 在 H2 周期上识别已确认的三点拐点结构,所有拐点都用已收盘的 K 线确认。 - 结构成立后,在最新拐点附近挂出 Buy Stop 或 Sell Stop 突破单。 - 没有突破就不成交。超时或失效的挂单会自动撤销。 -
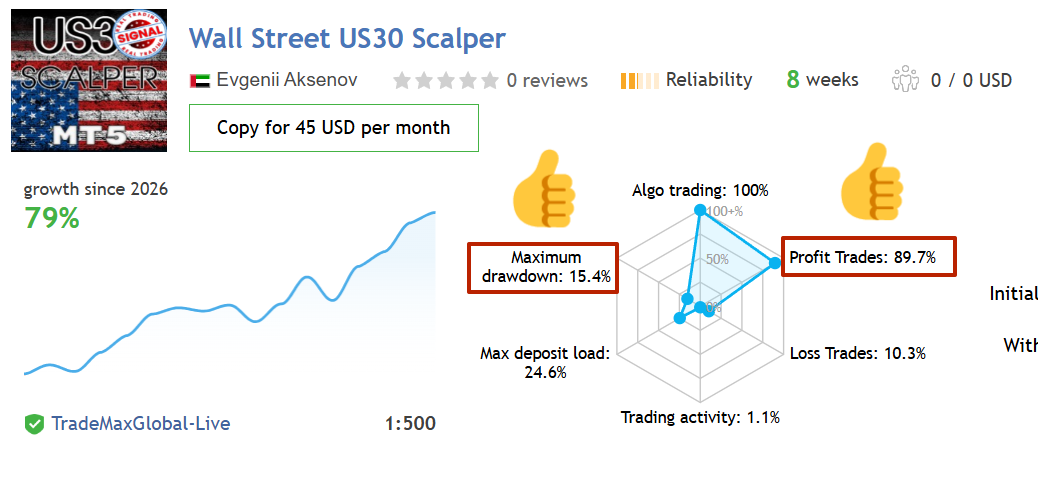
⚡ PROMO: BUY WS US30 scalper EA 3.2v and get any EA FOR FREE ⚡: https://www.mql5.com/en/users/neurofx/seller
📈 Real signal: https://www.mql5.com/en/signals/2385091
✅ Recommended broker: TMGM: https://rebrand.ly/9hs7uxg