Lorentzos Roussos / 个人资料
- 信息
|
11+ 年
经验
|
11
产品
|
298
演示版
|
|
220
工作
|
0
信号
|
0
订阅者
|
💎 The simplest Neural Network Coding Guide : https://www.mql5.com/en/blogs/post/752324
💎 The simplest DLL for mql5 Coding Guide : https://www.mql5.com/en/blogs/post/753426
💎 Harmonic patterns scanner for MT5 : https://www.mql5.com/en/market/product/51212
💎 Similar price action candlestick patterns indicator for MT5 : https://www.mql5.com/en/market/product/133318
💎 Fibonacci Sonar indicator : https://www.mql5.com/en/market/product/133627
💎 Chart projection indicator : https://www.mql5.com/en/market/product/5569
💎 Youtube : https://www.youtube.com/@lorentzor1938
| 规格质量 | 5.0 | |
| 结果检查质量 | 5.0 | |
| 可用性和沟通技巧 | 5.0 |
◼️ Short Video Presentation with no sound (if you dont want to read all that) :
https://www.youtube.com/watch?v=jJ8kzL5Wusk
Instant demo downloads ,wont need to register anything ,the demos have a nag screen on start for about 30seconds ,then it disappears :
◼️ Download Free Demo For MT4 : https://c.mql5.com/6/908/Voenix_Demo_MT4.ex4
◼️ Download Free Demo For MT5 : https://c.mql5.com/6/908/Voenix_Demo_MT5.ex5
📢 Subscribe to Telegram Channel for more : https://t.me/lorentzor
The scanner contains the following patterns :
✔️ ABCD pattern
✔️ Gartley pattern
✔️ Bat pattern
✔️ Cypher pattern
✔️ 3Drives pattern
✔️ Black Swan pattern
✔️ White Swan pattern
✔️ Quasimodo pattern or Over Under pattern
✔️ Alt Bat pattern
✔️ Butterfly pattern
✔️ Deep Crab pattern
✔️ Crab pattern
✔️ Shark pattern
✔️ FiveO pattern
✔️ Head And Shoulders pattern
✔️ Ascending Triangle pattern
✔️ One Two Three pattern
and 8 custom patterns .
✔️ Expert Advisor
✔️ MT4
✔️ MT5
✔️ MultiSymbol
✔️ MultiTimeframe
✔️ AutoTrades
✔️ Control From One Chart
✔️ Never Repaints
谐波模式扫描仪和交易员。一些图表模式 包括的模式: ABCD 模式 加特利模式 蝙蝠图案 密码模式 3驱动模式 黑天鹅图案 白天鹅图案 Quasimodo 模式或 Over Under 模式 替代蝙蝠图案 蝴蝶图案 深蟹纹 蟹纹 鲨鱼纹 五O型 头肩形态 上升三角形图案 一二三模式 和 8 种自定义模式 Voenix 是一款多时间框架和多对谐波模式扫描仪,支持 25 种图表和斐波那契模式。它采用自定义块光学算法,无需重新绘制,无需依赖确认步骤即可迅速发现可能的模式(与锯齿形计算不同)。 它可以自动交易您选择的模式、发送通知或只是将它们收集在一个表格中以便于访问和评估。 交易最多可以有 3 个利润目标,并且,在每个目标关闭的订单百分比方面的差异。 还提供了一个简单的步进跟踪功能。 每种形态都可以用自己的止损、目标、止损计算模式、警报设置、交易设置进行调整,并且可以在交易(或通知)之前接受额外的过滤器 这些过滤器是 rsi、macd、布林带、随机震荡指标和基本支撑和阻力解决方案的基本指标。
https://c.mql5.com/6/966/Similar_Price_Action_MQL4_Demo__1.ex4
💎 Similar price action MT5 free download for EURUSD :
https://c.mql5.com/6/966/Similar_Price_Action_MQL_Demo__1.ex5
💎 Similar price action basic showcase :
https://www.youtube.com/watch?v=Shzdwm_UUTo
☕️

斐波那契声纳 斐波那契声纳有一个内部价格行为模式库,收集自 28 个符号和 7 个时间范围。 每个模式分为两面。前侧和后侧。斐波那契声纳使用前侧来识别相似的模式。最近的价格行为(任何时刻)直到最新条的开盘价是用作搜索库的前侧。 后侧保存每个模式所见的所有活动的汇总。这就是斐波那契术语的用武之地。从过去每个模式的所有实例的开盘价中,我们以斐波那契序列部署了开盘价上方和下方的价格水平。然后,我们测量了达到价格水平的次数。如果将达到价格水平的次数除以单个价格模式存在的实例数,则可以将其提取为百分比 (%) 当然,对于每个模式,您可以想象在顶部斐波那契价格和底部斐波那契价格上都有一个百分比。这允许使用给定百分比值来查找价格的方法。例如,使用此方法,我们可以要求达到 50% 的时间的水平,该方法将返回价格水平。 这些水平就是您在图表上看到的。虽然它们是由斐波那契价格范围与其发生可能性相结合而创建的,但它们并不位于与每个模式的开盘价之间的斐波那契距离。 这些水平的预定发生百分比为: 75% 50% 33% 10% 0% 其中有 5 个高于开盘价,5 个低于开盘价。这些水平并不围绕开盘价对称。高于
相似价格行为指标 相似价格行为将查找与您选择的图表区域尽可能相似的过去烛台图案序列。 该指标将从您选择的价格行为区域的第一个烛台之前开始搜索,直到图表的第一个最旧条。 评估两个序列之间的相似性有几个标准: 序列的长度必须相同,如果您选择的区域是 20 个烛台宽,那么任何匹配的结果也必须是 20 个烛台宽。您可以选择任意数量的蜡烛。 将根据序列的高低大小进行视觉比较 将根据序列的开盘价和收盘价大小和方向进行视觉比较。如果蜡烛图对一个序列来说是看涨的,而对另一个序列来说是看跌的,则得分设置为 0.0 序列有一组快速和慢速移动平均线,它们根据其增量进行比较。增量可以在该区域内相对比较,也可以在整个资产范围内绝对比较(相对和绝对模式) 序列有一组快速和慢速 ATR,用于比较其波动性。同样,比较可以是相对的,也可以是绝对的。 序列有一组快速和慢速 RSI,用于比较其局部强度。 以上所有内容混合在一起以获得最终评级,其中每个组件都由一个系数加权。指标的输入中提供了系数和比较方法。 指标的搜索引擎 simipac 将扫描过去所有可能的蜡烛图序列,而不会破坏蜡烛的顺序。
花形指标是一种技术分析工具,主要用于识别趋势并辅助剥头皮交易或日内交易策略。 花形指标是一种基于技术和价格动态分析的信号趋势指标。它使用彩色花朵直观地指示趋势——蓝色花朵表示上升趋势,红色花朵表示下降趋势。 每个水平线都可以充当支撑位和阻力位(注意图表上出现的+/- 200水平线和点)。 您可以将点设置为在突破超买/超卖静态水平线、伴随的波段、两者兼有或其中任何一者时出现。 该指标在识别吸筹/派发区域的同时,还能发现市场的潜在逆转。它兼容任何交易工具和时间框架,参数可根据需要调整。每个水平线都可以充当支撑位和阻力位。 花卉指標是一種技術分析工具,主要用於識別趨勢並協助剝頭皮交易或日內交易策略。 花指標是基於技術和價格動態分析的訊號趨勢指標。它使用彩色花朵直觀地表示趨勢——藍色花朵表示上升趨勢,而紅色花朵表示下降趨勢 每個等級都可以充當支撐和阻力(注意 +/- 200 等級和圖表上出現的點) 您可以將點設定為在突破超買/超賣靜態水平或伴隨的波段(兩者或其中任何一個)時出現。
花形指标是一种技术分析工具,主要用于识别趋势并辅助剥头皮交易或日内交易策略。 花形指标是一种基于技术和价格动态分析的信号趋势指标。它使用彩色花朵直观地指示趋势——蓝色花朵表示上升趋势,红色花朵表示下降趋势。 每个水平线都可以充当支撑位和阻力位(注意图表上出现的+/- 200水平线和点)。 您可以将点设置为在突破超买/超卖静态水平线、伴随的波段、两者兼有或其中任何一者时出现。 该指标在识别吸筹/派发区域的同时,还能发现市场的潜在逆转。它兼容任何交易工具和时间框架,参数可根据需要调整。每个水平线都可以充当支撑位和阻力位。 花卉指標是一種技術分析工具,主要用於識別趨勢並協助剝頭皮交易或日內交易策略。 花指標是基於技術和價格動態分析的訊號趨勢指標。它使用彩色花朵直觀地表示趨勢——藍色花朵表示上升趨勢,而紅色花朵表示下降趨勢 每個等級都可以充當支撐和阻力(注意 +/- 200 等級和圖表上出現的點) 您可以將點設定為在突破超買/超賣靜態水平或伴隨的波段(兩者或其中任何一個)時出現。
If you posted something and you think "nice now that is online" it may not be online , you have to approve it , your post , on your wall.
I feel old man.
☕️
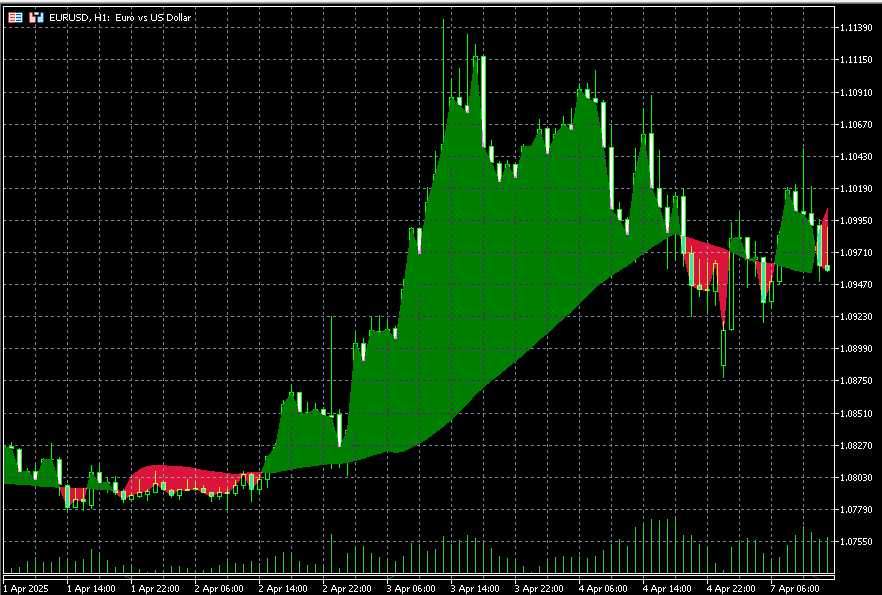
Lux Algo MT5 信号移动平均线 探索一款专为移动平均线交叉系统中信号线使用而设计的独特移动平均线指标。这款先进的工具的独特之处在于,它在区间震荡市场中偏离价格,而在趋势市场中则与标准移动平均线高度相似。这一特性有助于交易者避免不必要的噪音和因市场波动而导致的潜在过度交易。 在区间震荡市场中,移动平均线会偏离价格,而在趋势市场中则达到常规移动平均线的水平。 移动平均线交叉策略通常依赖于“信号”线,即一条用于判断总体趋势的较慢移动平均线。该信号线与一条较快移动平均线搭配使用,可以滤除常规价格与信号线交叉可能引发的潜在洗盘交易。 该指标将在更多区间震荡周期内偏离价格,从而有效减少价格与信号线交叉的次数。 价格与信号线之间区域的颜色由价格相对于信号线的位置决定,绿色指标表示价格高于信号线。 然而,信号线的颜色会考虑市场是趋势还是区间波动,只有在市场趋势出现时才会改变。 该指标最初由 Lux Algo 开发,用于交易查看。
Lux Algo MT5 信号移动平均线 探索一款专为移动平均线交叉系统中信号线使用而设计的独特移动平均线指标。这款先进的工具的独特之处在于,它在区间震荡市场中偏离价格,而在趋势市场中则与标准移动平均线高度相似。这一特性有助于交易者避免不必要的噪音和因市场波动而导致的潜在过度交易。 在区间震荡市场中,移动平均线会偏离价格,而在趋势市场中则达到常规移动平均线的水平。 移动平均线交叉策略通常依赖于“信号”线,即一条用于判断总体趋势的较慢移动平均线。该信号线与一条较快移动平均线搭配使用,可以滤除常规价格与信号线交叉可能引发的潜在洗盘交易。 该指标将在更多区间震荡周期内偏离价格,从而有效减少价格与信号线交叉的次数。 价格与信号线之间区域的颜色由价格相对于信号线的位置决定,绿色指标表示价格高于信号线。 然而,信号线的颜色会考虑市场是趋势还是区间波动,只有在市场趋势出现时才会改变。 该指标最初由 Lux Algo 开发,用于交易查看。
So while it may be not probable that a profitable strategy will be shared on the mql market , in trading view it is impossible by design (if the author knows the strategy is profitable)
Can you post a profitable strategy on both platforms by accident ? Yes
Is someone with a proprietary profitable system likely to share it on mql5 ? maybe
Is someone with a proprietary profitable system likely to share it on trading view ? no
So somehow mql has an advantage again .
Add to that trading view is getting blindsided by not adapting to address the lack of brokers ☕️
| 规格质量 | 5.0 | |
| 结果检查质量 | 5.0 | |
| 可用性和沟通技巧 | 5.0 |
Noticed an interesting way to gauge the trend.
These kids measured the correlation of the price with the bar index .
The bar index is a constantly increasing value .
Interesting.
☕

| 规格质量 | 5.0 | |
| 结果检查质量 | 5.0 | |
| 可用性和沟通技巧 | 5.0 |
What is your brain doing ?
You are learning something from another field (music) ,your brain likes the components and the way they are presented.
☕️
we cannot assume the same for a neural net and one sample , so what if we inject random noise into the features . The equivalent of having the steering wheel in the example above randomly turn left or right for instance.
That noise does not mean anything in the real example as it rarely occurs on its own.
☕️
It had one error .
Its over ☕️


