|
13+ 年
经验
|
11
产品
|
78
演示版
|
|
302
工作
|
0
信号
|
0
订阅者
|
Multi Volume Profile – Professional Market Analysis Tool Understand the Market Beyond Price Volume Profile is a powerful market analysis indicator designed to help traders identify important price levels based on trading activity. Instead of displaying volume over time, it organizes volume across different price levels, revealing where the market has experienced the greatest and lowest trading activity. By visualizing market participation and price acceptance, Volume Profile helps traders
Advanced Volume Indicator is a custom MetaTrader 5 indicator that tracks directional changes in the Bid price and aggregates them into a delta line. The indicator classifies upward and downward Bid price movements into separate groups, assigning each movement to its corresponding chart candle. The difference between these two groups is then calculated to produce a net directional measure of Bid quote activity. Unlike conventional tick-volume indicators, Bid Change Delta focuses on the direction
Analyze price in relation to volume-weighted average price from important market reference points. Anchored VWAP Toolkit lets you display and compare up to three independent VWAPs on one chart, each with its own anchor type, color, and settings. FEATURES • Three configurable VWAP anchors in one indicator instance • Volume-weighted standard deviation bands • Live dashboard showing VWAP values, price distance in points, and volume source • Optional alerts when a closed candle crosses an active
Session Volume Profile displays a separate volume-by-price profile for the configured Asia, London and New York trading sessions. It helps you inspect where activity accumulated during each session using the Point of Control, Value Area and volume-node levels. Profile levels and display - Point of Control (POC): the price row with the highest calculated volume. - Value Area High (VAH) and Value Area Low (VAL): the boundaries containing the configured share of the profile volume. The default is
Session Liquidity Map Session Liquidity Map is a MetaTrader 5 chart indicator for visualizing configurable market sessions and analyzing how price interacts with each session’s range. It marks session highs, lows, and opens, then identifies confirmed liquidity tests, sweeps, and breaks using closed candles. A compact dashboard summarizes session status, recent liquidity events, current session, overlap, and directional context. Key Features Configurable UTC Sessions Configure the start and end
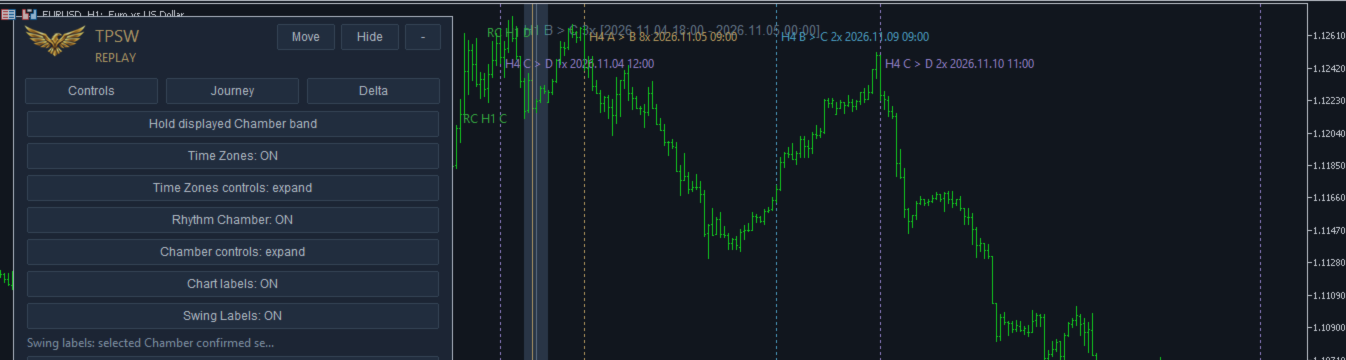
TPSW "Time x Price X Symmetry Windows" TPSW is a MetaTrader 5 indicator for manually reviewing trade setups and studying how price and market structure behave around projected time windows. You can work through your own entry, confirmation and invalidation rules directly on the chart, without setting up an automated backtest. Pick Candle and Historical Review. Choose a historical candle as your starting point. Use Previous host bar and Next host bar to move one chart candle at a time, then
This article explains exposure-aware economic news monitoring for Prop Firm Guard in MetaTrader 5. The EA builds a unique currency set from supported open positions, treats XAUUSD as USD exposure, filters Economic Calendar events by currency, minimum importance, specific scheduled datetime, and search horizon, and selects the nearest qualifying event. The resulting countdown and restriction window are integrated into the EA through OnInit() and OnTimer().
SMC Structure Analytics Professional Smart Money Concepts Market Structure Indicator for MetaTrader 5 SMC Structure Analytics is a professional chart analysis indicator designed to simplify Smart Money Concepts analysis on MetaTrader 5. The indicator combines market structure, BOS, CHoCH, Order Blocks, Fair Value Gaps, liquidity levels, liquidity sweeps, Premium and Discount zones, session levels, and multi-timeframe bias into one clean and organized interface. It is designed for traders who

QUORUM OSCILLATOR – Adaptive Market Regime & Momentum Oscillator 三层分析。两条曲线。更全面的市场解读。 Quorum Oscillator 是一款适用于 MetaTrader 5 的技术指标,它将极值分析、周期行为和方向效率整合在一个直观的震荡指标中。 与无论市场状况如何都保持固定解读方式的传统震荡指标不同,Quorum 会动态调整其计算权重:在震荡(横盘)市场中更侧重极值表现,而在趋势市场中更侧重周期行为。 由此打造出的这款工具,旨在帮助交易者更准确地解读市场动能、识别潜在的方向转变,并评估不同市场要素何时开始形成共振。 Quorum 的独特之处是什么? Quorum 基于三个互补的分析层级运作: 1. Extreme Layer – 极值检测层 使用反向威廉指标(Williams %R)作为价格在区间内相对位置的来源,并应用费舍尔变换(Fisher Transform),以更敏锐地捕捉极端价格波动。 有助于识别价格何时在近期波动区间内处于相对过度延伸的位置。 2. Cycle Layer – 周期分析层