RBM Crossmark Radar

RBM CROSSMARKET RADAR

INSTITUTIONAL MARKET INTELLIGENCE

PREMIUM EDITION | MULTI-BROKER TECHNOLOGY

RBM TRADER | GFT | USDX

A NEW PERSPECTIVE ON GLOBAL MARKETS

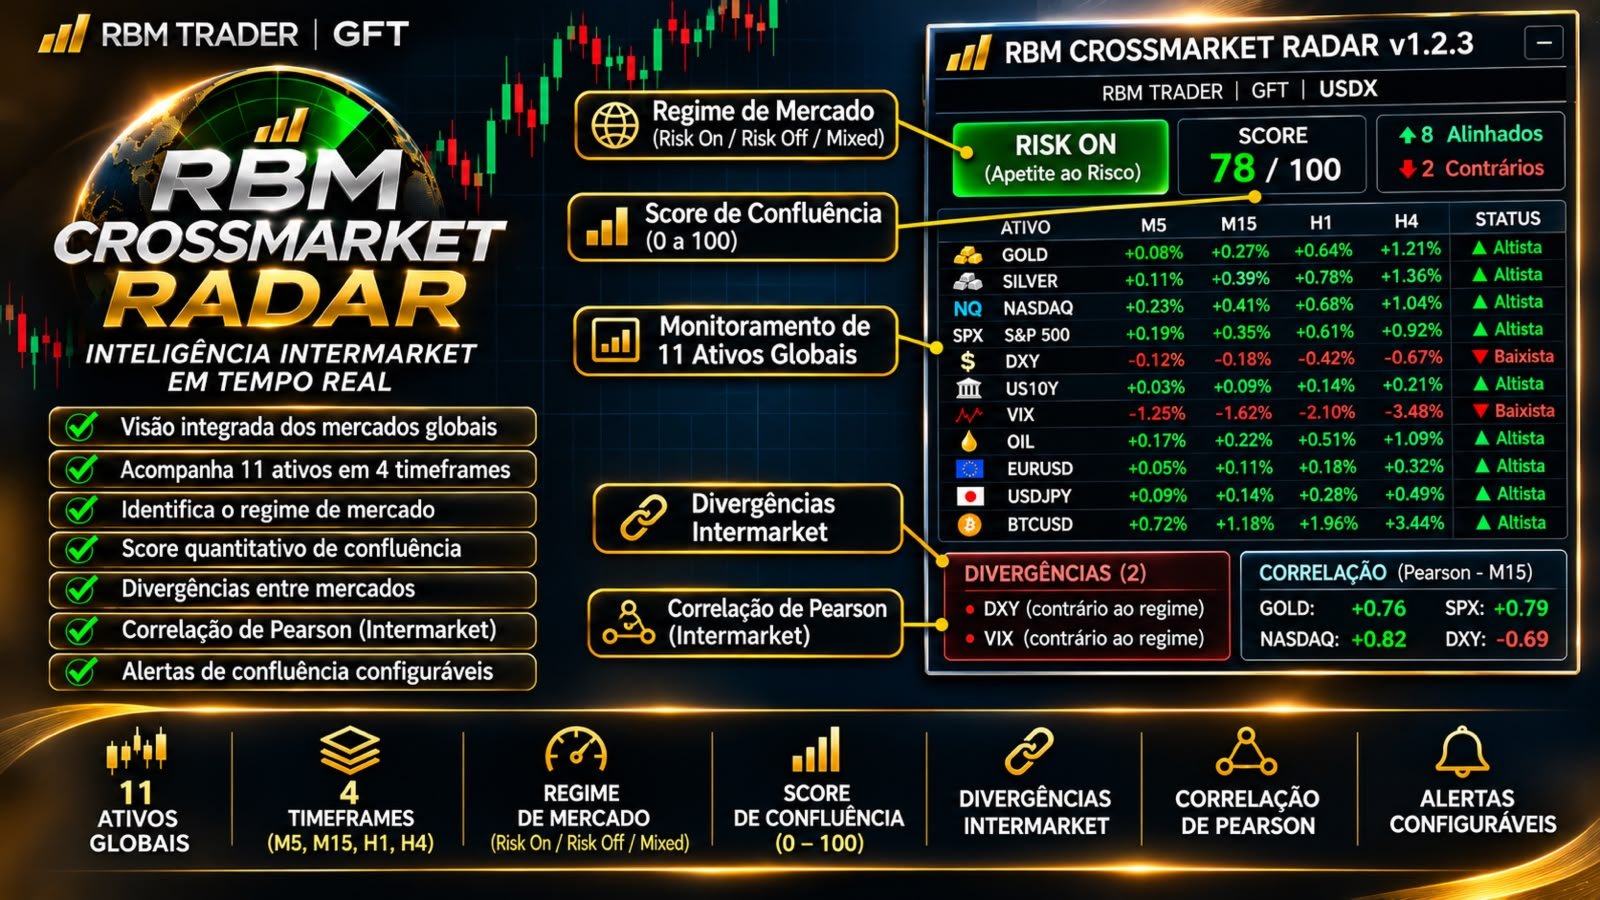
The RBM CROSSMARKET RADAR is an advanced intermarket intelligence tool developed for traders who want to expand their market perspective and understand the relationships between different financial asset classes.

Instead of analyzing each chart in isolation, the system brings together information from up to eleven global instruments in a single dashboard, allowing traders to monitor simultaneous movements, identify directional alignment and observe divergences across markets.

Its purpose is to integrate market context, correlation and intermarket behavior into an objective visual framework, providing an additional layer of information for the trader's decision-making process.

GLOBAL ASSET MONITOR

Monitor up to 11 major international market references:

  • GOLD: Gold
  • SILVER: Silver
  • NASDAQ: US technology index
  • S&P 500: US equity market
  • DXY: US Dollar Index
  • US10Y: US 10-Year Treasury
  • VIX: Volatility Index
  • OIL: Crude Oil
  • EURUSD: Euro versus US Dollar
  • USDJPY: US Dollar versus Japanese Yen
  • BITCOIN: Bitcoin

Each instrument displays its percentage change across four timeframes, allowing traders to compare market behavior across different horizons.

MULTI-TIMEFRAME ANALYSIS

  • M5: Short-term market behavior.
  • M15: Intraday market dynamics.
  • H1: One-hour market context.
  • H4: Broader market perspective.

This simultaneous view helps identify converging movements, directional changes and differences in behavior across monitored assets.

GLOBAL MARKET REGIME

The system evaluates available directional factors and classifies the global market environment into three regimes:

RISK ON | RISK APPETITE
A predominance of factors associated with an environment of increased risk appetite.

RISK OFF | RISK AVERSION
A predominance of factors associated with a more defensive market stance.

MIXED MARKET
No clear directional predominance among the evaluated factors.

INTELLIGENCE SCORE

A quantitative scoring system displays a result from 0 to 100, calculated from the proportion of aligned directional votes among the available factors.

The dashboard also displays:

  • Number of aligned votes.
  • Number of opposing factors.
  • Availability of the instruments used.
  • Data quality classification.

INTERMARKET DIVERGENCE ENGINE

Identify when specific markets behave contrary to the prevailing market regime.

The intermarket divergence module highlights factors that do not follow the predominant direction, allowing traders to investigate potential conflicts between indices, currencies, commodities and risk assets.

This analysis helps provide broader market context and reduces reliance on the direction of a single instrument.

PEARSON CORRELATION ANALYSIS

The correlation module uses the Pearson statistical coefficient to measure the relationship between the current chart instrument and the monitored assets.

The analysis uses M15 data and a configurable historical window, displaying positive, negative or near-zero relationships.

MULTI-BROKER TECHNOLOGY

Designed for use across different trading environments, RBM Crossmarket Radar features automatic symbol recognition and individual manual configuration.

Its architecture supports different naming conventions, including broker-specific suffixes and symbol variations.

  • Automatic recognition of available symbols.
  • Manual configuration of all 11 instruments.
  • Support for different broker naming conventions.
  • Identification of unavailable instruments.
  • Verification of historical data availability.

IMPORTANT: ASSET AVAILABILITY

The availability of instruments depends on the broker, account type, instruments offered and permissions to access market data.

Not all brokers provide all eleven instruments. Symbol naming may also vary between providers. When necessary, users can manually configure the corresponding symbol in the indicator settings.

The absence of a specific instrument may reduce data coverage and affect analyses that depend on that asset. The system does not automatically replace an unavailable instrument with another one.

INSTITUTIONAL ALERT SYSTEM

Receive alerts when the configured strong-confluence conditions are met.

  • Configurable minimum score.
  • Minimum number of aligned factors.
  • Platform alerts.
  • Optional push notifications.
  • Individual alert settings.

PREMIUM PANEL & CUSTOMIZATION

  • Institutional dashboard integrated into the chart.
  • Configurable automatic updates.
  • Customizable panel positioning.
  • Button to hide and restore the dashboard.
  • Consolidated display of intermarket information.
  • Native MQL5 development for MetaTrader 5.

THINK BEYOND THE CHART.

THE WORLD MOVES AS ONE MARKET.

RBM TRADER | GFT | USDX

VISIT THE RBM TRADER ECOSYSTEM

RISK DISCLAIMER AND LIMITATIONS

RBM Crossmarket Radar is an analytical and decision-support tool. Its classifications, scores, correlations and alerts are based on quantitative rules and data provided by the broker. It does not constitute investment advice, guaranteed buy or sell signals, price forecasts or a promise of profitability. Statistical correlation does not imply causation. Data availability, quality, updates and historical coverage depend on the broker and the trading environment used. Users are responsible for validating instruments and their settings before using the information in trading decisions.

作者的更多信息
RBM Flow Footprint
Renato Brendim Medici
RBM Flow Footprint Read what happens inside every candle. RBM Flow Footprint shows, at each price level, how much was traded by buyers and sellers, right on your MetaTrader 5 chart, in a clean, dark, professional design. Instead of deciding only by candle body and wick, you see where the market really fought, where one side took control, and where price moved through without finding interest. What you see on the chart Bid x Ask footprint: each candle becomes a column. The left half shows selling
FREE
RBM Quick Entry Panel
Renato Brendim Medici
RBM Quick Entry Panel PRO SHORT DESCRIPTION One-click on-chart entry panel: lot size, stop loss, take profit, up to 3 partial exits and automatic breakeven. FULL DESCRIPTION Anyone who trades every day knows the hard part is rarely the analysis. It's the execution. Opening the order window, typing the lot, working out the stop, remembering to take partials, moving to breakeven at the right moment. In a fast market every one of those steps costs seconds and leaves room for mistakes. RBM Quick Ent
FREE
RBM Gold Liquidity Hunter
Renato Brendim Medici
5 (1)
Gold doesn’t forgive a bad entry. It sweeps stops, tricks anyone reading the candle at face value, and reverses right when everyone’s convinced the trend is set. RBM Gold Liquidity Hunter shows you exactly where those traps happen, before you walk into one. The indicator maps yesterday’s high and low automatically and draws the Asian session range live on your chart, that window that usually decides where the day is headed once London and New York show up. When price breaks one of those levels
FREE
SMC Intraday
Renato Brendim Medici
SMC INTRADAY RBM Quick User Manual Smart Money Concepts | MetaTrader 5 1. Installation Open MetaTrader 5. Go to File → Open Data Folder. Navigate to MQL5 → Indicators and copy the indicator file into this folder. Open MetaEditor, compile the file, and return to MetaTrader 5. Refresh the Navigator, locate SMC Intraday RBM, and drag it onto the desired chart. 2. How to Interpret the Indicator BOS — Break of Structure: A break of a previous market structure that may indicate continuation of the cur
FREE
RBM Flow Structure PRO
Renato Brendim Medici
RBM Flow Structure PRO Advanced Capital Flow and Market Structure Analysis for MetaTrader 5 Five integrated modules. One tool. A more complete market view. RBM Flow Structure PRO is a multifunctional indicator designed for traders who want to gain a deeper understanding of market behavior. It combines capital flow analysis, price structure, supply and demand zones, and key trading levels on a single chart. With five independent and configurable modules, the indicator helps organize your analysis
FREE
RBM Smc
Renato Brendim Medici
RBM SMC Liquidity Hunter MT5 — Institutional Structure and Liquidity Indicator   The RBM SMC Liquidity Hunter is a professional tool developed to map Smart Money Concepts (SMC) dynamics directly on your charts. The indicator tracks market structure breaks, validates supply and demand zones using price displacement, and detects liquidity sweeps confirmed by volume, integrating all confluences into an executive on-chart dashboard.   Key Features  Market Structure Mapping (BOS / CHoCH): Automatic
FREE
RBM Delta Gold
Renato Brendim Medici
5 (1)
黄金市场的波动不仅仅来自价格本身,更来自买卖双方的主动进攻、市场失衡以及资金流向。Delta 指标正是为揭示这些核心变化而打造。 RBM Trader 的 XAUUSD Delta 指标能够识别主动买盘与主动卖盘之间的差异,帮助交易者在价格走势变得明显之前,提前发现真实的市场压力。 大多数交易者只关注K线,而 Delta 能够展示价格背后真正发生的资金行为。 该指标专为 XAUUSD 黄金市场开发,充分考虑了黄金在美盘、亚盘和欧盘期间的高波动特性与市场行为。 主要功能: * 主动买卖压力识别   * 市场动能衰竭检测   * 潜在反转确认   * 突破有效性验证   * 更精准的资金流与动量分析   * 简洁直观的界面   * 针对剥头皮、日内交易和短线交易优化   Delta 指标并不是随机发出交易信号,而是帮助交易者理解市场背景与真实资金力量,避免情绪化入场,并识别机构资金真正活跃的位置。 非常适合希望在黄金市场中获得更高精准度、更专业资金流分析以及更好入场时机的交易者。
FREE
RBM Volume Profile Master
Renato Brendim Medici
RBM VolumeProfileMaster Professional Volume Profile Analysis for MetaTrader 5. RBM VolumeProfileMaster was developed to analyze volume distribution across price levels, identify areas of trading concentration, and provide a clearer understanding of market acceptance and rejection zones. A comprehensive analytical tool combining Volume Profile, market structure, and volume flow analysis in a single interface. KEY FEATURES Volume Profile: Displays traded volume distribution across individual pric
FREE
RBM Trader Painel
Renato Brendim Medici
RBM Trade Panel - Automatic Lot Calculator and Order Management Fast execution panel for MetaTrader 5 featuring automatic dollar-based risk calculation, chart-based partial exits, one-click breakeven, and complete order management. Full Description Doing manual math or switching to external position calculators while price moves rapidly usually leads to missed entries or oversized positions. The RBM Trade Panel fixes this directly on your MetaTrader 5 chart by handling all risk calculations a
FREE
RBM OB Dashboard
Renato Brendim Medici
RBM OB Dashboard Short Description Market structure indicator featuring BOS, ChoCH, Pending Breaks, scored Order Blocks, FVG, liquidity sweeps, sessions, Volume Profile, and a draggable dashboard. Full Description The RBM OB Dashboard reads market structure and key price reaction zones directly on the chart. It combines BOS, ChoCH, Order Blocks, Fair Value Gaps (FVG), liquidity, sessions, Kill Zones, Volume Profile, and a compact dashboard for rapid analysis. Built for traders who rely on market
FREE
RBM Volume Ultimate
Renato Brendim Medici
RBM Volume Ultimate RBM Volume Ultimate is an indicator for MetaTrader 5 that combines buyer and seller financial volume, cumulative delta, daily VWAP and automatic detection of absorption and exhaustion in a single panel. The purpose of the indicator is to give traders a clearer view of buying and selling flow in real time. The histogram separates financial volume between buyers and sellers on a bar by bar basis, making it easier to identify moments when pressure shifts from one side of the ma
FREE
RBM Zoomscroll
Renato Brendim Medici
RBM Zoom Scroll Every trader knows the feeling. You are on the gold M5, you want to see how the whole day built up, and you start clicking zoom buttons or dragging the price scale around. By the time you are done, the move you wanted to look at is already gone. RBM Zoom Scroll fixes this the way it should have worked from day one: you spin the mouse wheel over the chart and the chart zooms. No buttons, no menus, no dragging. How it works Scroll: zooms the chart in and out horizontally, which mea
FREE
RBM Volume Real 2
Renato Brendim Medici
5 (2)
O RBM Volume Real foi desenvolvido para transformar volume em informação útil para tomada de decisão. Em vez de observar apenas a movimentação do preço, o indicador permite identificar quem está dominando o mercado em determinado momento: compradores ou vendedores. O primeiro dado apresentado é o volume de Compras, que representa a agressão dos participantes que aceitaram pagar o preço pedido para entrar no mercado. Já o volume de Vendas mostra a agressão daqueles que aceitaram vender ao preço
FREE
RBM Prior Cote
Renato Brendim Medici
The previous day's open, close, high and low are among the levels the market respects most. Gold, Nasdaq, forex, indices: price comes back to these points, tests them, rejects them or breaks through. RBM Prior Cote draws them for you automatically, so you stop marking lines by hand every morning. What it does • Plots the open, close, high and low of the previous daily candle • Shows the last several days of history (you choose how many), so you can see where price actually reacted • Adds a la
FREE
RBM Atr Pro
Renato Brendim Medici
RBM ATR PRO v1.10 Quem opera mercado volátil sabe como é ruim tomar stop por causa de uma violinada de pavio e ver o preço andar forte a favor logo depois. O RBM ATR PRO foi desenvolvido exatamente para resolver isso. Ele evolui o indicador clássico de volatilidade combinando a leitura do ATR com dois níveis independentes de suavização. A linha no gráfico fica limpa e objetiva: verde para estrutura de alta e vermelha quando o mercado vira para a baixa. Funciona perfeitamente para rastrear a ten
FREE
RBM Volume Real Pro
Renato Brendim Medici
RBM Volume Real PRO 3.0 RBM Volume Real PRO 3.0 was developed to transform volume data into actionable market intelligence. While most traders focus exclusively on price movement, this indicator allows users to identify the participants truly driving the market by revealing the balance of power between buyers and sellers in real time. The first component is Buy Volume, which represents the aggression of participants willing to execute orders at the asking price. Conversely, Sell Volume measur
FREE
RBM Watermarkgrid
Renato Brendim Medici
RBM Watermark Grid - MQL5 Market Description RBM Watermark Grid A transparent symbol watermark plus a clean, wide-spaced grid for your MetaTrader 5 charts. Overview RBM Watermark Grid gives your chart a cleaner, more professional look. It shows the symbol name (and optionally the symbol description and timeframe) as a subtle watermark in the center of the chart, and replaces the default MT5 grid with a softer, more open grid that has fewer lines and does not clutter your candles. Key features Sy
FREE
RBM PivotZones
Renato Brendim Medici
RBM Pivot Zones automatically detects pivot highs and lows directly on the chart, marking each level with a horizontal line and a subtle visual zone. The logic is straightforward: the indicator scans price history looking for structural tops and bottoms, the areas where price arrived, rejected, and reversed. Pivot highs in blue, pivot lows in red. Clean chart, no clutter. The indicator adjusts to any timeframe automatically. It works the same way on M5, H1, or D1 without reconfiguration. Sensiti
FREE
RBM Stop and Take Label
Renato Brendim Medici
5 (1)
Here is the English version of the product description, tailored to sound clear, professional, and engaging for the MQL5 Market: RBM SL TP Label — Indicator for MetaTrader 5 If you trade Forex and miss seeing the exact financial value of your risk and target directly on your chart, this indicator solves that in a clean, direct, and intuitive way. What It Does As soon as you open a position, the indicator automatically detects your Stop Loss and Take Profit lines and displays, in real-time, both
FREE
RBM Atr Pro 01
Renato Brendim Medici
RBM ATR PRO v1.20 Intelligent Volatility Analysis & Dynamic Trailing Stop RBM ATR PRO is a professional trading indicator designed to analyze market volatility, monitor price direction, and assist traders with position management through a dynamic trailing stop reference. Based on the Average True Range (ATR) methodology, the indicator measures market price fluctuations and provides a dynamic visual reference to help traders understand changes in volatility and market conditions. MAIN FEATURES D
FREE
RBM Nasdaq Liquidity Hunter Institutional Liquidity Indicator for Nasdaq RBM Nasdaq Liquidity Hunter is an advanced liquidity analysis tool developed for Nasdaq traders who want to identify institutional liquidity events with greater precision. Instead of highlighting every breakout, the indicator filters market noise and identifies only liquidity sweeps confirmed by volume, trend, and multiple institutional confluence factors. Every detected event is evaluated through a proprietary scoring
FREE
RBM Calendario Pro
Renato Brendim Medici
RBM | CALENDAR PRO MACROECONOMIC INTELLIGENCE DIRECTLY INSIDE METATRADER 5 Developed by RBM.TRADER RBM | CALENDAR PRO is an advanced economic calendar dashboard designed for traders who want to monitor major global macroeconomic events directly inside MetaTrader 5. More than just an economic agenda, this tool organizes essential economic information, allowing you to track upcoming releases, compare market expectations and identify economic surprises that may influence financial markets. KEY FEAT
FREE
SMC Intraday RBM
Renato Brendim Medici
SMC INTRADAY RBM R2 PRO Understand market structure. Identify liquidity. Evaluate confluences before making a trading decision. The SMC Intraday RBM R2 PRO is a professional trading indicator designed for traders seeking a comprehensive understanding of market structure. It combines Smart Money Concepts, liquidity analysis, relative volume, VWAP and multi-timeframe trend confirmation. Rather than identifying isolated patterns, the indicator organizes multiple market conditions into an integrate
FREE
RBM EA Pro Gold
Renato Brendim Medici
RBM EA PRO — the most complete Expert Advisor you’ll find for XAUUSD Gold doesn’t behave like any other asset. It reacts to US interest rates, dollar strength, breaking news, and it loves to sweep stops before making its real move. RBM EA PRO was built specifically to handle that complexity, with no shortcuts and no impulsive entries. How it decides to enter This isn’t a robot that buys or sells at random. RBM EA PRO only considers an entry when multiple layers of analysis agree with each ot
RBM EA Deluxe
Renato Brendim Medici
An XAUUSD-focused robot that only enters when several market conditions line up at once: trend, volume, price structure and session. It shows you exactly what it’s analyzing on the chart, and why it decided to trade or wait. Most gold robots you’ll find out there run on something simple: a moving average cross, or a channel breakout, and that’s it. The problem is gold doesn’t trade that way. It sweeps liquidity, traps early entries, and usually only moves for real after shaking everyone out fir
RBM QuickEntryPanel PRO
Renato Brendim Medici
RBM QUICK ENTRY PRO PANEL LEGEND Trade execution, risk management and operational control for MetaTrader 5 PRODUCT OVERVIEW The RBM Quick Entry PRO | Panel Legend is a professional trade execution and position management panel developed for MetaTrader 5. It combines order entry, risk control, position management and performance monitoring in a compact interface integrated into the chart. MAIN FEATURES 01 | TRADE EXECUTION Market orders: BUY and SELL. Pending orders: BUY LIMIT and SELL LIMIT. St
RBM Heatmap Pro
Renato Brendim Medici
RBM Heatmap PRO 2.08 Visualize market strength across multiple asset classes in a single dashboard. RBM Heatmap PRO is an indicator developed for MetaTrader 5 that brings multiple asset classes together in a visual dashboard, allowing traders to monitor percentage changes, prices, and relative market movements in a clear and organized way. Featuring a professional interface, dynamic asset management, and bilingual support, the indicator is designed for traders who need to monitor different marke
RBM Market Intelligence
Renato Brendim Medici
RBM MARKET INTELLIGENCE AI 1.6 MARKET INTELLIGENCE | QUANTITATIVE ANALYSIS | PROFESSIONAL CHART VISUALIZATION Developed by RBM Trader for MetaTrader 5. RBM Market Intelligence AI 1.6 is an advanced quantitative market analysis indicator that combines trend analysis, volume activity, market pressure, liquidity detection and multi-timeframe alignment into one integrated analytical environment. Version 1.6 introduces advanced chart visualization, allowing traders to monitor important technical comp
FREE
筛选:
无评论
回复评论