Abiroid Harmonic Patterns MT4
- 指标
- 版本: 1.1

What the Chart Engine Draws
When you attach Abiroid Harmonic Patterns to a chart, you will see:
| On the chart | Meaning |
|---|---|
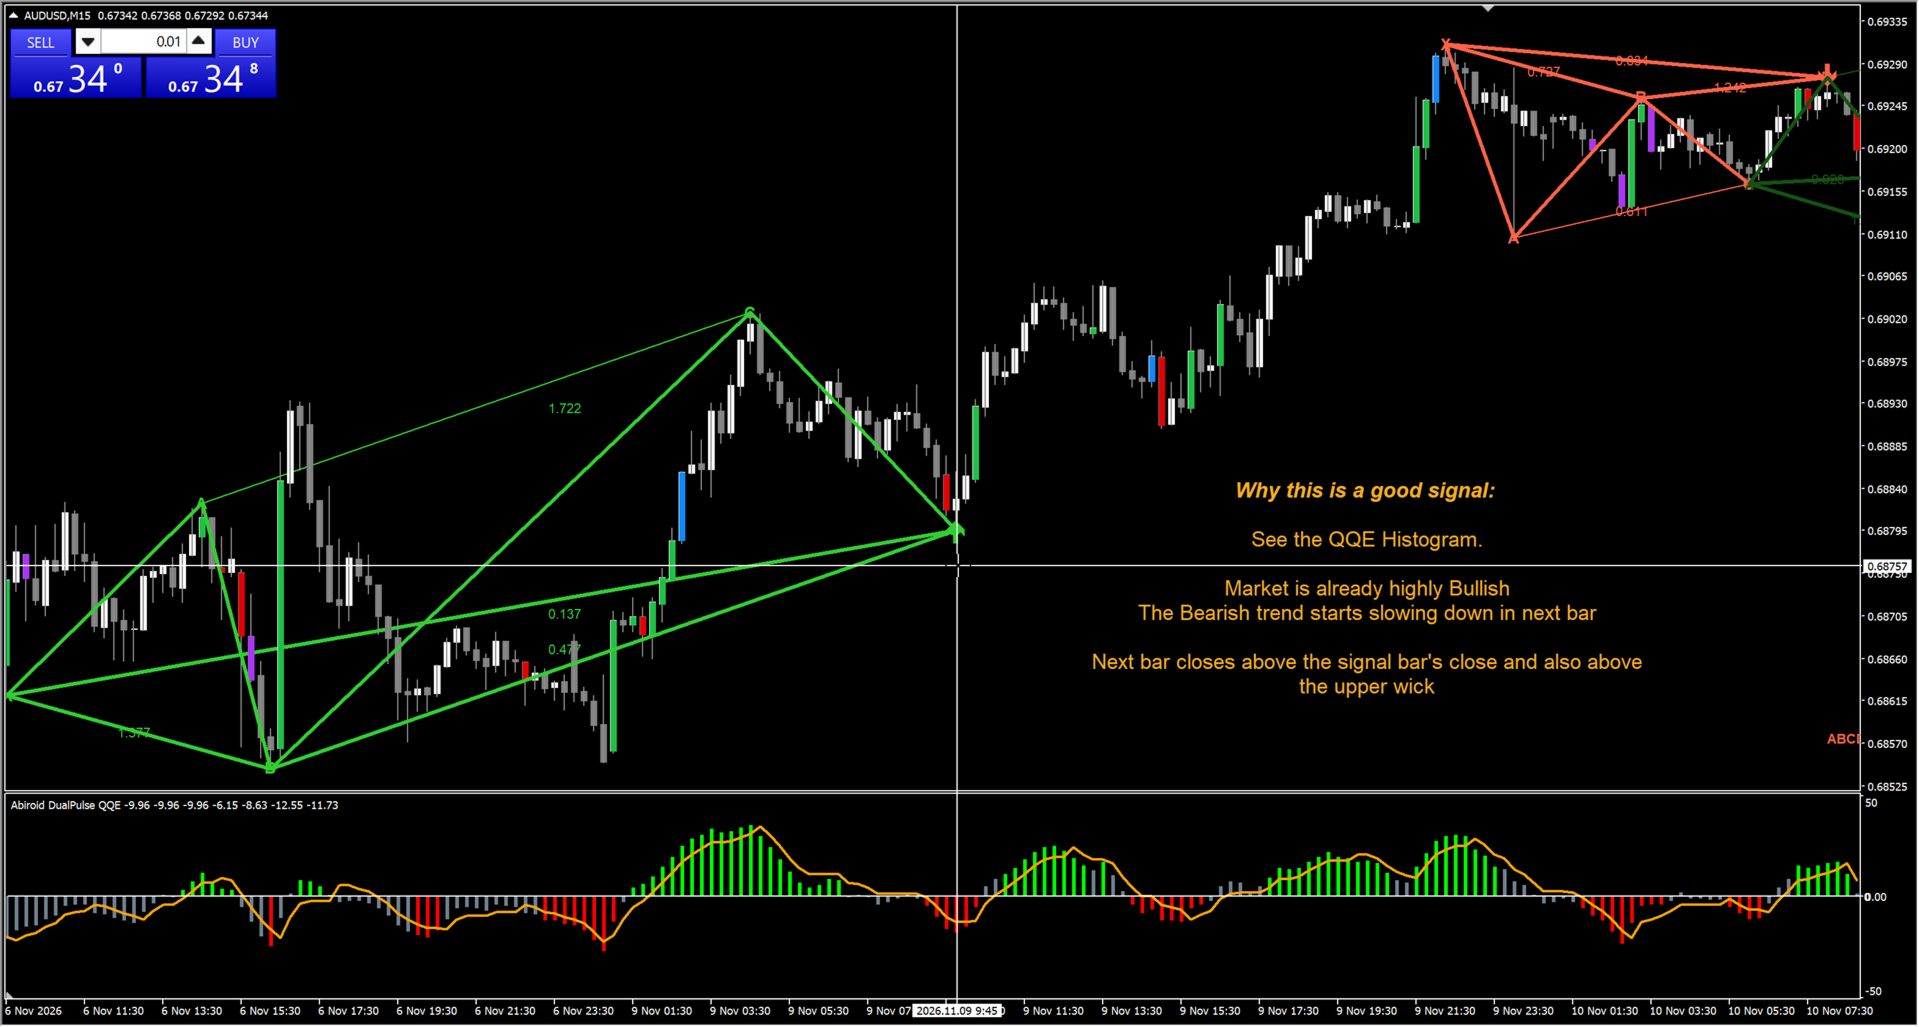
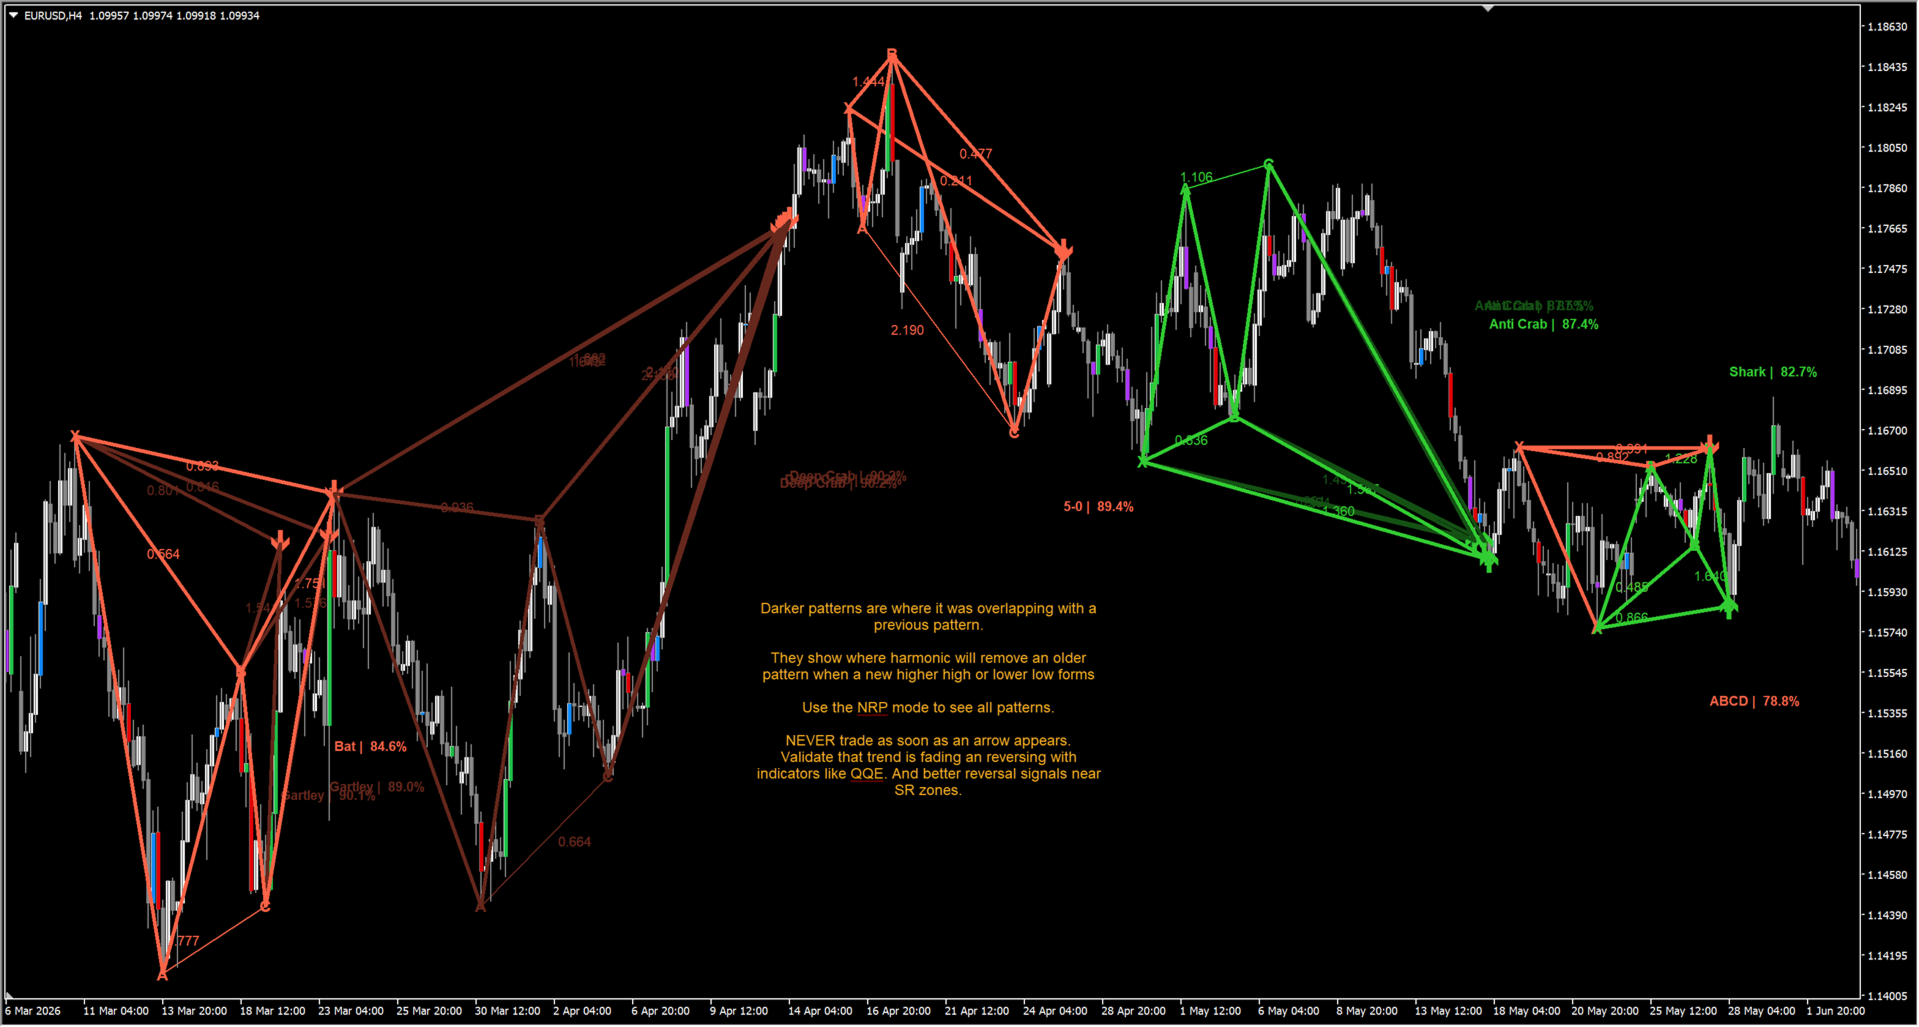
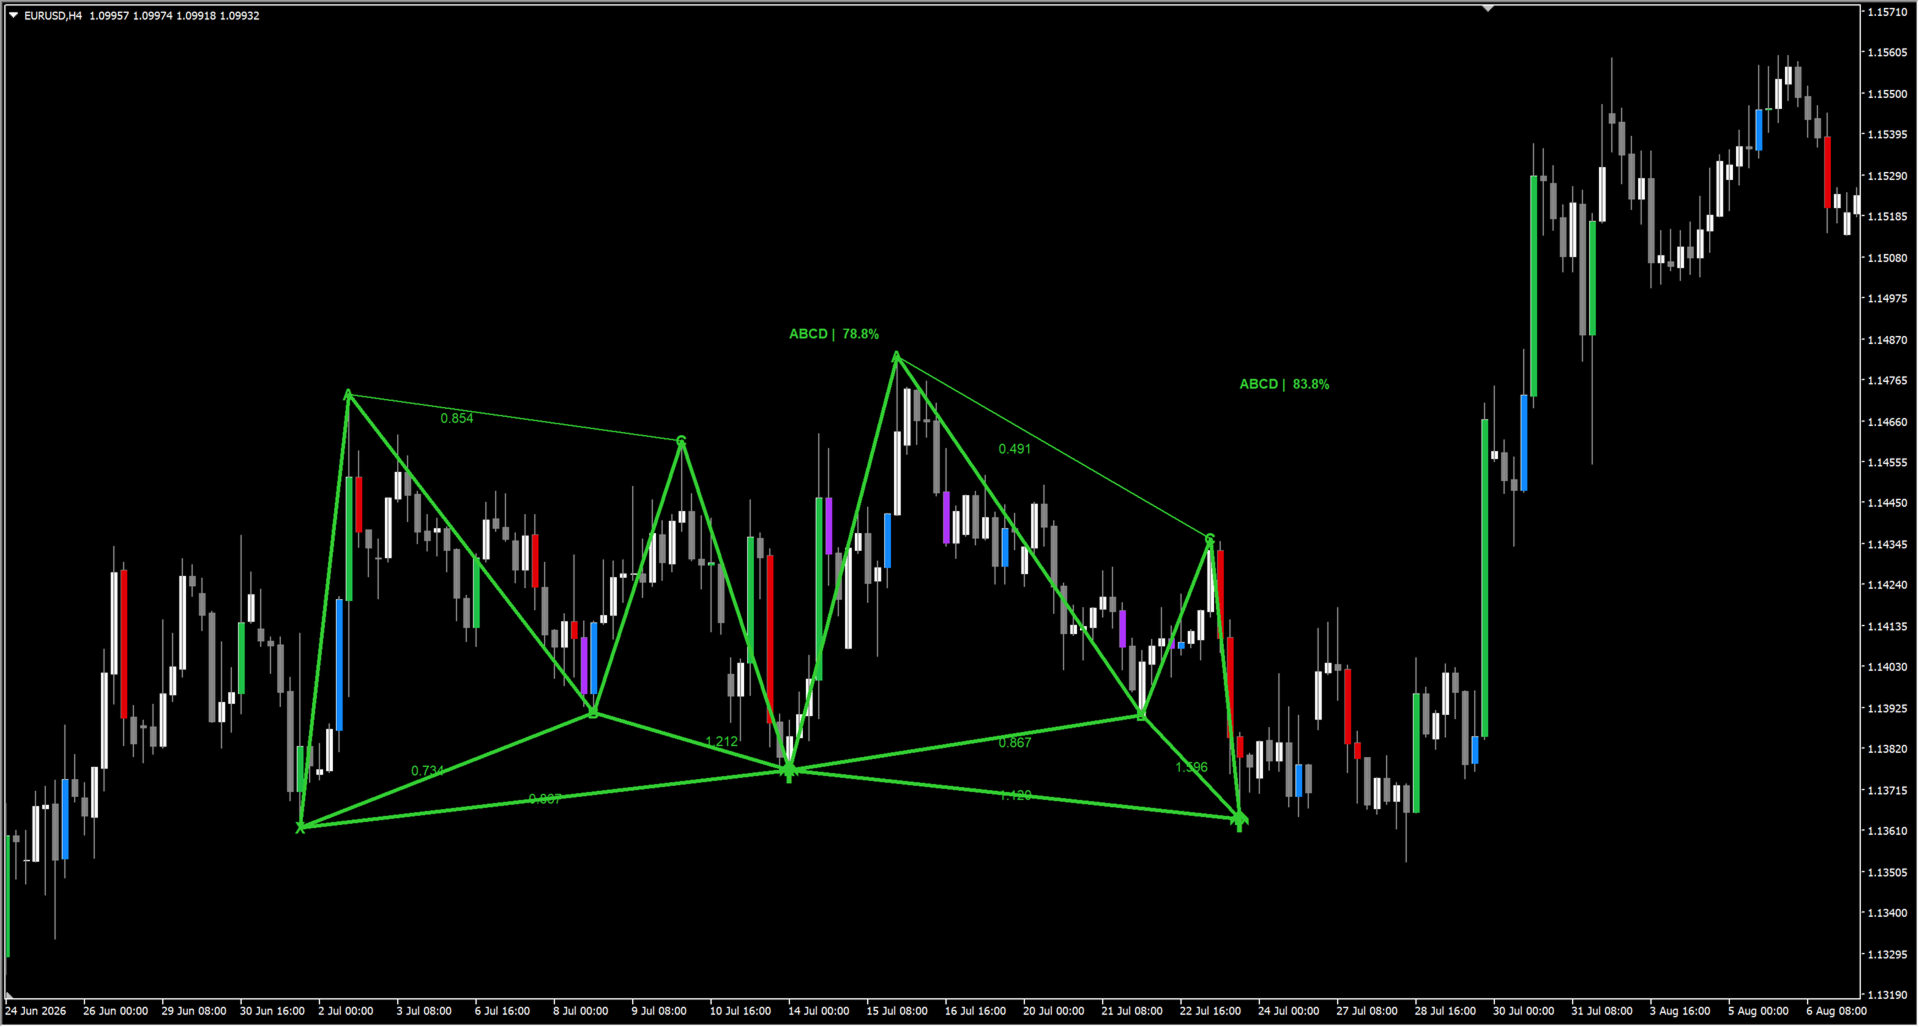
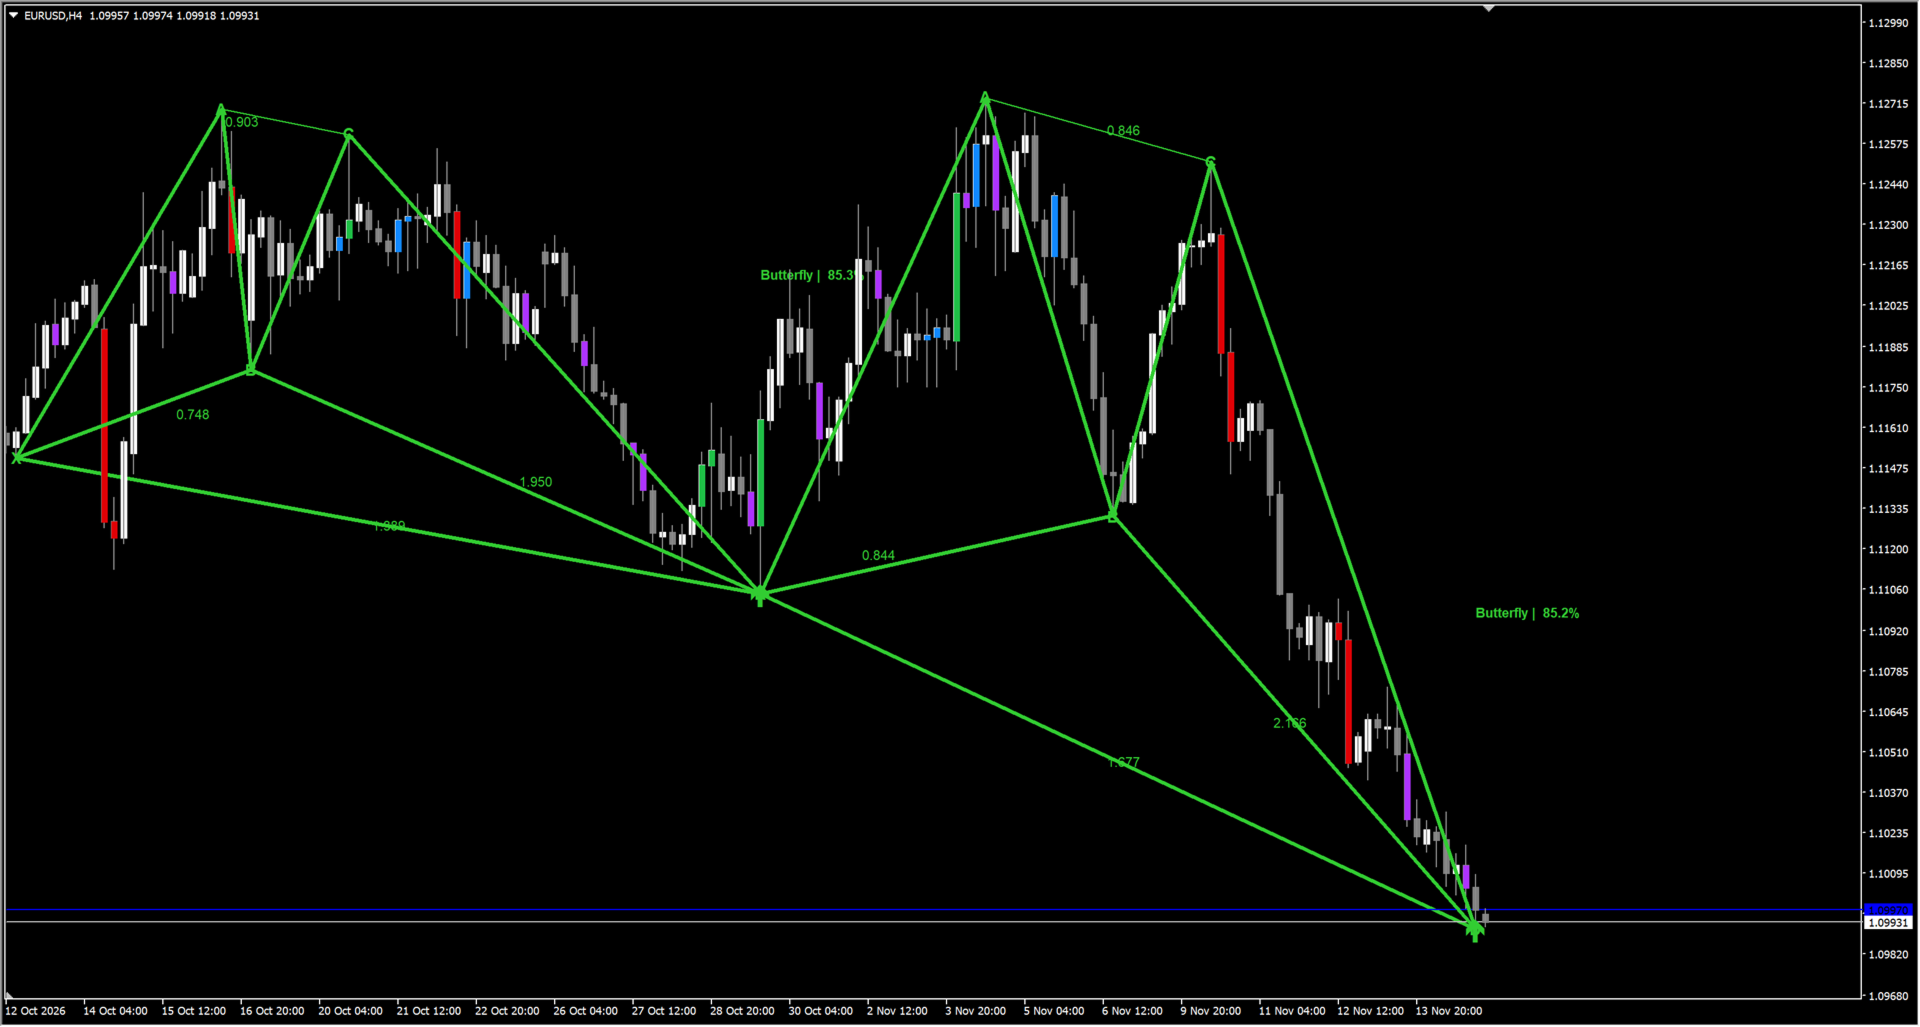
| Solid zig-zag lines through five points | The completed pattern: X, A, B, C, D. Green for bullish (M-shape), red for bearish (W-shape). |
| Thin dotted lines inside the pattern | The measured legs XB, AC and BD. These are the lines the Fibonacci ratios are calculated from. |
| Small numbers on each leg (e.g. 0.618) | The actual Fibonacci ratio of that leg, measured from price. You can compare these to the textbook values yourself. |
| Pattern name and a percentage near point D | The pattern type (Gartley, Bat, etc.) and its Accuracy Score — see section 3. |
| Shaded or outlined rectangle to the right of C | The PRZ (Potential Reversal Zone). This is where point D is expected to land while the pattern is still forming. The label reads "PRZ:" followed by the pattern name(s) that project into this zone. |
| Up/down arrow at point D | A completed pattern's entry marker. Up arrow = bullish reversal, down arrow = bearish reversal. |
| Triangles between the points | Optional shading of the two halves of the pattern (X-A-B and B-C-D). Off by default. |
One important habit: the PRZ rectangle appears before the pattern is complete. It is a projection, not a signal.
Check out the detailed Guide here:
https://www.mql5.com/en/blogs/post/780867