Abiroid Harmonic Patterns MT4
- 지표
-
Abir Pathak
 I create MT4 and MT5 indicators. They are mainly arrows and scanner indicators and also some essential utilities.
I'm hoping they will make your trading easier and make you profitable.
You can join my Telegram channel to keep track of all products I post. - 버전: 1.1
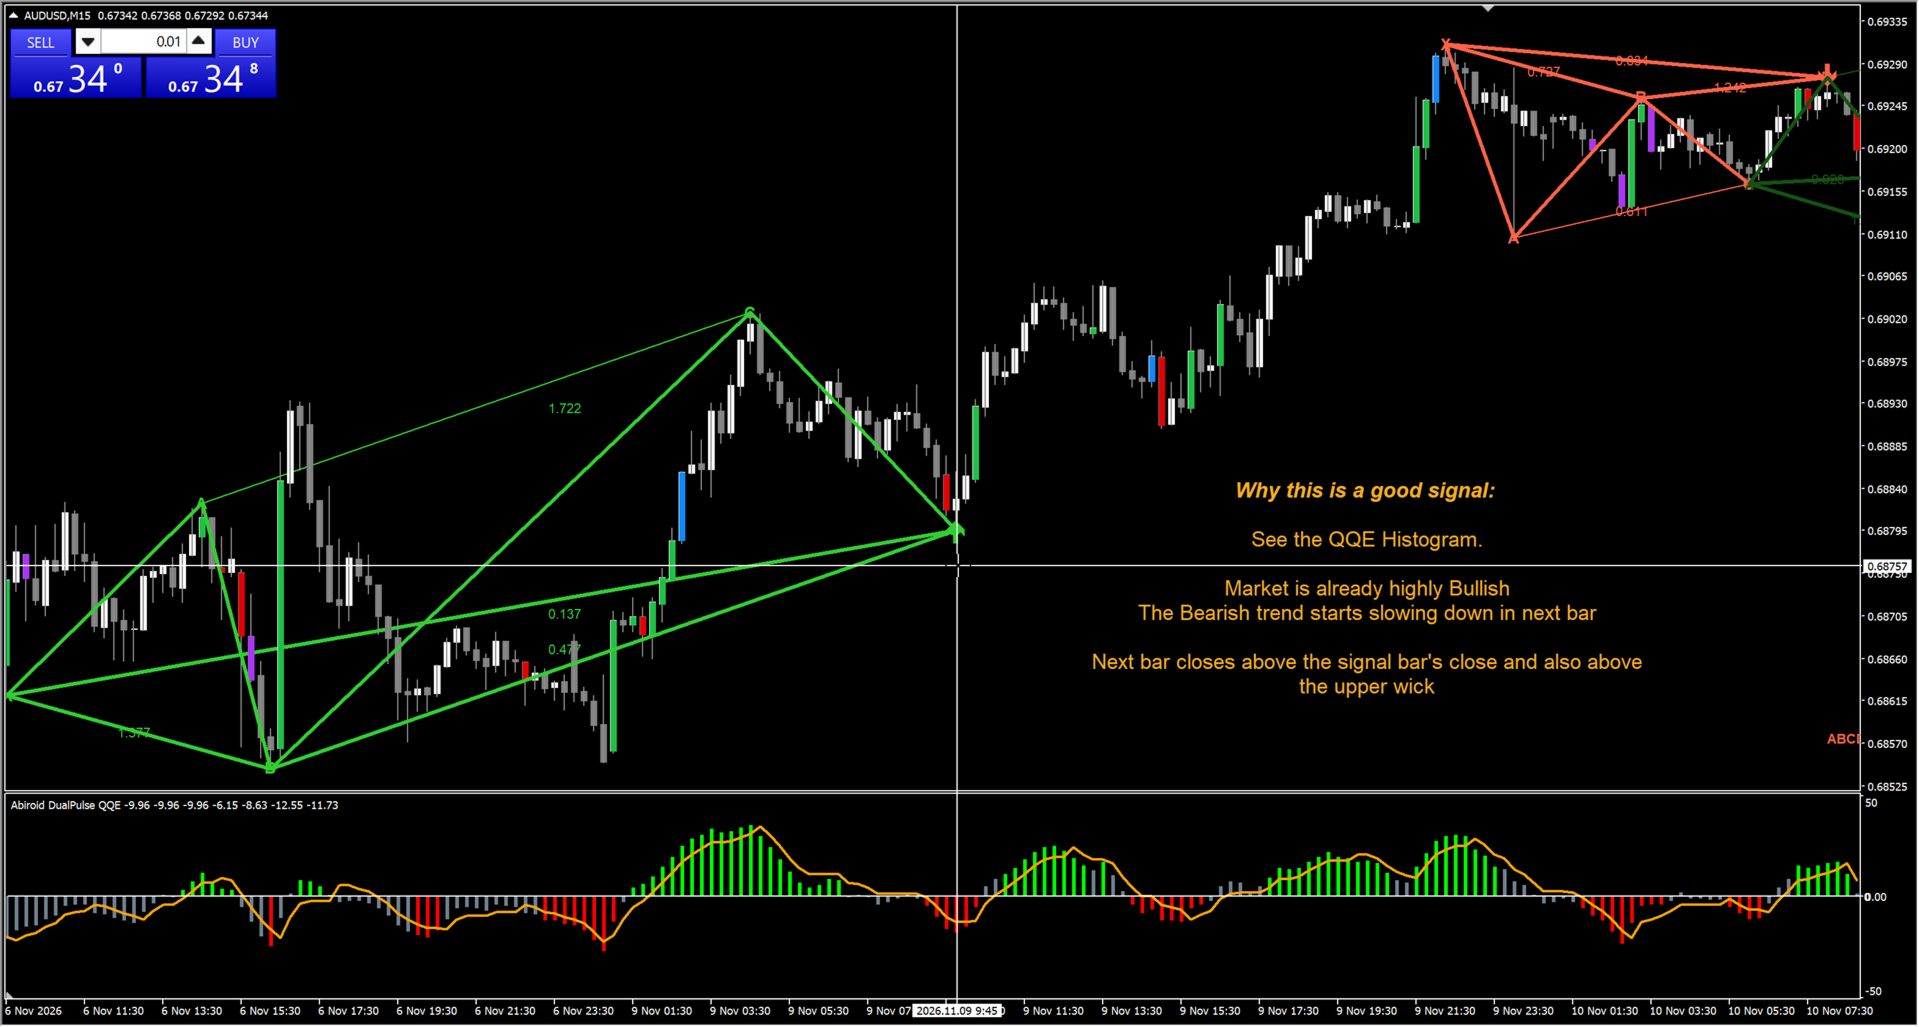
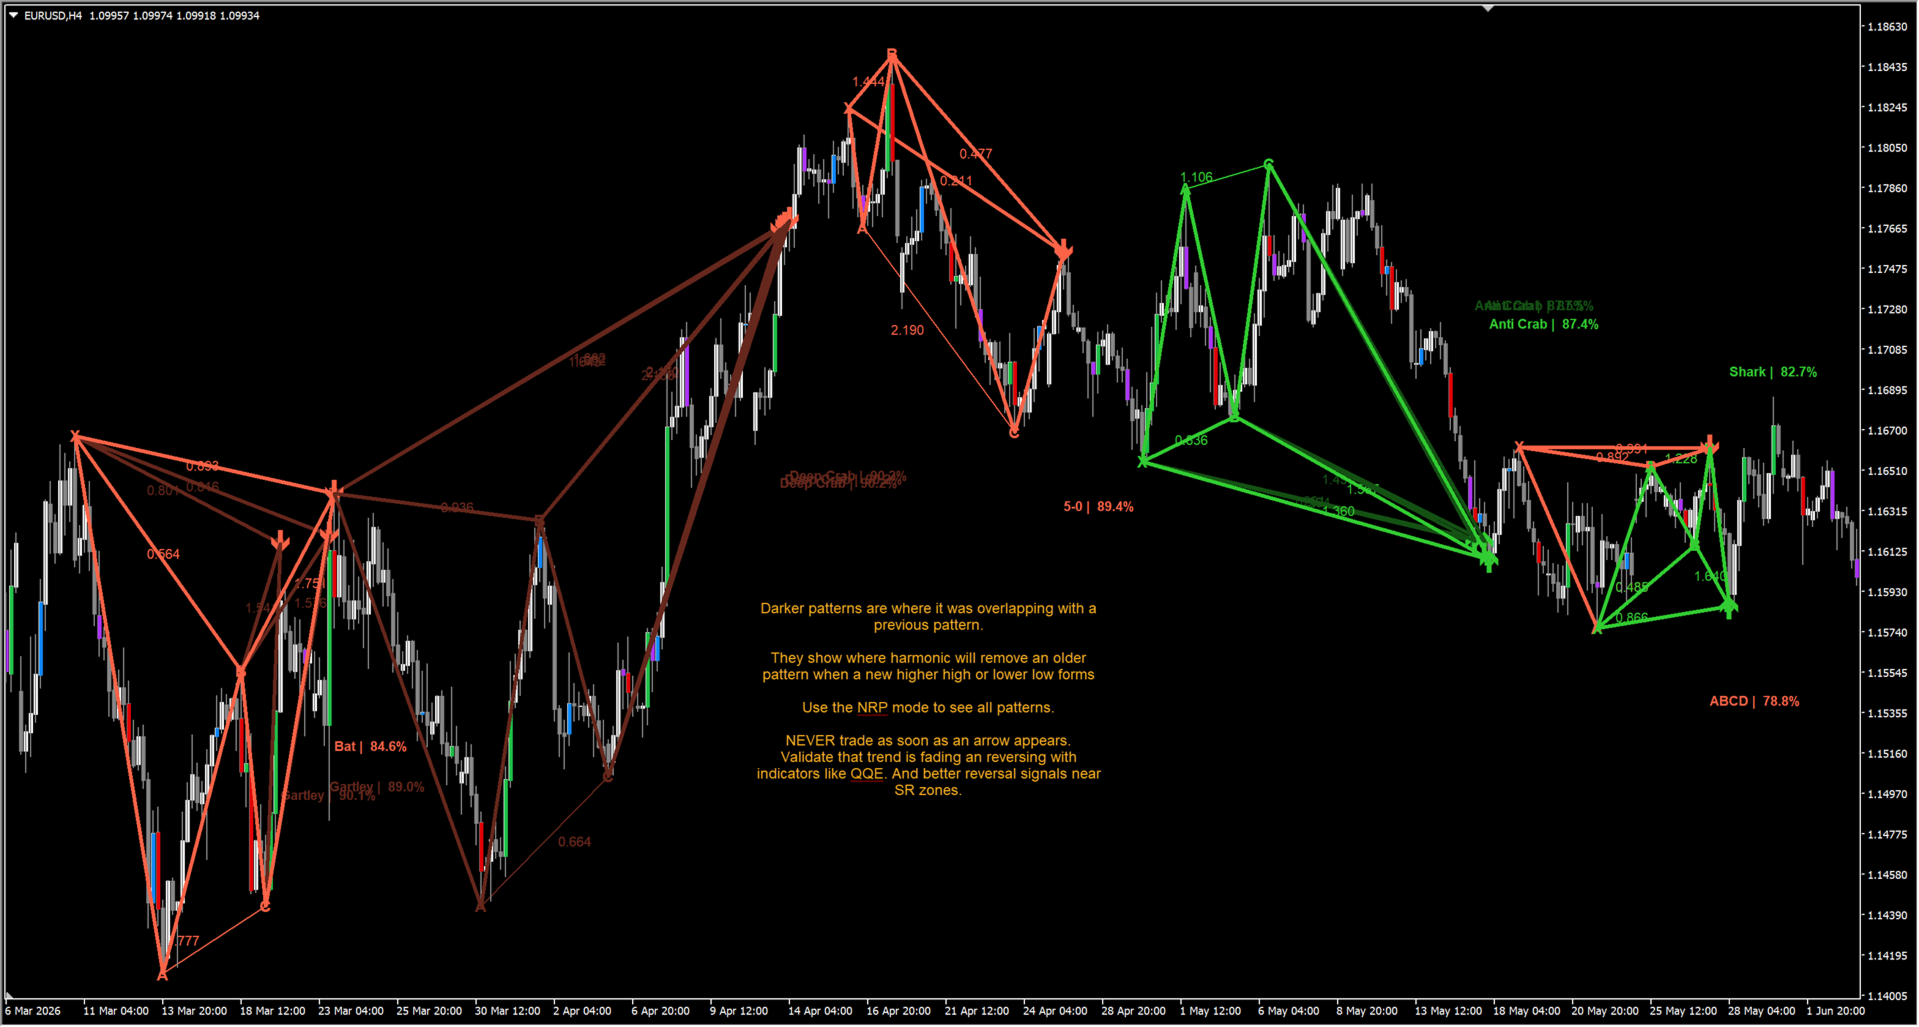
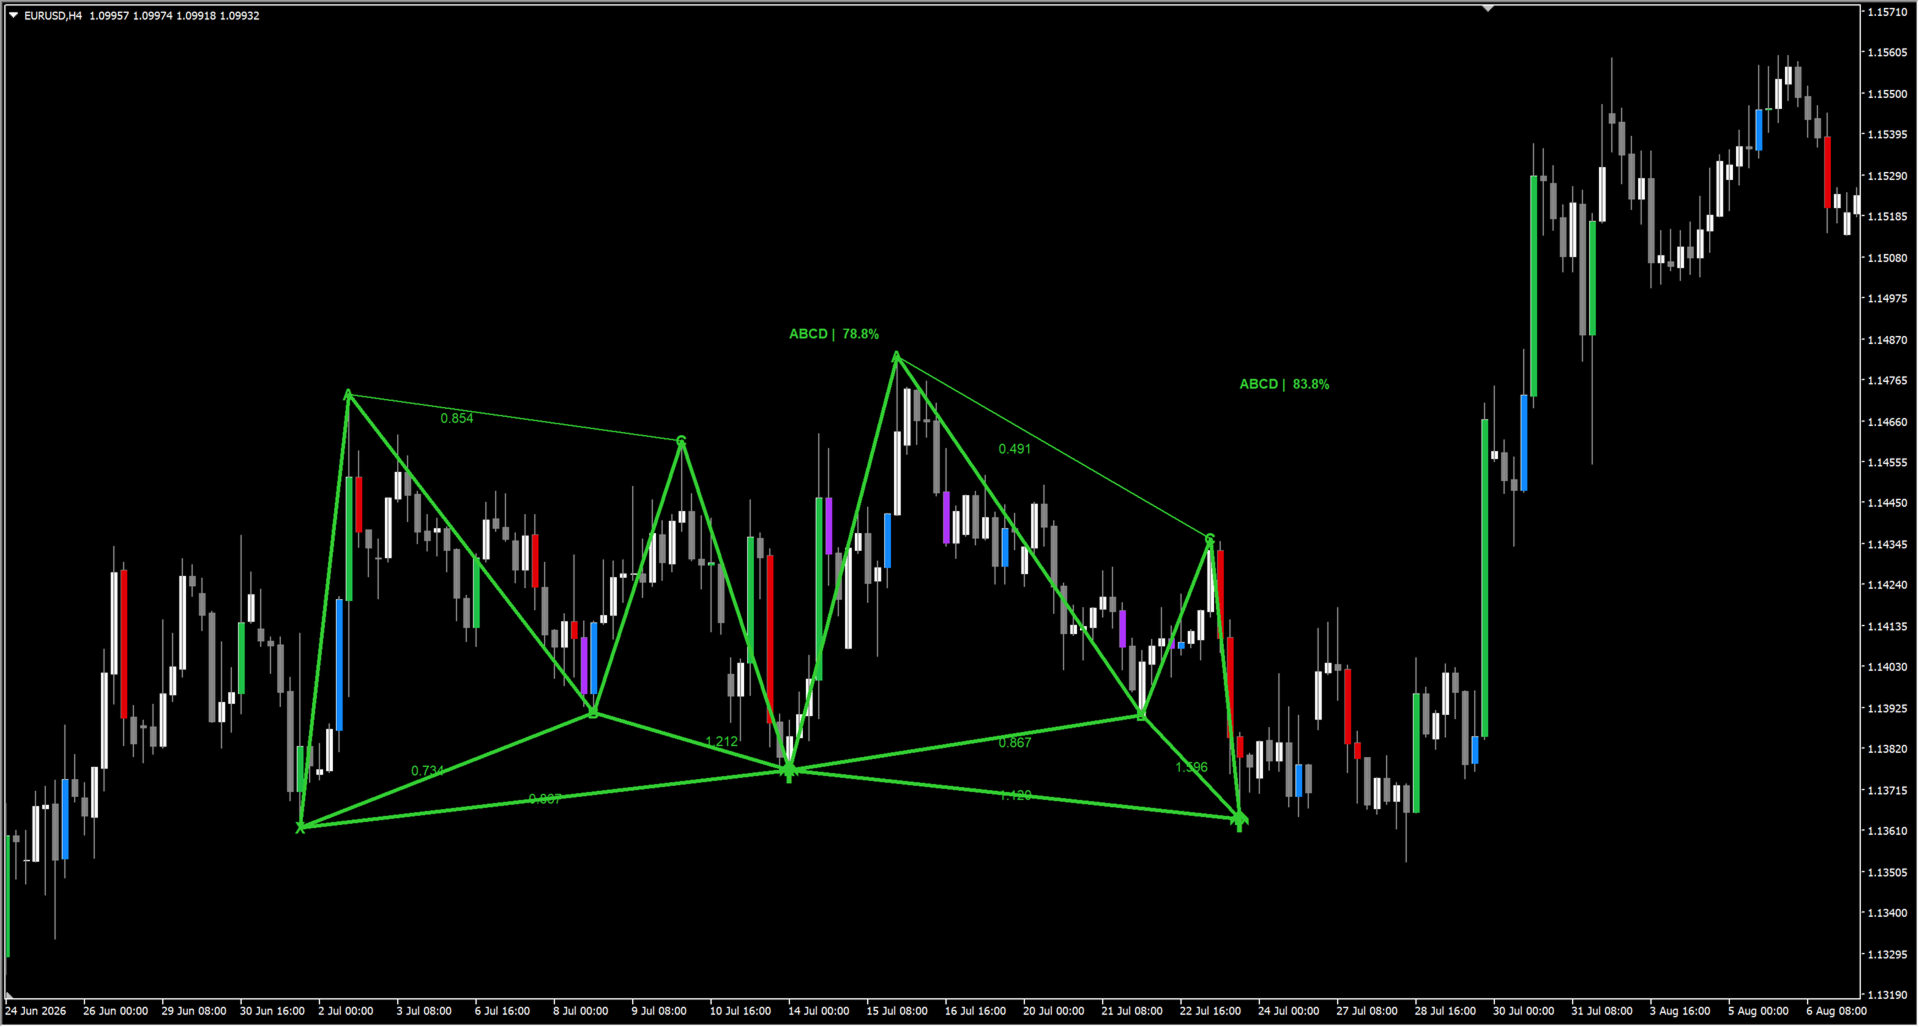
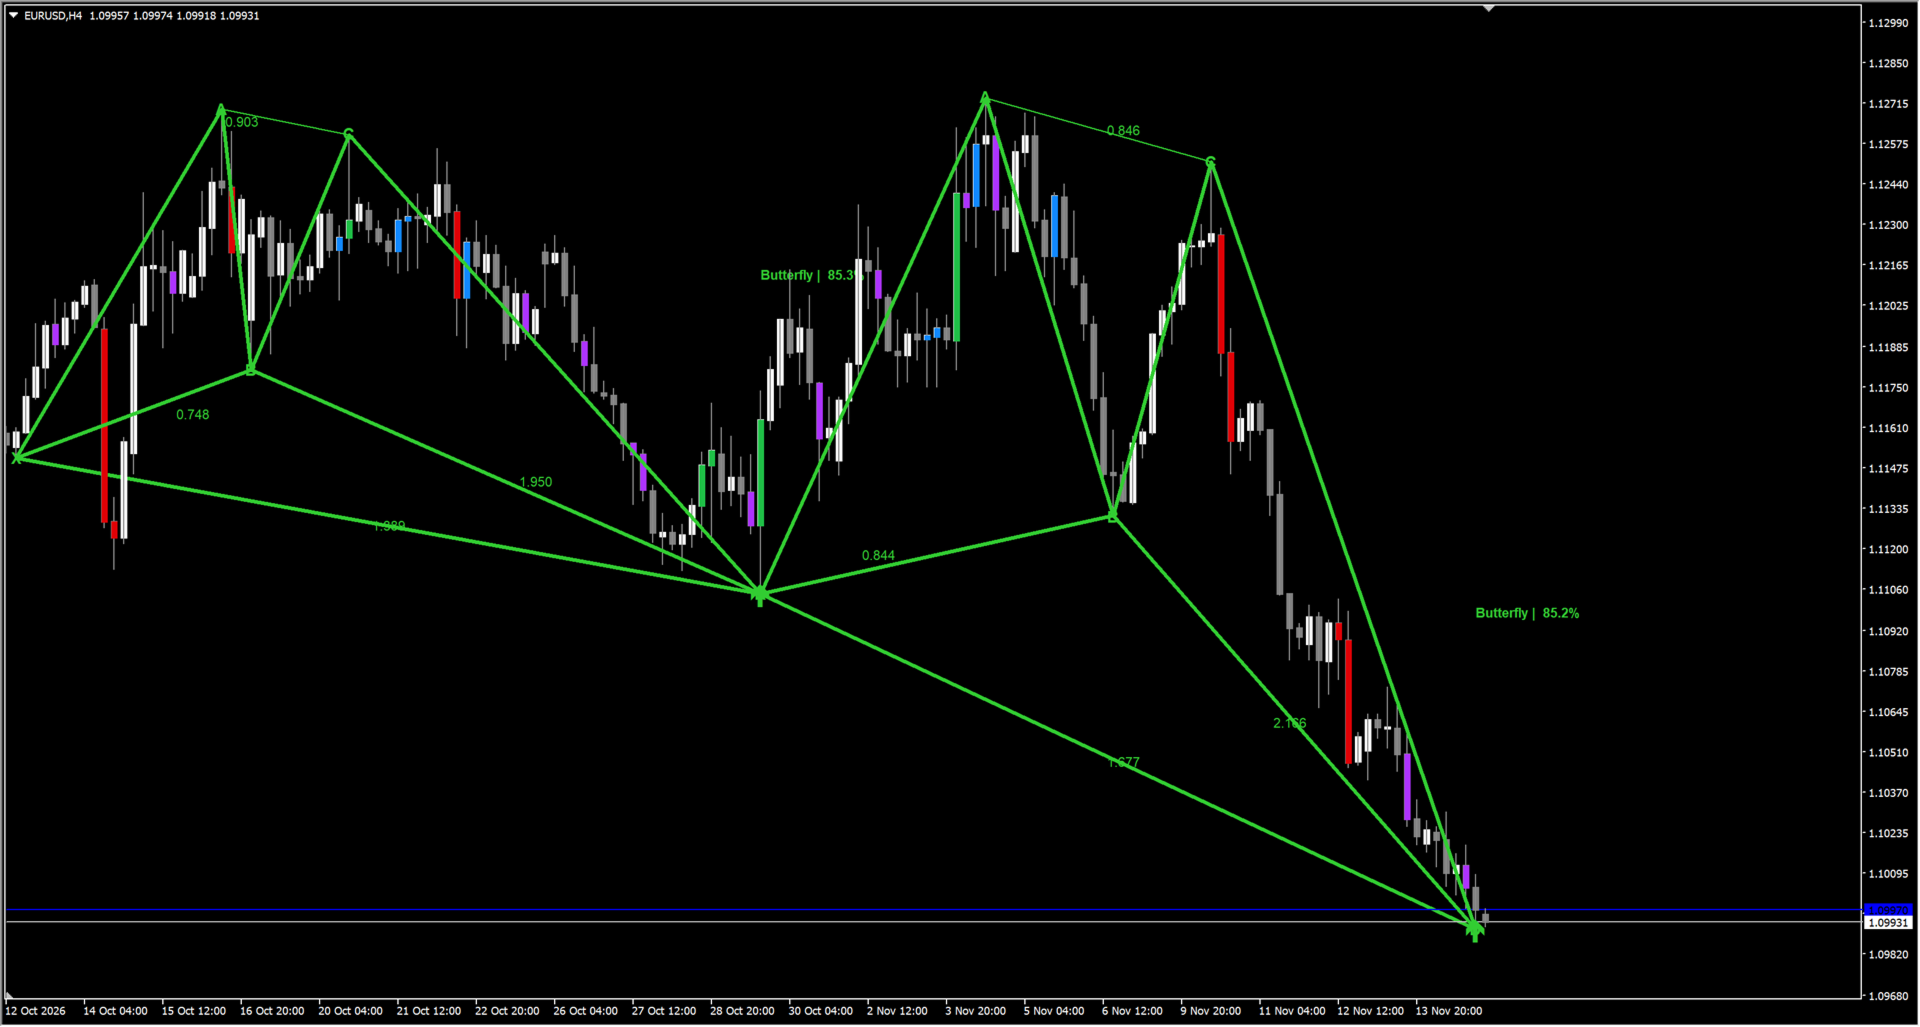
What the Chart Engine Draws
When you attach Abiroid Harmonic Patterns to a chart, you will see:
| On the chart | Meaning |
|---|---|
| Solid zig-zag lines through five points | The completed pattern: X, A, B, C, D. Green for bullish (M-shape), red for bearish (W-shape). |
| Thin dotted lines inside the pattern | The measured legs XB, AC and BD. These are the lines the Fibonacci ratios are calculated from. |
| Small numbers on each leg (e.g. 0.618) | The actual Fibonacci ratio of that leg, measured from price. You can compare these to the textbook values yourself. |
| Pattern name and a percentage near point D | The pattern type (Gartley, Bat, etc.) and its Accuracy Score — see section 3. |
| Shaded or outlined rectangle to the right of C | The PRZ (Potential Reversal Zone). This is where point D is expected to land while the pattern is still forming. The label reads "PRZ:" followed by the pattern name(s) that project into this zone. |
| Up/down arrow at point D | A completed pattern's entry marker. Up arrow = bullish reversal, down arrow = bearish reversal. |
| Triangles between the points | Optional shading of the two halves of the pattern (X-A-B and B-C-D). Off by default. |
One important habit: the PRZ rectangle appears before the pattern is complete. It is a projection, not a signal.
Check out the detailed Guide here:
https://www.mql5.com/en/blogs/post/780867