Session Open Carry

Session Open Carry is built on one idea: the side on which a session opened shows which way to hold a position until the next day. Once a day, at a set minute, the EA compares the last price with the open of the session. Price above the open - it buys. Price below the open - it sells. Price at the open - it stays out. The stop is placed at the extreme of the session, the position is carried overnight and it is closed at a set minute on a later day. The EA tests this idea on every session and does not claim that it holds in every market.

The Idea

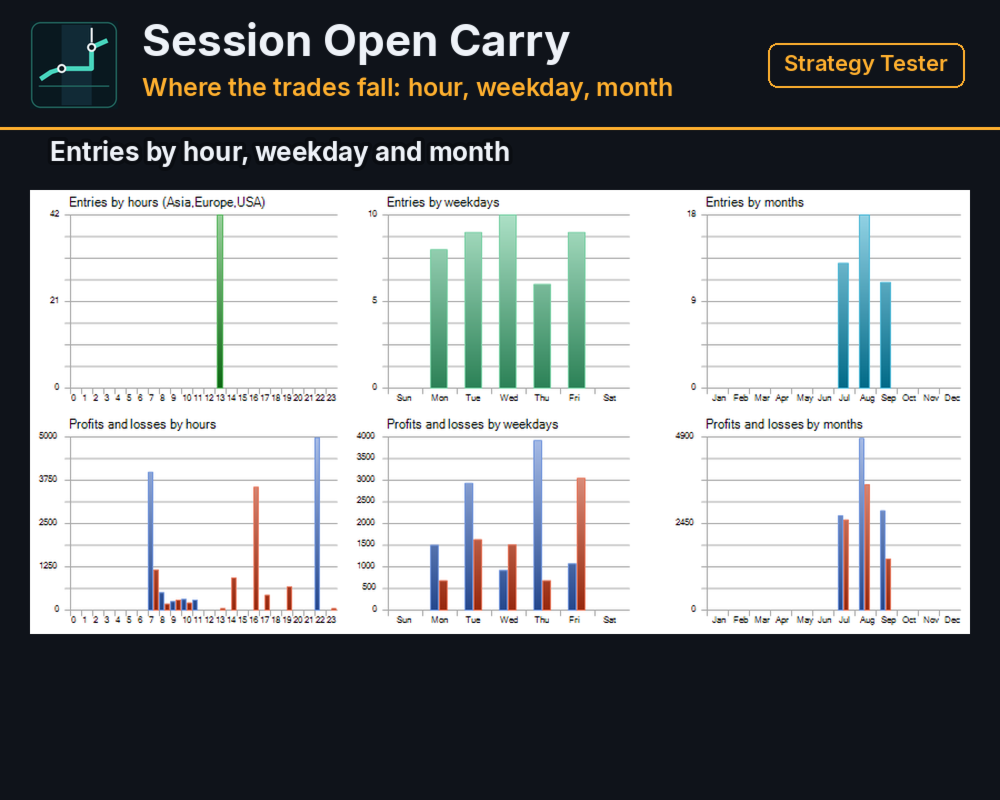
The session is one day on the EA's own clock. Its open is the open of the first minute bar of the day, and its high and low are updated from minute bars as the day goes on. The EA makes at most one entry per day and holds at most one position. It never adds to a position and never doubles a lot. Saturday and Sunday are skipped.

The stop is the low of the session for a long position and the high of the session for a short one. On the next day it moves to the extreme of the new session as that session develops. A position whose stop level is touched is closed at the market.

Three Modes

  • Hold: entry, session stop, exit at the set minute on a later day. This is the default mode and the mode the figures below were made in.
  • Take: Hold plus a partial take-profit. Half of the position is closed when price moves a set number of points in its favour. At the exit minute the position is closed only if its result is negative or lower than it was at the last evening snapshot; otherwise it is carried on.
  • Take and Trail: Take plus a trailing level. The level starts at a set percentage below the entry price for a long position (above it for a short one). After the price has moved a set percentage in favour of the position, the level follows the most favourable price reached so far at a set distance in percent. Reaching the level closes half of the position.

A partial close needs a position of at least two lot steps. With one lot the two partial modes change only the exit rule.

Session Clock

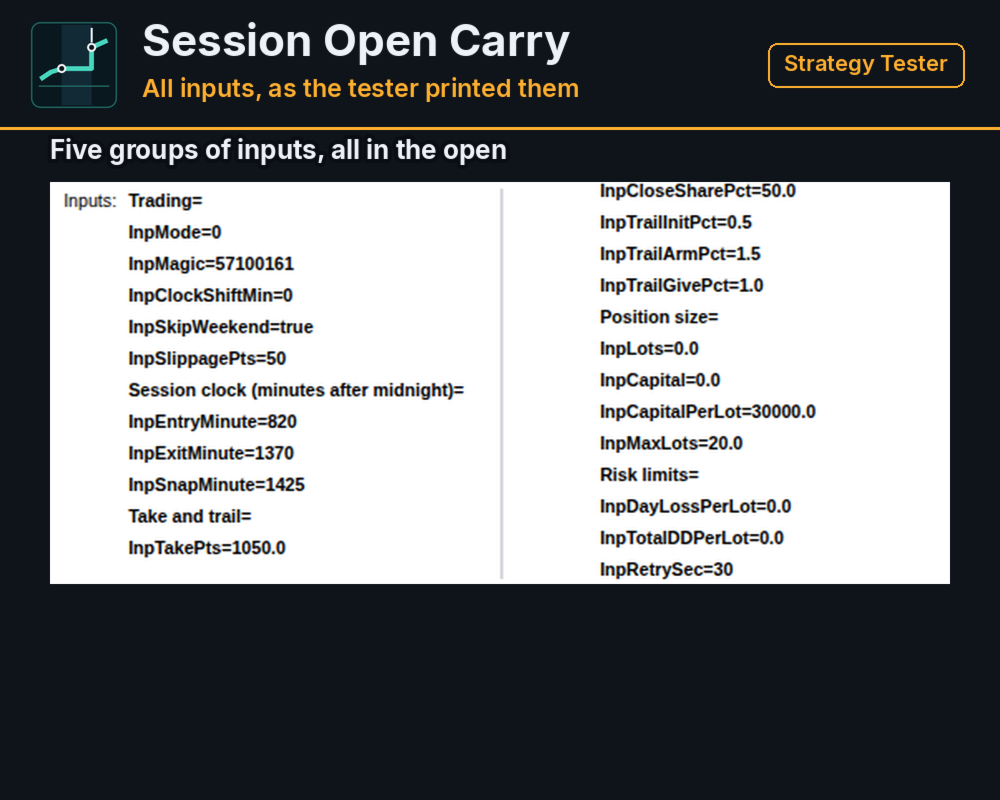
The entry, the exit check and the evening snapshot are set as minutes after midnight on the EA clock: 820 (13:40), 1370 (22:50) and 1425 (23:45) by default. The clock is the server time moved by InpClockShiftMin, so a broker whose day does not start at the session open can still be matched. A position opened on one day is never closed on the same day: the exit check works from the next day on.

Managing A Position

The stop reaches the broker with the order and follows the session extreme afterwards. If the stop cannot be sent because it is too close to the price, the EA places it at the nearest allowed distance and closes the position at the market when price has already passed the level.

  • an entry declined for a temporary reason (requote, price change, timeout, lost connection) is repeated once a second for up to 30 seconds;
  • an exit that was declined is repeated until the position is closed;
  • the EA restores its state after a restart from the open position and from its own records.

Risk Controls

  • The lot is the minimum lot of the symbol by default. A fixed lot or a lot by capital can be set; the lot ceiling is 20 by default.
  • Before each entry the EA checks the free margin and reduces the lot to the part of it that fits. If not even the minimum lot fits, it does not trade that day.
  • A loss limit per lot for one day and a drawdown limit per lot from the peak are available. Both are off by default.
  • Before each request the EA checks the trade mode of the symbol, the trading session, the stop and freeze levels and the volume limits, and does not send a request the broker would reject.
  • No grid, no martingale, no averaging.

Strategy Tester Figures

Read the figures with one fact in mind: in each period two single trades make up almost the whole net result, and with so few trades the result cannot be told apart from chance. The amounts are given below, in the section on what the figures do not show.

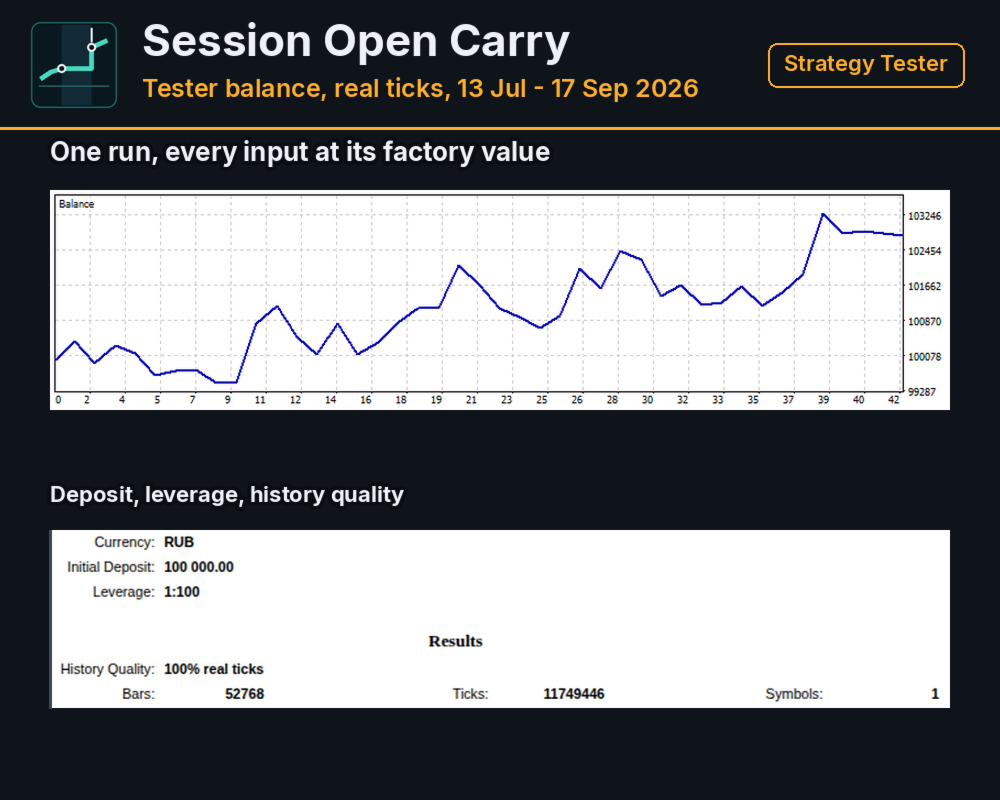
The figures come from the Strategy Tester on the Si futures, 100% real ticks, one lot, starting deposit 100000 RUB, leverage 1:100, mode Hold, every input at the value it ships with. The entry and exit minutes were not searched for on these periods: they were fixed before the periods began. Each period is run three times: with no delay, and with the tester delaying the EA's actions by 300 ms and by 1000 ms. Commission was set to zero in these runs and the slippage of market entries is not modelled, so both costs are left out of every figure below. All amounts are in RUB.

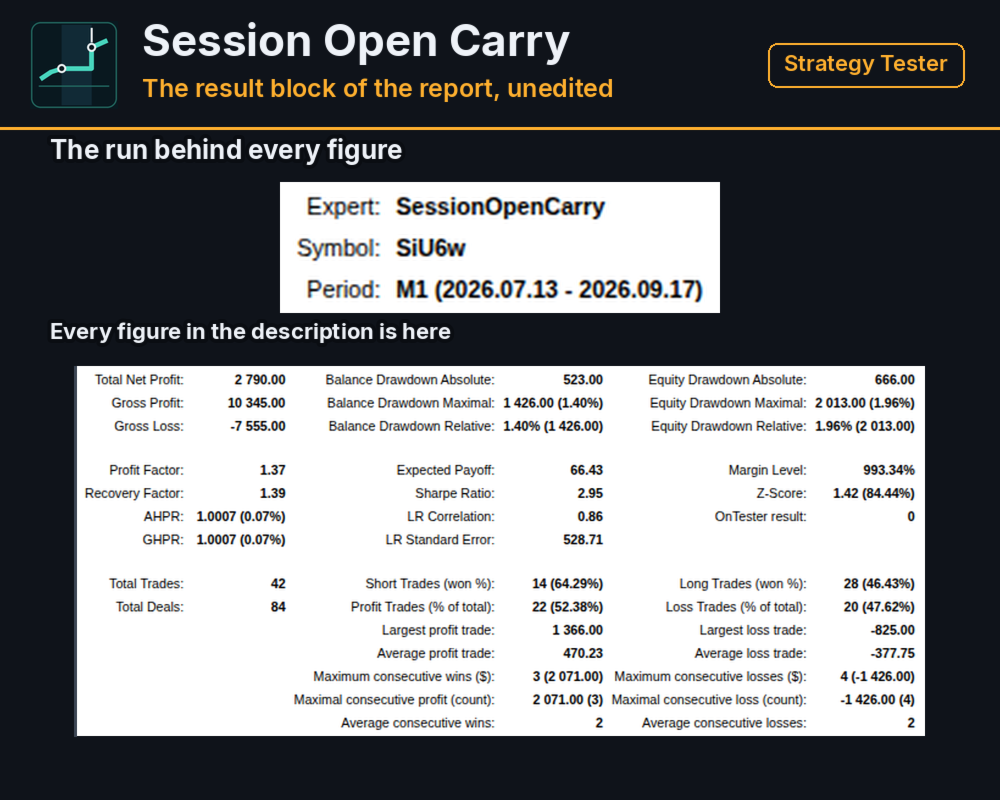
Si-9.26, 2026.07.13 - 2026.09.17, 42 trades, 52.38% of them positive:

  • no delay: net result 2790.00, ratio of gross positive to gross negative 1.37, largest balance drawdown 1426.00 (1.40%), largest equity drawdown 2013.00 (1.96%)
  • 300 ms: net result 2739.00, ratio 1.36, balance drawdown 1436.00 (1.41%), equity drawdown 2030.00 (1.97%)
  • 1000 ms: net result 2693.00, ratio 1.35, balance drawdown 1439.00 (1.41%), equity drawdown 2049.00 (1.99%)

Si-12.26, 2026.09.18 - 2026.10.10, 14 trades, 57.14% of them positive:

  • no delay: net result 2877.00, ratio of gross positive to gross negative 2.60, largest balance drawdown 866.00 (0.84%), largest equity drawdown 1038.00 (1.01%)
  • 300 ms: net result 2860.00, ratio 2.59, balance drawdown 870.00 (0.84%), equity drawdown 1042.00 (1.01%)
  • 1000 ms: net result 2851.00, ratio 2.58, balance drawdown 867.00 (0.84%), equity drawdown 1039.00 (1.01%)

What The Figures Do Not Show

Both periods are short: 42 trades in about ten weeks and 14 trades in about three weeks. They are not a test of the idea over several market regimes, and the second period is too short for its ratio of 2.60 to say anything about the next one.

In each period two single trades, the two with the largest result, make up almost the whole net result. Without them the first period ends at 91.00 with no delay and at -6.00 with the 1000 ms delay, and the second period at 170.00 and 149.00. With so few trades the result cannot be told apart from chance.

The delay in the tester postpones the actions of the EA, such as an exit or a stop move. It does not add slippage to a market entry, and on a live account an entry at the market often fills away from the price at the moment of the signal. There has been no run of this EA on a live or demo account, so the slippage of the entries is not measured and the figures above leave that cost out.

The tester ran on custom symbols built from recorded real ticks of the Si futures, loaded by the author. Your broker's own history, spread, commission and clearing breaks will give different figures. The runs use the minimum lot. A larger lot changes the result and the drawdown in proportion, and the margin of your broker limits the lot you can use.

What It Needs

A futures symbol with regular trading sessions on a netting account. The EA is built for netting: on a hedging account it manages only the first position it finds for its symbol and magic number. The EA was measured on the Si futures of the Moscow Exchange and has no logic that is specific to one symbol, but only Si was measured. It reads minute bars, so the chart timeframe does not matter, and it needs minute history for the current day: the EA rebuilds the session from minute bars when it starts. Keep the terminal connected during the session; after a disconnect the EA continues from the open position.

Settings

Trading: the mode, the magic number, the clock shift, the weekend switch and the allowed slippage in points. Session clock: the entry minute, the exit check minute and the evening snapshot minute. Take and trail: the take distance in points, the share of the position that is closed, and the three percentages of the trailing level. Position size: a fixed lot or a lot by capital, and the lot ceiling. Risk limits: the day loss limit, the drawdown limit and the retry window for a declined entry.

Questions

If something does not work as described, send a private message on mql5.com. Please include your broker, the symbol, the server time shown in the terminal and the settings you use.
Другие продукты этого автора
A liquidity sweep is a bar that pushes past a prior swing high or swing low, where protective stop orders tend to rest, and then closes back on the inner side of that level. The same event is known under several names: a stop hunt, a stop run, a liquidity grab, a false breakout, a failed breakout, or a swing failure. Swept Liquidity Pools marks those levels and those bars on the chart. The indicator tracks liquidity pools - confirmed swing levels that have not yet been taken - and marks the exac
FREE
What Gets Drawn Most level tools mark every swing they can find, and a chart with forty lines answers nothing. This one keeps a level only when price came back to it, and prints the evidence next to the line: the number of touches and the age in days. Lines above current price and lines below it are drawn in different colours, so the map reads at a glance without counting. What Puts A Level On The Chart A swing high is a bar whose high is not lower than its neighbours on both sides, within the n
FREE
Three Anchors On One Chart Most volume weighted average lines restart once a day. This one draws three at the same time: one anchored to the current trading session, one to the day, one to the week. Their spread tells you something a single line cannot. When the session line sits far under the weekly one, the week has been trading higher than today is; when all three sit together, the market has spent the week in one place. Why The Session Anchor Is Not Midnight The session line starts where the
FREE
What It Shows Candle Clock Desk puts four lines on the chart. The first is the time left until the current bar closes. The next three answer a question the clock alone cannot: is this bar unusually busy, or unusually quiet, right now. Bar closes in - the countdown, in minutes and seconds So far - volume this bar has accumulated since it opened Usual here - what this symbol had accumulated by this same minute, in the past Pace - the first divided by the second The Pace Line Pace of 1.00 means the
FREE
Hourly Spread Map answers one question: at which hours does this symbol cost more to enter, and by how much. It reads the spread field that the terminal stores in every closed M1 bar of your own broker feed, sorts those measurements into 24 hours by 7 days of the week, and shows the result as a grid in the indicator sub-window. What It Measures Every closed M1 bar carries one spread measurement. The indicator collects them over the period you choose, groups them by the hour and weekday of the ba
FREE
Trade Risk Desk answers one question at the moment you need it answered: what volume makes this stop cost exactly what you decided to risk. Drag the stop line to where it belongs on the chart and the panel prints the volume, the money behind it, and the margin the position will hold. What It Answers Set the risk as a percent of balance or as a fixed amount in account currency. Put the stop where your idea says it belongs. The panel reads the symbol settings your broker publishes and prints: the
FREE
Swap is the part of the cost that is easy to forget, because it arrives once a day, quietly, and never appears in the spread. Swap Cost Calendar puts it on the chart as a number you can act on. What It Shows The panel reads what the broker publishes for the current symbol and shows four things. The cost of one night for a long position and for a short one, in your account currency or in points. The weekday line, showing how many nightly charges a position carries on each day of the week. The tri
FREE
Range Zones M30 draws zones on your chart where price was pushed back hard on the 30-minute timeframe. It works on any symbol and any chart timeframe, and reads only the prices your terminal already has. It does not use any server, does not send anything out, and does not open or change orders. What It Shows A resistance zone above the market and a support zone below it, as filled rectangles that start at the open of the swing candle that formed them and run to the right. At any moment there is
Signal Confirm watches one symbol and tells you when a trend setup has passed a fixed chain of checks. It works on any symbol and any chart timeframe. It reads only the M1 prices, the prices of the oscillator timeframe (M5 by default) and the daily prices your terminal already has, does not use any server, does not send anything out, and does not open, change or close orders. It shows what happened and when; the decision stays with you. What It Does When the chain below is complete, the indicato
Пул ликвидности - это подтверждённый свинг-максимум или свинг-минимум, который ещё не был взят. Свип ликвидности - это бар, на котором цена торгуется за этим уровнем, а затем закрывается обратно внутри диапазона - то же событие трейдеры также называют охотой за стопами, прогоном стопов, захватом ликвидности или ложным пробоем. Liquidity Sweep Pools MTF отмечает как пулы, так и свипы ликвидности, взятые на них, на текущем графике и на старшем таймфрейме, который вы выберете, и добавляет живую пан
Торговый советник для XAUUSD на MetaTrader 5. Он работает с одной корзиной за раз: открывается в фиксированном наборе серверных часов, добавляет к позиции, пока цена движется против неё, и закрывает всю корзину целиком. На отдельных позициях нет ни стоп-лосса, ни тейк-профита. Как он торгует Один символ, XAUUSD, одна корзина за раз, до 5 ордеров в одном направлении. Входы разрешены только в фиксированные серверные часы, и только когда цена находится у края своего четырёхчасового диапазона. Входы
Sarveon
Vasilii Makarenko
Sarveon - это торговый советник для XAUUSD на MetaTrader 5. Девять независимых стратегий работают бок о бок на одном графике. У каждой свой magic number, свой таймфрейм входа и свой набор расстояний, и ни одна из них никогда не добавляет к позиции, открытой другой. Как он торгует Каждая стратегия сканирует недавние бары своего таймфрейма входа в поисках уровня свинга: максимума, который не превысил ни один более поздний бар, или минимума, который не пробил ни один более поздний бар. Уровень долж
Ridgeline
Vasilii Makarenko
Ridgeline ждёт на ценовых уровнях, которые золото оставило в покое. Он читает дневные бары, отмечает максимумы и минимумы, которые не были пробиты более поздними барами, и размещает там отложенный стоп‑ордер. Семь наборов правил ищут на разных глубинах истории, так что один может ждать уровень, образованный на прошлой неделе, в то время как другой наблюдает за уровнем трёхмесячной давности. Набор, получивший убыток, прекращает работу на два дня, прежде чем разместит что‑нибудь снова. Каждый набо
Sixfold Gold trades XAUUSD on the hourly chart. It looks for the points where the market turned and left an extreme behind, places a pending stop order a little inside that level, and attaches a stop loss and a take profit before the order is ever filled. Six zones do this independently, each with its own search depth, and between them they read three timeframes and four sessions, so the advisor is rarely committed to a single view of the market. A trade that goes wrong is closed by its stop. No
GhBreak
Vasilii Makarenko
GhBreak построен на одной идее о золоте: пробой максимума или минимума свинга, который держался с момента своего формирования, может пройти достаточно далеко, чтобы оплатить неудачные пробои. Советник не гонится за пробоем. Отложенный стоп-ордер уже ждёт на уровне, со своим стопом и целью, до того как цена дойдёт туда. Позиции удерживаются недолго: в отчёте ниже средняя длилась 22 минуты. Уровень свинга Каждый набор правил строит свои собственные бары - H2, H4 или D1 - из часовых данных и ищет п
Одна панель вместо пяти окон Чтение рынка обычно означает держать открытыми несколько окон сразу: скользящую среднюю для направления, осциллятор для импульса, индикатор силы, чтобы отличить тренд от диапазона, и что-то ещё для уровней. Каждый из них отвечает на свой вопрос в своём углу экрана. Signal Compass Desk помещает эти показания в единый блок в углу графика. Одного взгляда достаточно, чтобы понять, в какую сторону склоняется рынок, набирает ли движение импульс или теряет его, есть ли за н
Pivot Stop Gold построен вокруг одной ситуации на золоте: цена разворачивается на свинге и затем проходит через него. Советник не гонится за движением. Отложенный стоп-ордер уже ждёт возле свинга, со своим стопом и целью, прикреплёнными к нему, до того как цена дойдёт туда. Позиции короткие: в отчёте ниже средняя длилась пять минут. Уровень пивота На каждом новом баре своего рабочего таймфрейма советник строит ZigZag по последним 300 барам и берёт два последних пивота, никогда не считая бар, кот
Tessera builds a footprint (cluster) chart from the trade ticks that your MetaTrader 5 terminal already receives from your broker. Prices, volumes and sides come from your own data feed; the indicator does not use any external server, does not send anything out and does not read or store your account details. What It Shows Buy and sell volume inside each bar, price by price, with numbers when they fit. Delta of the bar (the difference between buy and sell volume), cumulative delta and a delta st
What You See On The Chart Swing Percentile Desk places one table on one chart. Each row is a symbol from your watchlist and each column is a pullback size. A cell tells you what share of that symbol's earlier moves the current move has already outdone. A low number means a young move; a high number means the move is stretched compared with the history of the same symbol. Every symbol is compared only with itself, so a quiet pair and a restless pair are read on the same scale and no manual measur
Фильтр:
Нет отзывов
Ответ на отзыв