• 概述
  • 评论
  • 评论 (25)
  • 新特性

MetaCOT 2 Williams Commercial Index COT MT4

MetaCOT 2 is a set of indicators and specialized utilities for the analysis of the U.S. Commodity Futures Trading Commission reports. Thanks to the reports issued by the Commission, it is possible to analyze the size and direction of the positions of the major market participants, which brings the long-term price prediction accuracy to a new higher-quality level, inaccessible to most traders.

These indicators, related to the fundamental analysis, can also be used as an effective long-term filter when entering a medium-term position. For this, they should be combined with a classic price analysis.

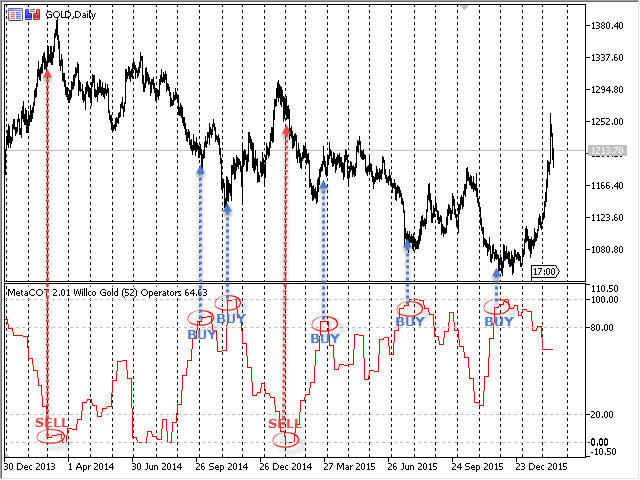
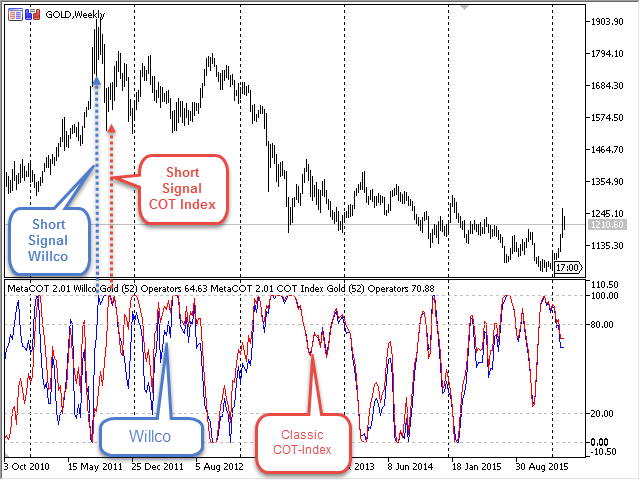
Williams Commercial Index (Willco) developed by Larry Williams is the most advanced version of the standard COT Index. Unlike the latter, Willco compares extreme values ​​of participant groups to cumulative open interest. Thus, Willco is a standard COT Index weighted relative to the entire market. Like the latter, it is an oscillator and changes its value from zero to one hundred percent. The values of the indicator from 0% to 20% and from 80% to 100% point at the moments of the extreme overbought and oversold state market, signaling the frequent reversal of the price after reaching these levels. The data on net positions of traders is used as the basis of the calculation (see the MetaCOT 2 Netto Positions indicator).

Find out more details on the usage methods of this indicator in the book by Larry Williams: Trade Stocks and Commodities with the Insiders: Secrets of the COT Report", and also in the article Meta COT Project - New Horizons for CFTC Report Analysis in MetaTrader 4.

Below are the indicator parameters and their description:

  • Source of Report - COT report type. There are two types of report: 'Futures Only' and 'Futures And Options';
  • Group of Traders - Group of COT report participants. Includes the groups listed above;
  • Release Day - set the day to refresh the indicator. At the default value, 'Release by Friday', the indicator updates its values on Friday (day of data release). At the value 'Release by Thuesday' - on Tuesday (day of data receipt).
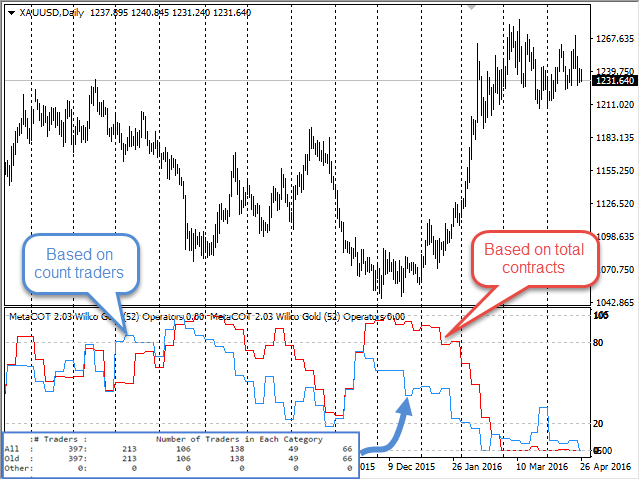
  • DataType - select data to plot the indicator. At the default value, 'Contracts of Traders', the indicator calculates its values based on the number of contracts, at the value 'Number of Traders' - based on the number of traders.
  • Subgroup of Traders - Subgroup of the participants. Divided into All, Old and Other;
  • Period of COT Index - period of COT Index calculation. Recommended values: 25, 52 and 156 weeks;
  • Auto Detect Report Name - if true, the indicator automatically downloads the report, corresponding to the market symbol it is running on. If no report corresponding to the current symbol could be identified, then the default report is downloaded, that is specified in the Report Name parameter;
  • Report Name - name of the report to download if the Auto Detect Report Name parameter is set to false. The name of one of the MetaCOT database files without its extension must be specified as the report name;
  • Mirror Mode - mirror mode of the indicator. If true, the indicator maximums become minimums, and minimums become maximums.

This indicator must be combined with the other indicators of the MetaCOT series, in that case, a higher degree of accuracy in conducting fundamental and technical market analysis is achieved.

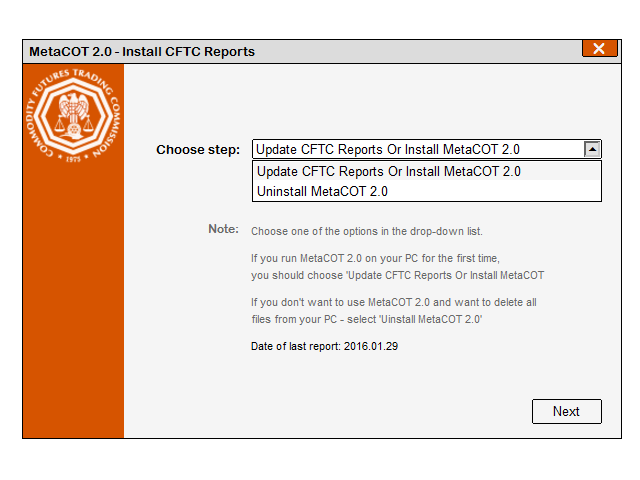
The indicator operation requires the CFTC reports to be downloaded and installed on your computer, which can be done with a special report installation utility MetaCOT 2 Install CFTC Reports MT4.

More details on the description of the indicator settings can be found in the blog "MetaCOT 2: Settings and Possibility".

推荐产品
MetaCOT 2 COT Index MT4
Vasiliy Sokolov
3 (2)
MetaCOT 2 is a set of indicators and specialized utilities for the analysis of the U.S. Commodity Futures Trading Commission reports. Thanks to the reports issued by the Commission, it is possible to analyze the size and direction of the positions of the major market participants, which brings the long-term price prediction accuracy to a new higher-quality level, inaccessible to most traders. These indicators, related to the fundamental analysis, can also be used as an effective long-term filter
30 USD
Forex Gump
Andrey Kozak
2.83 (6)
Forex Gump is a fully finished semi-automatic trading system. In the form of arrows, signals are displayed on the screen for opening and closing deals. All you need is to follow the instructions of the indicator. When the indicator shows a blue arrow, you need to open a buy order. When the indicator shows a red arrow, you need to open a sell order. Close orders when the indicator draws a yellow cross. In order to get the most effective result, we recommend using the timeframes H1, H4, D1. There
147 USD
Master scalping M1
Nataliia Marchuk
Master Scalping M1 is an innovative indicator that uses an algorithm to quickly and accurately determine the trend.The indicator calculates the time of opening and closing positions, the indicator's algorithms allow you to find the ideal moments to enter a deal (buy or sell an asset), which increase the success of transactions for most traders. Benefits of the indicator: Easy to assemble, does not overload the chart with unnecessary information. Can be used as a filter for any strategy. Works on
30 USD
GeoWprPro
Georgij Komarov
WPR by Profile, or WPR for Professionals Geo_WprPro is one of the well-known currency profile indicators. It simultaneously displays two WPR indicators with different parameters in the matrix form on all timeframes of multiple currency pairs forming the currency profile . As follows from the description, " WPR is a leading indicator that often goes ahead of the price chart. The oscillator frequently reaches extreme values before the price reversal as if anticipating that event: it almost always
30 USD
Timing indicator
Somaia Elsayed Ibrahim Elkady
Timing is a mt4 (MetaTrader 4) indicator and it can be used with any forex trading systems / strategies for additional confirmation of trading entries or exits. The MBFX Timing indicator is a part of the well-known forex “MOSTAFA BELKHAYATE” system. In fact, MBFX Timing indicator could be compared to a classic stochastic oscillator. It works on a similar principle. How to trade with the MBFX Timing Indicator? Look for BUY opportunities when: MBFX Timing indicator reaches the oversold zone (low
50 USD
The Th3Eng PipFinite indicator is based on a very excellent analysis of the right trend direction with perfect custom algorithms. It show the true direction and the best point to start trading. With StopLoss point and Three Take Profit points. Also it show the right pivot of the price and small points to order to replace the dynamic support and resistance channel, Which surrounds the price. And Finally it draws a very helpful Box on the left side on the chart includes (take profits and Stop loss
89 USD
Infinity Trend Pro
Yaroslav Varankin
1 (1)
This is a trend indicator without redrawing Developed instead of the binary options strategy (by the color of the Martingale candlestick) Also works well in forex trading When to open trades (binary options) A signal will appear in the place with a candle signaling the current candle It is recommended to open a deal for one candle of the current timeframe M1 and M5 When a blue dot appears, open a deal up When a red dot appears, open a trade down. How to open trades on Forex. When a signal is rec
1 000 USD
TWO PAIRS SQUARE HEDGE METER INDICATOR Try this brilliant 2 pairs square indicator It draws a square wave of the relation between your two inputs symbols when square wave indicates -1 then it is very great opportunity to SELL pair1 and BUY Pair2 when square wave indicates +1 then it is very great opportunity to BUY pair1 and SELL Pair2 the inputs are : 2 pairs of symbols         then index value : i use 20 for M30 charts ( you can try other values : 40/50 for M15 , : 30 for M30 , : 10 for H1 ,
10 USD
MetaCOT 2 is a set of indicators and specialized utilities for the analysis of the U.S. Commodity Futures Trading Commission reports. Thanks to the reports issued by the Commission, it is possible to analyze the size and direction of the positions of the major market participants, which brings the long-term price prediction accuracy to a new higher-quality level, inaccessible to most traders. The indicator of the net positions of the market participants displays the difference between the long a
30 USD
Trend Monitor
Pavel Zamoshnikov
4.2 (5)
The indicator generates early signals basing on ADX reading data combined with elements of price patterns. Works on all symbols and timeframes. The indicator does not redraw its signals. You see the same things on history and in real time. For better visual perception signals are displayed as arrows (in order not to overload the chart). Features Easy to use. Filter configuration only requires selection of sensitivity in the " Sensitivity of the indicator " input. Signals can be filtered usin
30 USD
Trade with Gann on your side!! MASTER CIRCLE 360 CIRCLE CHART, originally created by Gann admitted that this is “The Mother of all charts”. It is one of the last studies that this great trader left for us. The numeric tab le is apparently quite simple like all the tables and is based on square numbers, the SQUARE OF 12 and is by evolution, one of the most important square numbers. Here we can find CYCLE, PRICE AND TIME thanks to angles and grades, to show past and future support and resistance.
149.99 USD
The indicator displays the data of the Stochastic oscillator from a higher timeframe on the chart. The main and signal lines are displayed in a separate window. The stepped response is not smoothed. The indicator is useful for practicing "manual" forex trading strategies, which use the data from several screens with different timeframes of a single symbol. The indicator uses the settings that are identical to the standard ones, and a drop-down list for selecting the timeframe. Indicator Parame
30 USD
Noize Absorption Index - is the manual trading system that measures the difference of pressure between bears forces and bulls forces. Green line - is a noize free index that showing curent situation. Zero value of index shows totally choppy/flat market.Values above zero level shows how powerfull bullish wave is and values below zero measures bearish forces.Up arrow appears on bearish market when it's ready to reverse, dn arrow appears on weak bullish market, as a result of reverse expectation. S
199 USD
ZhiBiCCI MT4
Qiuyang Zheng
5 (1)
【ZhiBiCCI】指标适合所有的周期使用,也适合所有的市场品种。 【ZhiBiCCI】绿色实线是逆转看涨背离。绿色虚线是经典的看涨背离。 【ZhiBiCCI】向红色实线是反向看跌背离。红色虚线是古典看跌背离。 【ZhiBiCCI】可以在参数里面设置(Alert、Send mail、Send notification),设置为(true)就可以发送即时信号到警报窗口、电子邮件、即时消息。 参数设置说明: 【displayAlert】:这是警报开关,设置成true,如果出现箭头就会自动警报提示;设置成false,则不会警报提示。 【sendmail_NO_OFF】:这是发送邮件的开关,设置成true,如果出现箭头就会发送邮件到你在MT4设置好的邮箱里面;设置成false,则不会发邮件。 【sendnotification_NO_OFF】:这是发送即时消息的开关,设置成true,如果出现箭头就会发送消息到你的移动设备;设置成false,则不会发消息。 更多好用的指标网址: https://www.mql5.com/en/users/zhengqiuyang/seller
58 USD
MasterArrow
Pavel Krysanov
5 (1)
Correct market entries and exits are essential for any Forex trader. MasterArrow indicator addresses this issue. It has no redundant elements and draws only buy/sell arrows. The up arrow is a BUY signal, while the down arrow is a SELL one. The indicator is simple to configure. Change the Strength parameter to configure the signals frequency. The product is based on standard indicators (MA, RSI, ATR, etc.). But it also features the custom algorithm allowing to combine them into a single tool and
39 USD
Tunafish EA MT4
Ismaele Daniele Lodetti
Tunafish EA is the most efficient EA on my profile. I spent a lot of time and effort to make this software sophisticated with possibilities of high potential returns while keeping the drawdown below 25%. The algorithms of the robot provide investors of any level of training with an investment opportunity that is both safe and aggressive. Tunafish EA imitating the work of the brain, capable of learning and adapting to changing conditions and predicting situations. When applied to trading in fina
69 USD
Trend PA
Mikhail Nazarenko
5 (2)
The Trend PA indicator uses   Price Action   and its own filtering algorithm to determine the trend. This approach helps to accurately determine entry points and the current trend on any timeframe. The indicator uses its own algorithm for analyzing price changes and Price Action. Which gives you the advantage of recognizing, without delay, a new nascent trend with fewer false positives. Trend filtering conditions can be selected in the settings individually for your trading style. The indicator
55 USD
Buy and sell zones
Evgeniy Zhdan
5 (3)
用於確定平面和趨勢的指標。 如果價格低於兩條直方圖和兩條線(紅色和藍色)中的任何一條,則這是一個賣出區域。 購買此版本的指標時,一個真實賬戶和一個模擬賬戶的 MT4 版本 - 作為禮物(收到,給我寫私信)! 如果價格高於兩條直方圖和兩條線(紅色和藍色)中的任何一條,則這是一個買入區域。 MT4 版本: https://www.mql5.com/en/market/product/3793 如果價格在兩條線之間或在任何直方圖的區域內,那麼市場就沒有明確的趨勢。簡單地說,市場是平的。 指標的工作在屏幕截圖中更清楚地顯示。 該指標可用作獨立的交易系統。該指標可用於獲取領先數據或確定當前趨勢的方向。對於任何級別的交易者來說,這都是一個很好的工具!
69 USD
Strong Retracement Points Pro demo edition! SRP (Strong Retracement/Reversal Points) is a powerful and unique support and resistance indicator. It displays the closest important levels which we expect the price retracement/reversal! If all level are broken from one side, it recalculates and draws new support and resistance levels, so the levels might be valid for several days depending on the market! If you are still hesitating to start using this wonderful tool, you can check this link to see h
100 USD
Trendiness Index
Libertas LLC
5 (3)
"The trend is your friend" is one of the best known sayings in investing, because capturing large trendy price movements can be extremely profitable. However, trading with the trend is often easier said than done, because many indicators are based on price reversals not trends. These aren't very effective at identifying trendy periods, or predicting whether trends will continue. We developed the Trendiness Index to help address this problem by indicating the strength and direction of price trend
49 USD
Signal trend indicator. Detects the direction of the trend and is coloured accordingly.  Has built in audible and visual alerts when trends change. Can send notifications to your phone or email. Allows Trend and Counter-Trend trading. Works on all timeframes, all currency pairs, metals, indices and cryptocurrencies. Can be used with binary options. Distinctive features No re-drawing; Simple and clear settings; Four types of alerts; Works on all timeframes and all trading tools; Su
39 USD
Cosmic Diviner X Planet
Olena Kondratenko
4 (2)
This unique multi-currency strategy simultaneously determines the strength of trends and market entry points, visualizing this using histograms on the chart. The indicator is optimally adapted for trading on the timeframes М5, М15, М30, Н1. For the convenience of users, the indicator renders the entry point (in the form of an arrow), recommended take profit levels (TP1, TP2 with text labels) and the recommended Stop Loss level. The take profit levels (TP1, TP2) are automatically calculated for
79 USD
FreqoMeterForecast
Stanislav Korotky
The main idea of this indicator is rates analysis and prediction by Fourier transform. Indicator decomposes exchange rates into main harmonics and calculates their product in future. You may use the indicator as a standalone product, but for better prediction accuracy there is another related indicator - FreqoMaster - which uses FreqoMeterForecast as a backend engine and combines several instances of FreqoMeterForecast for different frequency bands. Parameters: iPeriod - number of bars in the ma
30 USD
This indicator depends on High and Low price of Currency in last Week and then i made some secret equations to draw 10 lines. Features: You will know what exactly price you should enter the market . You will know when to be out of market. You will know you what should you do in market: Buy Sell Take profit and there are 3 levels to take your profit Support Resistance Risk to buy Risk to Sell Signal Types and Frame used: You can use this indicator just on H4 frame and you have to download the
75 USD
Современный индикатор паттернов PinBar по торговой стратегии RAIT. Работает по тренду и без него. Имеет настройки таймфрейма для отображения. Можно настроить количество баров для отображения индикатора на графике. Используется несколько паттернов PinBar. Индикатор предпочтительно использовать на часовом таймфрейме и выше,   но работает и ниже   . Паттерны:  PinBar, InsPinBar, PinInside. Отображаются одной стрелкой.
35 USD
FreqoMaster
Stanislav Korotky
The main idea of this indicator is rates analysis and prediction by Fourier transform. The indicator decomposes exchange rates into main harmonics and calculates their product in future. The indicator shows 2 price marks in history, depicting price range in the past, and 2 price marks in future with price movement forecast. Buy or sell decision and take profit size are displayed in a text label in the indicator window. The indicator uses another indicator as an engine for calculations - FreqoMet
75 USD
Elliots Triangle
Stephen Reynolds
Elliot's Triangle is taken from 1 of the 13 patterns within the Elliot Wave Theory that says social or crowd behaviour tends to reverse in recognisable patterns and of which they reveal a structural pattern that appears in nature, as well as the mass psychology of trading participants. From this, he has devised various identifiable patterns that appear in market prices. One of these is what I have named Elliot's Triangle. This triangular pattern appears to reflect a balance of forces, causing
30 USD
Indicador Taurus All4
Fabio Oliveira Magalhaes
Taurus All4 Taurus All4 is a high-performance indicator, it will tell you the strength of the trend, and you will be able to observe the strength of the candle. Our indicator has more than 4 trend confirmations. It is very simple and easy to use. Confirmation Modes Candle Trend Confirmations: When the candle switches to light green the trend is high. When the candle switches to light red the trend is reverting down. When the candle changes to dark red the trend is low. Trendline Trend Conf
200 USD
VD Scalper
Vasyl Deiak
is a trend indicator that shows the reversal and correction of a trend. This indicator consists of two combined and smoothed Exponential moving Averages using a special technique. When these EMA intersect with each other, the indicator changes its color. This allows you to visually determine the moment of the market trend change and trade on various scalping strategies. Manual settings of the indicator: MA1_Period - The period of the first indicator MA2_Period - The period of the second in
30 USD
不重繪箭頭的外匯剝頭皮指標。它在 M5、M15、M30、H1 時間框架上效果最佳。默認設置適用於 M5 時間範圍。下圖顯示了使用“period=0.35”參數值處理 H1 圖表的示例。您可以下載演示版並自行測試。現在,我們幾乎在所有剝頭皮策略中都使用該指標的信號。根據我們的計算,其信號的準確性約為 95%,具體取決於時間範圍。該指標適用於所有貨幣對。我們已經在所有主要貨幣對和金屬上進行了測試。在任何地方都獲得了幾乎相同的 +-95% 的準確度。 指標的好處: 不重繪箭頭 適用於所有貨幣對 高信號精度 適合剝頭皮 指標設置: period - 計算信號精度的周期。 Price - 告訴指標使用哪個價格:CLOSE、OPEN、HIGH、LOW。默認情況下,該指標適用於收盤價。
149 USD
该产品的买家也购买
RelicusRoad Pro
Relicus LLC
4.9 (104)
现在 147 美元(优惠 602 美元)- 无限账户 - 下次更新时价格上涨 - 不要忘记留下 5 星评论 RelicusRoad 用户手册 + 培训视频 + 访问 Private Discord Group + VIP 身份 一种看待市场的新方式 RelicusRoad 是世界上最强大的外汇、期货、加密货币、股票和指数交易指标,为交易者提供保持盈利所需的所有信息和工具。我们提供技术分析和交易计划,帮助每一位交易者取得成功,从初学者到高级。它是一个关键的交易指标,可以提供足够的信息来预测未来的市场。我们相信一个完整的解决方案,而不是图表上几个没有意义的不同指标。这是一个多合一指标,显示无与伦比且非常准确的信号、箭头 + 价格行为信息。 RelicusRoad 基于强大的人工智能,提供缺失的信息和工具来教育您并使您成为交易专家,成为成功的交易者。 几乎所有技术指标都滞后,这意味着它们只能报告已经发生的事情。因此,他们只确认您过去可以看到的价格已经在哪里。我们相信领先指标可以预测未来价格,而无需重新绘制,也不要过度依赖可能改变并导致重新绘制的滞后指标。如果您根据滞后
147 USD
ICT, SMC, SMART MONEY CONCEPTS, SMART MONEY, Smart Money Concept, Support and Resistance, Trend Analysis, Price Action, Market Structure, Order Blocks, BOS/CHoCH,   Breaker Blocks ,  Momentum Shift, Supply&Demand Zone/Order Blocks , Strong Imbalance, HH/LL/HL/LH,    Fair Value Gap, FVG,  Premium  &   Discount   Zones, Fibonacci Retracement, OTE, Buy Side Liquidity, Sell Side Liquidity, BSL/SSL Taken, Equal Highs & Lows, MTF Dashboard, Multiple Time Frame, BigBar, HTF OB, HTF Market Structure,  L
65 USD
Advanced Currency Strength28 Indicator
Bernhard Schweigert
4.91 (630)
目前26%的折扣 任何新手或专家交易者的最佳解决方案! 这个指标是一个独特的、高质量的、可负担得起的交易工具,因为我们纳入了一些专有的功能和一个新的公式。只需一个图表,你就可以读出28个外汇对的货币强度!想象一下,你的交易将如何得到改善,因为你的交易是在你的手中进行的。想象一下,你的交易将如何改善,因为你能够准确地确定新趋势或剥头皮机会的触发点? 用户手册:点击这里  https://www.mql5.com/en/blogs/post/697384 这是第一本,原版的! 不要买一个毫无价值的崇拜者的克隆品。 特别的 子窗口中的箭头显示强劲的货币势头GAP将指导你的交易! 当基础货币或报价货币处于超卖/超买区域(外盘斐波那契水平)时,在个人图表的主窗口中出现警告信号。 当货币力量从外围区间回落时,回撤/反转警报。 十字星模式的特别警报 可选择多个时间框架,以快速查看趋势! 货币强度线在所有的时间框架中都非常平稳,当使用较高的时间框架来识别总体趋势,然后使用较短的时间框架来确定精确的入口时,效果非常好。你可以根据自己的意愿选择任何时间框架。每个时间框架都由其自身进
148 USD
Advanced Supply Demand
Bernhard Schweigert
4.93 (295)
现在优惠 33%! 任何新手或专业交易者的最佳解决方案! 该指标是一款独特、高质量、且价格合理的交易工具,因为我们已经整合了许多专有功能和新公式。 依据此更新,您将能够显示双重时间帧区域。 您不仅可以显示一个较高的时间帧,还可以同时显示图表时间帧,加上更高的时间帧:显示嵌套时区。 供需双方所有交易者都会喜欢它。 :) 重要信息披露 高级供需的最大潜力,请访问 https://www.mql5.com/zh/blogs/post/720245   想象您的交易如何得以改善,是因为您能够精准定位入场或目标位吗? 构建于新的底层算法,它可以更轻松地识别出买卖双方之间的潜在失衡。 这是因为它以图形方式展示供需最强劲区域,及其过去的表现(显示旧区域)。 这些功能旨在帮助您更轻松地发现最佳入场区域和价位。 现在您可以针对您的交易品种和时间帧来优化和编辑区域强度! 高级供需指标适用于所有产品和时间帧。 它是一个新的公式,非常新的功能是两个区域强度函数可由用户输入进行调整! 这在交易中是一大优势。 当您学习如何使用专有功能,例如带有价格游离最小 X 因子的区域强度时,您能够判断该区域强劲与否。 供
148 USD
Gold Stuff
Vasiliy Strukov
4.87 (167)
Gold Stuff 是专为黄金设计的趋势指标,也可用于任何金融工具。 该指标不会重绘,也不会滞后。 推荐时间框架 H1。 在它指标工作全自动专家顾问 EA Gold Stuff。 你可以在我的个人资料中找到它。 购买后立即联系我以获得设置和个人奖励!   设置 绘制箭头 - 打开关闭。 在图表上绘制箭头。 警报 - 打开关闭声音警报。 电子邮件通知 - 打开关闭。 电子邮件通知。 Puch-notification - 打开关闭。 推送通知。 接下来,调整色域。 Gold Stuff 是专为黄金设计的趋势指标,也可用于任何金融工具。 该指标不会重绘,也不会滞后。 推荐时间框架 H1。 在它指标工作全自动专家顾问 EA Gold Stuff。 你可以在我的个人资料中找到它。 购买后立即联系我以获得设置和个人奖励!   设置 绘制箭头 - 打开关闭。 在图表上绘制箭头。 警报 - 打开关闭声音警报。 电子邮件通知 - 打开关闭。 电子邮件通知。 Puch-notification - 打开关闭。 推送通知。 接下来,调整色域。
50 USD
Advanced Currency IMPULSE with ALERT
Bernhard Schweigert
4.92 (471)
目前31%的折扣!! 对任何新手或专家交易者来说都是最好的解决方案! 这个指标是一个独特的、高质量的、负担得起的交易工具,因为我们已经纳入了一些专有的功能和一个秘密的公式。只需一张图表,它就能给出所有28种货币对的警报。想象一下,你的交易将如何改善,因为你能够准确地确定新趋势或剥头皮机会的触发点 建立在新的基础算法上,它使识别和确认潜在交易变得更加容易。这是因为它以图形方式显示了一种货币的强势或弱势是否正在加速,并测量了这种加速的速度--把它想象成你汽车中的速度表。当你加速时,事情显然会发生得更快,这在外汇市场上也是一样的,即如果你配对的货币正在向相反的方向加速,你就会发现一个潜在的有利可图的交易。 货币动量的垂直线和箭头将指导你的交易! 动态的市场斐波那契23水平被用作警报触发器,将适应市场活动。如果冲动触及黄色触发线,您将在MetaTrader或您的电子邮件或推送警报中收到警报。然后你就知道作为一个交易员应该做什么。货币对和方向已经给出。只要点击警报按钮,就可以切换到该货币对或打开一个新的图表,以便进一步分析。警报级别可以通过用户输入来改变,可以选择3个敏感度级别
88 USD
Market Reversal Alerts
LEE SAMSON
4.19 (118)
成為突破者,隨著價格反轉,市場結構會改變利潤。 訂單突破者指示器可以識別趨勢或價格走勢何時接近枯竭並準備好逆轉。它會提醒您市場結構的變化,通常會在發生逆轉或重大回調時發生。 該指標使用專有計算來確定突破和價格動能。每當在可能的耗盡點附近形成新的高點時,指標就會繪製最後一個生成該高點的順序塊。然後,它將隨價格移動隨價格跟隨定單。然後,當價格轉向相反方向並突破該訂單塊時,它會提醒您,從而創建新的市場結構並開始趨勢或重大回調的可能逆轉。 訂單塊是在創建高/低之前的最後一個相反的彩色蠟燭,並且當價格跌破這些關鍵區域以下時,這表明趨勢可能會發生短期或長期反轉。 特徵 提醒您關鍵耗盡點的市場結構變化 價格接近耗盡水平時自動提取訂單塊 在一個方向繼續移動時,在價格後面跟踪定單,以提醒您最佳的反轉輸入 將顏色更改為純色塊,以顯示何時發生市場結構中斷。 適用於所有交易品種和時間範圍 內置集成的彈出窗口和電子郵件警報 策略和如何與定單破壞者指標進行交易 當斷路器塊發生時,您有兩個選擇。 看左邊!我們正在尋求供應/需求或支撐/阻力位嗎?市場結構轉變(逆轉)通常發生在價格重新測試舊水平或
49 USD
Entry Points Pro
Yury Orlov
4.72 (218)
这是一款 MT4 的趋势指标,可提供准确的入场交易信号,且无重绘或延迟。 它可应用在任何金融资产:外汇、加密货币、贵金属、股票、指数。 最好的结果出现在 M15+ 的时间帧内。 指标的 MT5 版本 重要! 购买后请联系我,以便获取详细指南和奖励。 视频 (6:22) - 一个信号赢取的利润等于指标价格的三倍。 视频 (4:44) - 它如何在测试器中工作,我的提示和技巧。 视频 (1:44) - 有关它如何处理加密货币和指数的几句话。 大多数交易者在 Entry Points Pro 指标的帮助下,在第一个交易周内就改善了他们的交易结果。 Entry Points Pro 指标的益处 入场信号无重绘或延迟 如果信号出现,并得到确认(如果信号所在烛条已收盘),则它不会再消失;不像是重绘指标,它会导致重大的财产损失,因为它们可以在显示信号后再将其删除。 无差错开仓 指标算法可令您找到入场交易(买入或卖出资产)的理想时机,从而提高每位交易者的成功率。 Entry Points Pro 可操作任何资产 它允许您在 MT4 平台上交易任何经纪商提供的加密货币、股票、
125 USD
目前八折优惠! 对任何新手或专家交易者来说都是最好的解决方案! 这个仪表板软件适用于28种货币对。它基于我们的两个主要指标(高级货币强度28和高级货币冲动)。它对整个外汇市场提供了一个伟大的概述。它显示高级货币强度值,货币运动速度和28个外汇对在所有(9)时间段的信号。想象一下,当你可以使用图表上的单一指标观察整个市场,以确定趋势和或剥头皮的机会时,你的交易将得到改善 我们已经在这个指标中建立了一些功能,使你更容易识别强势和弱势货币,同时识别和确认潜在的交易。该指标以图形方式显示货币的强势或弱势是增加还是减少,以及它在所有时间段的表现。 增加的新功能是动态市场斐波那契水平,它适应当前的市场条件变化,这是一个已经在我们的高级货币强度28和高级货币冲动指标中使用的成熟的加分项。 在交易时,总是将弱势货币和强势货币配对,这个新指标将帮助你做到这一点。 用户手册:点击这里  https://www.mql5.com/en/blogs/post/708783 特点  显示每个时间段的ACS28和GAP-speed(冲动)的货币强度值。 列:颜色代码以7种颜色
199 USD
Ultimate Sniper Dashboard
Hispraise Chinedum Abraham
4.65 (23)
折扣价为299美元! 未来可能会涨价! 请阅读下面的描述! 终极狙击手仪表盘的最佳进入系统。终极动态水平。(请查看我的产品) 由于MT4多币种测试的限制,终极狙击手仪表盘只适用于实时市场。 介绍Ultimate-Sniper Dashboard! 我们最好的产品包括HA-狙击手、MA-狙击手和许多特殊模式。终极狙击手仪表盘是一个绝对的野兽! 对于任何新手或专家交易者来说,这是最好的解决方案! 永远不要再错过任何一个动作! 对于那些喜欢简单和点数的交易者,我们有一个特别的产品给你。本质上很简单,该仪表板根据多种自定义算法查看28种货币对,完成所有工作。只需一张图表,你就可以像专家一样阅读市场。试想一下,如果你能在任何外汇对开始移动时准确地确定其方向,你的交易会有多大的改善。   我们的系统是为了寻找高概率信号并实时向用户发送警报。没有滞后或错误的信号。 为了保持图表的清洁,你可以在不需要时隐藏Ultimate-Sniper。只需按下箭头按钮即可隐藏仪表板。 Ultimate-Sniper适用于从1分钟到月度的所有时间框架,因此你可以在你选择的任何时间框架上快速
299 USD
TakePropips Donchian Trend Pro
Eric John Pajarillaga Aldana
4.75 (12)
TakePropips Donchian Trend Pro   (MT4) 是一款功能强大且有效的工具,可使用 Donchian 通道自动检测趋势方向,并为您提供进场和退场交易信号! 这个多功能指标包括趋势扫描器、交易信号、统计面板、筛选器、交易时段和警报历史仪表板。它旨在为您提供交易信号并节省您分析图表的时间! 您可以在我们的博文中下载用户手册和安装指南:   https   :// www.mql5.com/en/blogs/post/751368 今天立减 50%!价格从 98 美元降到 49 美元! 您可以在 Strategy Tester 上测试该指标(启用可视模式)。如果您喜欢在实时图表上进行测试,也可以给我发消息以获取 7 天试用版。 视频教程也可在说明下方获得更多详细信息。 如果您有任何问题或需要任何帮助,请与我联系。 TakePropips Donchian Trend Pro 指标适用于所有外汇对、金属、商品、指数和加密货币。 主要特点 交易信号 - 检测多个时间范围内所有货币对的买卖机会。它将为您提供警报并在图表上绘制交易信号,最多 3 个止盈价和一个止
99 USD
ADR Reversal Indicator
LEE SAMSON
4.09 (11)
ADR 反轉指標一目了然地顯示當前價格相對於其正常平均每日範圍的交易位置。當價格超過您選擇的平均範圍和高於它的水平時,您將通過彈出窗口、電子郵件或推送獲得即時警報,以便您可以快速跳入回調和反轉。該指標在圖表上在平均每日範圍極值處繪製水平線,並在這些水平之上延伸,這些水平附加了價格超過它們的數學概率。下面的更多細節...... ADR 警報儀表板補充指標並監控所有配對也可在此處獲得: https://www.mql5.com/en/market/product/62756 MT5 版本也可在此處獲得: https://www.mql5.com/en/market/product/64477/ 大約 60% 的時間價格在其正常的平均每日範圍 (ADR) 內交易並推高這些水平通常是價格急劇波動的指標,通常會出現回調(獲利了結)走勢。您可以通過交易從每日範圍的頂部或底部回落到最近的支撐位或阻力位來利用這些急劇波動。 收集了超過 20 年的歷史數據,以找出主要外匯對和一系列交叉盤的價格超出特定 ADR 水平的平均百分比。該數據表明價格僅在 3% 的時間內超過其 ADR 的 20
49 USD
Owl smart levels
Sergey Ermolov
4.7 (20)
指標指南   |   Owl Smart Levels策略  |  MT5版本  |  如何安裝?   |   FAQ Owl Smart Levels Indicator   是一個完整的交易系統,包含   Bill Williams   的高級分形、構建正確的市場波浪結構的 Valable ZigZag 以及標記準確入場水平的斐波那契水平等流行的市場分析工具 進入市場和地方獲利。 交易系統的詳細說明見 Owl Trend Strategy - Smart Levels 篇。 力量在於簡單! Owl Smart Levels   交易系統非常易於使用,因此適合專業人士和剛開始研究市場並為自己選擇交易策略的人。 策略和指標中沒有隱藏的秘密公式和計算方法,所有策略指標都是公開的。 Owl Smart Levels 允許您快速查看進入交易的信號,突出顯示下訂單的水平並向您發送有關已出現信號的通知。 優點很明顯: 清楚地顯示主要和更高時間框架的趨勢方向。 指示儀器信號的出現。 標記開單、止損設置和固定利潤的水平。 沒有多餘的,只有必要的結構! ZigZag   表示全球趨勢的方向,因此也
97 USD
自动在你的图表上画出支撑位和阻力位以及推动性蜡烛缺口,这样你就可以看到价格接下来可能会走向哪里和/或可能会逆转。 该指标旨在作为我的网站(The Market Structure Trader)上教授的头寸交易方法的一部分,并显示目标和潜在入场的关键信息。 该指标有两个核心功能和四个附加功能: 核心功能1 - 日线、周线和月线的自动支持和阻力线 该指标为你自动绘制过去2天以及6周和数月前的最新支撑和阻力水平。你可以完全自定义这些水平的外观以适合你,并显示多少个。这些关键水平通常作为主要的支持和阻力区,价格将从这里转向并回撤或逆转。它们也是价格将走向的目标,因此你可以迅速看到在价格可能转向之前交易的潜在距离。 核心特征2--推进型蜡烛缺口目标 推进性缺口蜡烛是银行和机构通过在任何市场上执行大额头寸而创造的强劲、快速的移动。这些大阳线一旦形成,有两个关键作用。 1. 1.它们作为一个方向性信号,因为大型市场参与者已经选择了一个方向,一旦发生,价格往往会在一段时间内继续移动。 2. 2.更重要的是,它们作为目标,因为这些区域往往会让其他大玩家的头寸 "越位",价格在绝大
49 USD
此儀表板是與市場結構反轉指標一起使用的警報工具。它的主要目的是提醒您在特定時間範圍內的逆轉機會,以及像指標一樣重新測試警報(確認)。儀表板設計為單獨放置在圖表上,並在後台工作,以向您發送有關您選擇的貨幣對和時間範圍的警報。它是在許多人要求衝刺以同時監控多個貨幣對和時間框架而不是讓市場反轉指標在一個 MT4 中的多個圖表上運行之後開發的。它會在 M5、M15、M30、H1、H4 和 D1 時間範圍內發出警報。當然,與交易中的任何事情一樣,更高的時間框架效果最好。 該儀表板被設計為市場結構反轉指標的附加組件。它將獨立工作,並提醒市場反轉警報指標給出的模式和信號。 在此處獲取市場反轉警報指標: https://www.mql5.com/en/market/product/46295 此儀表板的 MT5 版本可在此處獲得: https://www.mql5.com/en/market/product/65828 此處提供 EA:汽車交易市場反轉警報! https://www.mql5.com/en/market/product/65383 我創建的用於繪製矩形並提醒特定貨幣對的市
49 USD
Trend Chief
Vladimir Stepanov
5 (4)
Trend Chief 是一种先进的指标算法,可以过滤掉市场噪音,确定趋势、入场点以及可能的出场水平。 使用较短的时间框架进行剥头皮交易,使用较高的时间框架进行波段交易。 Trend Chief 完美适用于所有 Metatrader 符号:货币、金属、加密货币、股票和指数 * 如何使用 Trend Chief 指标: - 通过查看每日和 H4 图表了解主要趋势 - 如果趋势向上,转到更小的时间框架,如 m15,等待价格移动到主绿线上方,然后再进行交易,所有其他线也必须是绿色。 - 如果趋势向下,转到更小的时间框架,如 m15,等待价格移动到主红线下方,然后再进行交易,所有其他线也必须是红色的。 - 线条颜色变化时退出交易 我的信号和其 他产品可以在这里找到
45 USD
Currency Strength Exotics
Bernhard Schweigert
4.84 (25)
目前8折优惠! 对任何新手或专家交易者来说都是最好的解决方案! 这个指标是专门用来显示任何符号的货币强度,如异国货币对、商品、指数或期货。它是同类产品中的第一个,任何符号都可以添加到第9行,以显示黄金、白银、石油、DAX、US30、MXN、TRY、CNH等的真实货币强度。这是一个独特的、高质量的、负担得起的交易工具,因为我们已经纳入了一些专有的功能和一个新的公式。想象一下,你的交易将如何改善,因为你能够准确地确定新趋势或剥头皮机会的触发点? 用户手册:点击这里   https://www.mql5.com/en/blogs/post/708876 它适用于所有时间框架。你将很快能够看到TREND! 根据新的基础算法设计,它使识别和确认潜在交易变得更加容易。这是因为它以图形方式显示了8种主要货币和一种符号的强弱。 该指标显示了8种主要货币(澳元加元瑞士法郎欧元英镑日元新西兰美元)的强弱线,再加上一个符号! 该指标显示了符号的真实价值。例如:对于XAUUSD(黄金):价格以美元报价。如果黄金在上涨,你怎么能知道是黄金的强势还是美元的弱势?只有当黄金走强时,我们才会进行
128 USD
AW Trend Predictor
Alexander Nechaev
4.69 (32)
一个系统中趋势和故障水平的组合。先进的指标算法过滤市场噪音,确定趋势、进入点以及可能的退出水平。指标信号记录在统计模块中,您可以选择最合适的工具,显示信号历史的有效性。该指标计算获利和止损标记。 手册和说明 ->   这里 / MT5 版本 ->   这里 如何使用指标进行交易: 使用趋势预测器进行交易只需三个简单的步骤: 第 1 步 - 开仓 收到买入信号,成功率超过 70% 第 2 步 - 确定止损 通过相反的信号选择中继线 第 3 步 - 定义止盈策略 策略一:达到 TP1 时平仓 策略 2:达到 TP1 时平仓 50%,达到 TP2 时平仓剩余 50% 策略三:在趋势反转时平仓 好处: 从不重绘结果,信号严格位于蜡烛收盘时 它可以在顾问中使用 获利和止损标记 对交易策略或独立策略的重要补充 市场噪音过滤算法 适用于任何工具 统计模块: 为了更好地选择配对,请使用内置的统计计算。 计算交易 - 给出统计数据的信号总数 成功评级 - 达到 TP1 的信号百分比,或反转那些正获利的信号时的百分比 TakeProfit1 Hit - 达到 TP1 的信号百分比 TakeProfit2
55 USD
Ultimate Dynamic Levels
Hispraise Chinedum Abraham
4.88 (8)
目前正在进行节日折扣,价格为399美元! 未来价格可能会上涨。请阅读下面的描述!   介绍 Ultimate Dynamic Levels - Ultimate Sniper Dashboard的最佳入场指标! 极低风险的及时进场和高RR!! 在这里找到终极狙击手仪表板。 对于初学者和职业交易者来说,最重要的能力是准确判断市场最可能转向的位置和时间,以及如何安全进入并获利退出。 终极动态水平指标很容易告诉你市场转折的最高可能性在哪里,这样你就可以自信地进入一个极低风险的交易,同时保持你的图表干净和简单,同时赚取美元! 终极动态水平指标有一个独特而强大的算法,可以同时在多个时间框架上找到重要的隐藏水平。它实在是太神奇了,而且永远不会像其他典型的SR指标那样重绘或重新绘制水平线!  终极动态水平指标还在图表的右侧有一个水平强度简介,以显示该水平在最近的历史上是否强劲。一个强大的奖励组合!!!。 终极动态水平指标有3个非常重要的功能。 1. 帮助你进入趋势方向的低风险交易。 2. 2.使你保持在趋势中,只要移动仍在进行。 3. 3.作为追踪止损,保护你的收益,避免把钱留
199 USD
PRO Renko System
Oleg Rodin
5 (16)
PRO Renko Arrow Based System for trading renko charts.  准确的信号交易任何外汇工具. 另外,我将免费提供系统的附加模块! PRO Renko系统是RENKO图表上高度准确的交易系统。该系统是通用的。 该交易系统可应用于各种交易工具。 该系统有效地中和了所谓的市场噪音,打开了获得准确反转信号的通道。 该指标易于使用,只有一个参数负责产生信号。 您可以很容易地使算法适应您感兴趣的交易工具和renko酒吧的大小。 我很乐意通过提供任何咨询支持来帮助所有客户有效地使用该指标。 祝您交易成功!购买后,立即写信给我! 我将与您分享我的建议和我的renko发电机。 另外,我将免费提供系统的附加模块!
75 USD
Scalper Vault
Oleg Rodin
5 (14)
Scalper Vault 是一个专业的剥头皮系统,为您提供成功剥头皮所需的一切。该指标是一个完整的交易系统,可供外汇和二元期权交易者使用。推荐的时间范围是 M5。 该系统为您提供趋势方向的准确箭头信号。它还为您提供顶部和底部信号以及江恩市场水平。无论您拥有何种交易经验,该系统都易于使用。您只需要遵循简单的规则并每天重复该过程。 建议将此系统用于主要货币对。感谢您的关注! 请注意,该指标在策略测试器中可能无法正常工作。因此,我建议仅在模拟或真实账户的真实交易条件下使用该系统。 指示器提供所有类型的警报,包括推送通知。 购买指标后请与我联系。我将免费与您分享我的个人交易建议和出色的奖励指标! 祝您交易愉快,盈利!
65 USD
RSI / TDI 警报仪表板允许您一次监控您交易的每个主要货币对的 RSI(由您选择)。 您可以通过两种方式使用它: 1. 选择多个时间框架,当有多个时间框架超出正常交易条件时,破折号会显示给您。一个很好的指标表明价格最近在推高,因为它在多个时间范围内达到了超买或超卖水平,因此很快就会出现回调或逆转。 2. 使用一个时间框架(您最喜欢的交易)和多个 RSI 水平向您展示该时间框架内 RSI 扩展的强度。当价格在一个方向上非常猛烈地推动太长时间并且市场应该出现获利了结时,这是一种进行均值回归交易的好策略。在示例屏幕截图中,您可以看到 H4 RSI 在 25 水平之上扩展了 2 对,这比典型的价格走势要远得多,因此是做多的好机会。 当蜡烛在所选时间范围内收盘时,仪表板将提醒您选择水平的扩展条件(超买和​​超卖)。您可以同时监控 6 个单独的 RSI。您可以独立选择每个时间范围、类型以及超买和超卖水平。 此处提供 MT5 版本: https://www.mql5.com/en/market/product/66307 您可以立即查看任何货币对的状况,并选择那些
49 USD
Band trend indicator
lizhi fu
4.7 (20)
一款可以直观识别波段趋势的顶底指标,手工交易最佳选择,不重绘不漂移。 如何免费获得此指标: 了解更多信息 适应任何新手和量化交易的朋友,可以把信号写入到EA中自由发挥,数组3和数组4,例:3>4为变绿,3<4为变红,如有不懂的请联系我。 参数简介: KQuantity  显示历史K线的数量 InpPeriod_3 指标获取范围参数 Popupalarm 弹窗报警开关 Mailalarm 邮件报警开关 AlarmTimeinterval  每报警一次的间隔时间 Upperhorizontalline 上方水平线参数 Lowerhorizontalline 下方水平线参数 ===================分析方法:===================== buy: 指标绿柱在下方水平线下,由红柱变成绿柱确定做buy。 sell:指标红柱在上方水平线上,由绿柱变成红柱确定做sell。
79 USD
GOLD Impulse with Alert
Bernhard Schweigert
3.67 (3)
这个指标是我们2个产品 Advanced Currency IMPULSE with ALERT  +   Currency Strength Exotics 的一个超级组合。 它适用于所有时间框架,并以图形方式显示8种主要货币和一种符号的强势或弱势冲动! 该指标专门用于显示任何符号的货币强度加速,如黄金、异国货币对、商品、指数或期货。这是它的第一个指标,任何符号都可以被添加到第9行,以显示黄金、白银、石油、DAX、US30、MXN、TRY、CNH等的真实货币强度加速(冲动或速度)。 建立在新的基础算法上,它使识别和确认潜在的交易更加容易。这是因为它以图形方式显示了一种货币的强势或弱势是否正在加速,并测量了这种加速的速度--把它想象成你汽车中的速度表。当你加速时,事情显然会发生得更快,这在外汇市场上也是一样的,即如果你配对的货币正在向相反的方向加速,你就会发现一个潜在的有利可图的交易。 动态市场斐波那契28水平被用作警报触发器,将适应市场活动。如果冲动击中黄色触发线,你将收到警报。然后你就知道作为一个交易员应该做什么。货币对和方向已经给出。只需点击警报按钮,就可以
149 USD
Trend Screener
STE S.S.COMPANY
4.76 (59)
趋势指标,趋势交易和过滤的突破性独特解决方案,所有重要趋势功能都内置在一个工具中! 它是 100% 非重绘多时间框架和多货币指标,可用于所有符号/工具:外汇、商品、加密货币、指数、股票。 趋势筛选器是有效的指标趋势跟踪指标,它在图表中提供带有点的箭头趋势信号。 趋势分析器指标中可用的功能: 1.趋势扫描仪。 2. 具有最大利润分析的趋势线。 3.趋势货币强度计。 4. 带有警报的趋势反转点。 5. 带有警报的强趋势点。 6. 趋势箭头 每日分析示例,每日信号表现...等与我们的趋势筛选指标,可以在这里找到: 点击这里 限时优惠:Trend Screener Indicator 仅售 50 美元且终身可用。原价 125$) 通过访问我们的 MQL5 博客,您可以找到我们所有的高级指标以及分析示例、每日信号表现...等。 : 点击这里 我们的趋势系统由 2 个指标组成: 1. Trend Screener Indicator:显示趋势仪表盘、图表中的趋势线、入场点...等。 2. Trend Line Map Indicator:显示买卖作为仪表板,活动信号盈利/亏损
50 USD
FX Power
Daniel Stein
4.84 (109)
你想成为一个持续盈利的五星级外汇交易商吗? 1. 阅读我们的简单 交易系统 的基本描述 ,以及 它在2020年的主要战略更新 2. 发送您的购买截图,以获得您的个人邀请,参加我们的独家交易聊天。 FX Power 是第一个具有所有时间框架的完整历史的货币强度表。 它分析所有主要货币的势头和强度,以确定高概率交易。 主要特点 所有主要货币的完整强度历史 跨越所有时间框架的货币强度历史 在所有经纪商和图表中的计算结果完全相同 100%可靠的实时计算---无重绘 可通过下拉列表选择时间段 一个图表中可以有多个实例 可移动的FX Power显示(通过拖放)。 适用于高分辨率的QHD、UHD和4K显示器 自动的终端配置 针对平板电脑和触摸屏的使用进行了优化 通过电子邮件、信息和手机通知发出警报 可供EA请求的缓冲区 如何使用FX Power进行交易? 使用FX Power柱状图按钮来显示你需要的货币线,并比较短期和长期分析,以确定有效的组合。 A.交易货币直方图线的 "交叉 "情况 如果欧元与美元交叉,则买入 如果欧元向下穿越美元,则卖出 B.交易不同时间段的确认模式
66 USD
A. 什么是 A2SR ?   * 这是一个领先的技术指标(没有重绘,没有滞后)。  -  指导 : -- 在  https://www.mql5.com/en/blogs/post/734748/page4#comment_16532516 -- 和  https://www.mql5.com/en/users/yohana/blog A2SR 在确定支撑(需求)和阻力(供应)水平方面有一种特殊的技术。 与我们在网上看到的普通方式不同,A2SR 在确定实际 SR 级别时有一个独创的概念。 原技术不是从网上拿来的,也没有在网上公开过。 A2SR 将根据您的交易风格自动选择 SR 级别。 即使您正在更改时间范围,但 SR 级别仍将保留在其位置上。 因为实际的 SR 不是从你使用的时间范围内获得的。 A2SR 拥有完整的交易工具 。 实际支持(需求)和阻力(供应)的真正概念。 新闻事件和央行讲话的市场情绪。 新闻事件和趋势的主要货币强度 (MCS) 的真正概念。 今天的当前趋势,包括放置位置的建议。 SR、Breakout 和 Breakdown 的自动水平趋势线。 您会发现分析
386 USD
Supply and Demand Dashboard PRO
Bernhard Schweigert
4.8 (20)
目前八折优惠! 这个仪表板是一个非常强大的软件,可用于多个符号和多达9个时间段。 它是基于我们的主要指标(最佳评论:高级供应需求)。 Advanced Supply Demand 该仪表板提供了一个伟大的概述。它显示。   筛选后的供需值,包括区域强度评级。 区间内和区间外的点位距离。 它突出了嵌套的区域。 在所有(9个)时间段内,它对所选符号发出4种警报。 它是高度可配置的,以满足您的个人需求! 您的利益! 对每个交易者来说,最重要的问题是。 什么是入市的最佳水平? 在强大的供应/需求区域内或附近进入你的交易,以获得最佳的成功机会和风险/回报。 我的止损的最佳位置是哪里? 把你的止损放在强势供应/需求区的下方/上方是最安全的。 我的最佳盈利目标是什么? 你的退出策略和你的进入策略一样重要,了解更高的时间框架图可以帮助你。对于买入,使用下一个供应区作为目标,对于卖出,使用下一个需求区作为目标。在回撤到供应区或需求区时进场,以确保有足够的利润空间,达到更高的时间框架的供应和需求,将增加你的利润。 为什么我们要过滤强区和
199 USD
FX Volume
Daniel Stein
4.67 (33)
跟随聪明的资金终于成为可能! 外汇交易量是第一个也是唯一的交易量指标,它从经纪人的角度提供了对市场情绪的真正洞察力。 它对机构市场参与者,如经纪人,在外汇市场的定位提供了令人敬畏的见解,比COT报告快得多。 在你的图表上直接看到这些信息是真正改变游戏规则和突破性的交易解决方案。 请阅读我们的基本教程- >"如何使用外汇交易量进行交易" 获取更多信息,如常见问题、交易技巧和教程视频,请访问我们的 公共外汇交易量信息频道 请 安装并运行SI Connect 以建立与我们数据中心的持续连接 背景信息 我们都知道,外汇是一个分散的市场。这就是为什么我们不得不跳出框框,开发一个独特的解决方案,并对最复杂的项目进行编码,我们所做的是为了在我们的图表中获得这种无价的信息。自2018年10月以来,我们的服务器分析和记录来自世界各地的几个不同来源的真实交易量数据资料。我们收集数据,分析交易量的变化,并计算出最重要的外汇交易货币的指数,但这只是一个开始。以后,我们还将为其他交易工具如黄金和石油提供此类信息。 使用斯坦因投资公司提供的真实交易量数据有什么好处? 1.由于我们的经
33 USD
MetaBands M4
Vahidreza Heidar Gholami
5 (1)
MetaBands使用强大且独特的算法绘制通道并检测趋势,以便为交易者提供进出交易的潜在点。它是一个通道指标和强大的趋势指标。它包括不同类型的通道,可以通过使用输入参数简单地合并以创建新通道。MetaBands使用所有类型的警报通知用户市场事件。 功能 支持大多数通道算法 强大的趋势检测算法 能够合并不同类型的通道 多时间帧和多货币(信号矩阵) 所有类型的警报功能(声音、屏幕闪烁、推送通知、电子邮件、弹出窗口、箭头) 它永远不会重绘 趋势检测 MetaBands使用在通道内振荡的蓝色线来检测趋势。当该线遇到通道的上界时,表明开始下跌趋势,当它遇到下界时,表明开始上涨趋势。如果蓝线接近中线,则市场处于整理期。 该指标使用独特的方法来检测趋势。一开始可能看起来有些复杂,但如果您观看视频教程,您就会意识到它是多么强大且易于使用。 入场和出场信号 当趋势变化或价格穿过上下通道时,MetaBands会立即通过不同的方法提醒交易者,这些方法可以在指标设置中启用。 信号矩阵 要监视来自不同时间框架的多个符号并在一个地方查看信号,请单击右上角按钮或按键盘上的M键以打开信号矩阵。该矩阵可以
129 USD
作者的更多信息
MetaCOT 2 is a set of indicators and specialized utilities for the analysis of the U.S. Commodity Futures Trading Commission reports. Thanks to the reports issued by the Commission, it is possible to analyze the size and direction of the positions of the major market participants, which brings the long-term price prediction accuracy to a new higher-quality level, inaccessible to most traders. The indicator of the net positions of the market participants displays the difference between the long a
30 USD
MetaCOT 2 CFTC ToolBox is a special library that provides access to CFTC (U.S. Commodity Futures Trading Commission) reports straight from the MetaTrader terminal. The library includes all indicators that are based on these reports. With this library you do not need to purchase each MetaCOT indicator separately. Instead, you can obtain a single set of all 34 indicators including additional indicators that are not available as separate versions. The library supports all types of reports, and prov
95 USD
MetaCOT 2 COT Index MT4
Vasiliy Sokolov
3 (2)
MetaCOT 2 is a set of indicators and specialized utilities for the analysis of the U.S. Commodity Futures Trading Commission reports. Thanks to the reports issued by the Commission, it is possible to analyze the size and direction of the positions of the major market participants, which brings the long-term price prediction accuracy to a new higher-quality level, inaccessible to most traders. These indicators, related to the fundamental analysis, can also be used as an effective long-term filter
30 USD
The MetaCOT 2 CFTC ToolBox Demo is a special version of the fully functional MetaCOT 2 CFTC ToolBox MT5 library. The demo version has no restrictions, however, unlike the fully functional version, it outputs data with a delay. The library provides access to the CFTC (U.S. Commodity Futures Trading Commission) reports straight from the MetaTrader terminal. The library includes all indicators that are based on these reports. With this library you do not need to purchase each MetaCOT indicator sepa
FREE
MetaCOT 2 CFTC ToolBox is a special library that provides access to CFTC (U.S. Commodity Futures Trading Commission) reports straight from the MetaTrader terminal. The library includes all indicators that are based on these reports. With this library you do not need to purchase each MetaCOT indicator separately. Instead, you can obtain a single set of all 34 indicators including additional indicators that are not available as separate versions. The library supports all types of reports, and prov
95 USD
Trade in the opposite directions with HedgeTerminal HedgeTerminal is a full-featured trading terminal inside MetaTrader 5. This is a graphic panel resembling MetaTrader 4 terminal. It allows you to track oppositely directed positions in the manner it is possible in MetaTrader 4. In other words, we can open unlimited number of positions on a single symbol even if positions are in complete or partial hedge (lock). Thus, you can maintain long and short positions simultaneously, which is impossible
FREE
MetaCOT 2 is a set of indicators and specialized utilities for the analysis of the U.S. Commodity Futures Trading Commission reports. Thanks to the reports issued by the Commission, it is possible to analyze the size and direction of the positions of the major market participants, which brings the long-term price prediction accuracy to a new higher-quality level, inaccessible to most traders. These indicators, related to the fundamental analysis, can also be used as an effective long-term filter
30 USD
MetaCOT 2 is a set of indicators and specialized utilities for the analysis of the U.S. Commodity Futures Trading Commission reports. Thanks to the reports issued by the Commission, it is possible to analyze the size and direction of the positions of the major market participants, which brings the long-term price prediction accuracy to a new higher-quality level, inaccessible to most traders. These indicators, related to the fundamental analysis, can also be used as an effective long-term filter
FREE
MetaCOT 2 is a set of indicators and specialized utilities for the analysis of the U.S. Commodity Futures Trading Commission reports. Thanks to the reports issued by the Commission, it is possible to analyze the size and direction of the positions of the major market participants, which brings the long-term price prediction accuracy to a new higher-quality level, inaccessible to most traders. These indicators, related to the fundamental analysis, can also be used as an effective long-term filter
FREE
MetaCOT 2 CFTC ToolBox Demo is a special demo version of a full-featured library MetaCOT 2 CFTC ToolBox MT4 . The demo version does not have any limitations, but it outputs data with a delay in contrast to the full version. The library provides access to the CFTC reports (U.S. Commodity Futures Trading Commission) reports straight from the MetaTrader terminal. The library includes all indicators that are based on these reports. With this library you do not need to purchase each MetaCOT indicator
FREE
MetaCOT 2 is a set of indicators and specialized utilities for the analysis of the U.S. Commodity Futures Trading Commission reports. Thanks to the reports issued by the Commission, it is possible to analyze the size and direction of the positions of the major market participants, which brings the long-term price prediction accuracy to a new higher-quality level, inaccessible to most traders. The indicator of absolute positions shows the dynamics of the open positions or the number of traders in
30 USD
Movement Index was first proposed by Steve Breeze and described in his book "The Commitments of Traders Bible: How To Profit from Insider Market Intelligence". It quickly gained popularity among the traders who analyze the CFTC reports, and became a classic and a unique tool in many aspects, which can be used for finding rapid changes, leading to an imbalance of positions between the market participants. The indicator displays the change in the relative position of the participants as a histogra
30 USD
CME Daily Bullettin Open Interest provides the data on the open interest of futures contracts on the CME for your charts. Open interest is a special type of volume, that shows how many contracts are being held by the market participants at each moment of time. This type of information is available only in futures markets. But now, with this indicator, you can also analyze these data when trading the spot markets, such as FOREX. In addition, the indicator provides data on the open interest for th
50 USD
Call/Put Ratio is one of the most well-known indicators of the market sentiment. The indicator has been developed by Martin Zweig. It is based on real volumes of the CBOE option market. As we know, a Call option gives its owner the right to buy the underlying asset at a predetermined price. A Put option gives the right to sell it. Thus, increasing volumes for Call options indicate the increasing demand. The growth of Put option volumes shows that supply starts exceeding demand. If we divide the
50 USD
MetaCOT 2 COT Index MT5
Vasiliy Sokolov
1 (1)
MetaCOT 2 is a set of indicators and specialized utilities for the analysis of the U.S. Commodity Futures Trading Commission reports. Thanks to the reports issued by the Commission, it is possible to analyze the size and direction of the positions of the major market participants, which brings the long-term price prediction accuracy to a new higher-quality level, inaccessible to most traders. These indicators, related to the fundamental analysis, can also be used as an effective long-term filter
30 USD
CME Daily Bullettin Real Volume displays the real daily volumes of futures contracts traded on the Chicago Mercantile Exchange (CME). Decentralized markets, such as FOREX, the real volumes are either not available, or local volumes of a broker/liquidity provider are broadcast. Tick volumes available in the terminal only outline the changes taking place on the market, and can not be used as a full-fledged tool for price analysis. In addition, the indicator is able to display the volumes of the Ca
30 USD
CME Daily Bullettin Open Interest provides the data on the open interest of futures contracts on the CME for your charts. Open interest is a special type of volume, that shows how many contracts are being held by the market participants at each moment of time. This type of information is available only in futures markets. But now, with this indicator, you can also analyze these data when trading the spot markets, such as FOREX. In addition, the indicator provides data on the open interest for th
30 USD
Call/Put Ratio is one of the most well-known indicators of the market sentiment. The indicator has been developed by Martin Zweig. It is based on real volumes of the CBOE option market. As we know, a Call option gives its owner the right to buy the underlying asset at a predetermined price. A Put option gives the right to sell it. Thus, increasing volumes for Call options indicate the increasing demand. The growth of Put option volumes shows that supply starts exceeding demand. If we divide the
30 USD
筛选:
无评论
回复评论
版本 2.53 2018.09.11
- Fix delay error in strategy tester
版本 2.52 2018.08.28
- Fix empty indicator in strategy tester
版本 2.51 2018.08.24
Version 2.51 (2018.08.16)
- Starting from this version, a new utility for downloading reports is available - MetaCOT Data Provider.
This utility work as Win32 system tray application and download CFTC reports in background mode. If you
use this utility you can make auto update reports from MetaCOT indicators and don't use 'MetaCOT Install CFTC
Reports'.
- 'MetaCOT CFTC Install Reports' tool was upgraded. Now, it contains the new help system. Its general window also was
changed. Now, this window contains information about the status of the connection, a status of the database
(outdated or not) and status of MetaCOT Data Provider Win32 until (install or not).
If this util available 'MetaCOT CFTC Install Reports'
load local files and parse it.
- MetaCOT indicators and Toolbox Library began to contain inner COT data for the most basic symbols. This data can
use if MetaCOT wasn't installed. This option is useful in the strategy tester if the installation was not performed.
- All indicators began to contain the system of update data (mini tool based on 'MetaCOT CFTC Install Reports').
If you use MetaCOT Data Provider utility, you can update reports automatically and don't use 'MetaCOT Install CFTC
Reports'. For this case, you need switch on new parameter 'AutoUpdate' in position true.
- Added parameter 'Not Show Continues Data'. If this flag is enabled - last unknowing values are empty. Otherwise
last unknowing values continue.
- Added control for bad combination parameter. If you select nonreportable group of trades and also select Data Type
as 'Number of Traders' you will see message 'Incorrect combination of parameters'.
- Removed parameter 'Data Type' for Largest COT indicators group. This parameter not effect for largest traders.
- Fixed a bug in strategy tester. When any indicators were started in strategy tester it's valued was intermittent.
- Fixed a bug that caused an error 'invalid pointer access' in some cases
- Now all MetaCOT indicators and ToolBox Library contain additional GUI forms and MessageBox for more user friendly.
The work of indicators has become clearer.
版本 2.13 2017.05.30
- Fixed bug: in the latest version of the indicator, the "Futures Only" report was actually displayed regardless of the report type specified ("Futures Only" or "Futures And Options")
- Internal fixes related to the releases of new versions of MetaTrader and MQL. MetaCOT now fully complies with the new language standard.
版本 2.12 2017.04.07
Version 2.11
- Fixed the error that caused the data to be redownloaded, even if the data have been downloaded earlier. This error caused a significant slowdown of the indicator operation in the strategy tester and loaded the computer hard drive.
- Now, all indicators are compiled from the source codes of MetaCOT ToolBox. A common code base prevents errors in individual indicators and further synchronizes the code management.
版本 2.4 2016.05.18
- Normalized the indicator parameters. Now, the main parameters are at the top. Fine tuning and extra features parameters are at the bottom. These additional parameters form PROFESSIONAL SETTINGS group.
- Fixed internal array initialization. In previous versions, this sometimes caused errors hiding the indicators from a chart.
- Now, oscillators automatically scale within -10 to +110%. This helps to set up more correct view of the indicators right at the first start of the indicator since the lines do not cross the top and bottom window borders.
- Switched to classic display of the indicator levels. Now, it is possible to place them at arbitrary levels, as well as change their colors and line types.
版本 2.3 2016.04.27
Version 2.03
- Added new parameter: 'Release Day'. It takes two values: 'Release by Tuesday' - new values of the indicator appear every Tuesday, and 'Release by Friday' (default value), - new values of the indicator appear ever Friday.
- Added new parameter: 'Data Type'. It allows to select the data source. At the value 'Contracts of Traders' the indicator downloads the information on the number of traders' contracts. At the value 'Number of Traders' the indicator downloads the information on the number of traders holding the corresponding position.
- Added an error message, displayed in the indicator window, if the data with the CFTC reports were not found or if 'MetaCOT CFTC Install Reports' is not installed.
- Fixed the indicator crash, which occurred when attempting to download a non-existing report.
- Now, the levels of threshold values of indicator can be modified in the "Levels" tab of the setting window.
版本 2.2 2016.03.23
Version 2.02
- Fixed the indicator error that caused netto position to be displayed instead of the Williams Commercial Index.