• 概述
  • 评论 (18)
  • 评论 (13)
  • 新特性

TPSpro RFI Levels MT5

4.71
指示    俄罗斯-    英语 建议与指示器一起使用  -   TPSpro趋势专业版

- MT4版本   

交易中的一个关键要素是做出买卖交易工具决定的区域或水平。尽管主要参与者试图隐藏他们在市场中的存在,但他们不可避免地会留下痕迹。我们的任务是学习如何识别这些痕迹并正确解释它们。

    主要功能:

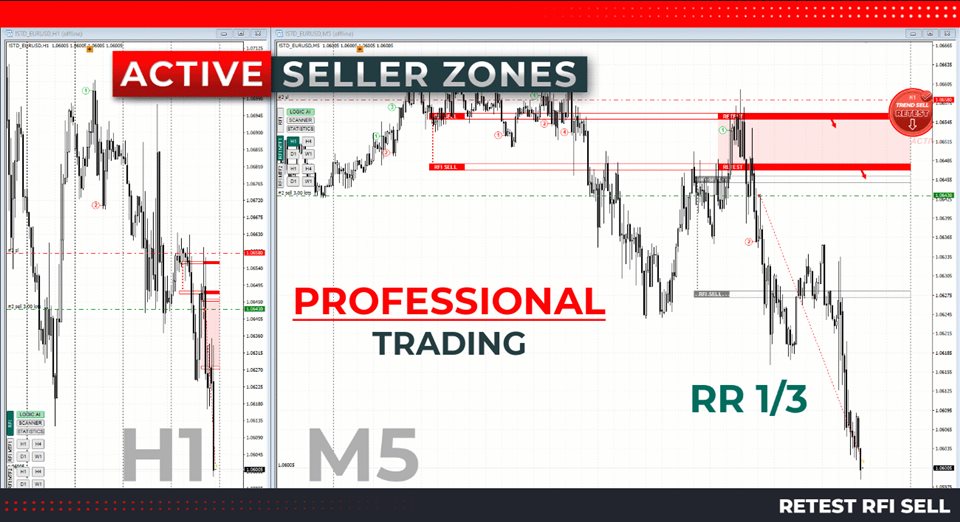
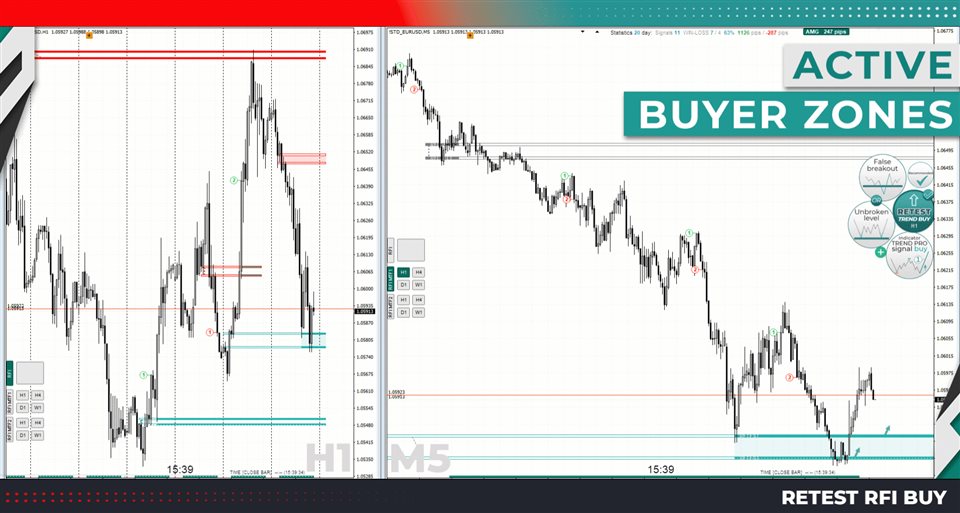
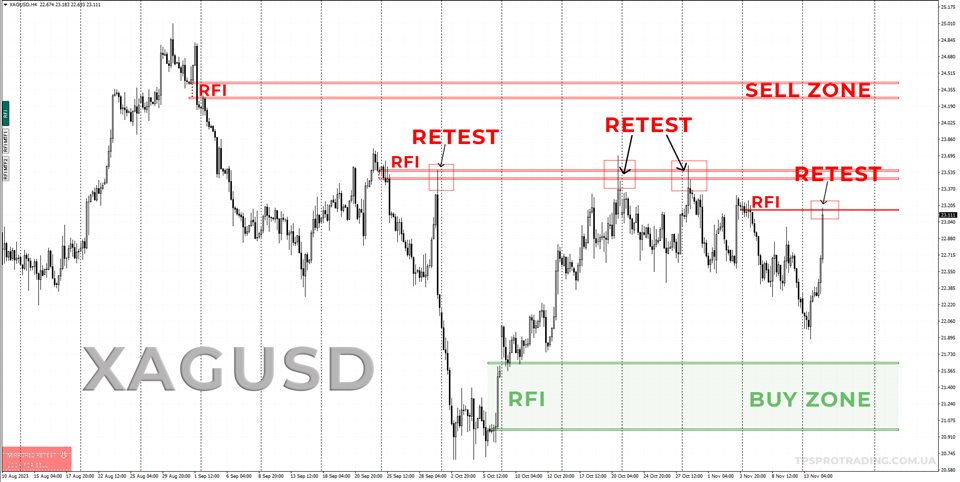
    • 向卖家和买家显示活跃区域!
    • 该指标显示所有正确的初始买入和卖出脉冲水平/区域。激活这些水平/区域后,开始寻找切入点,水平会改变颜色并填充特定阴影。此外,还会显示箭头,以便更直观地了解情况。
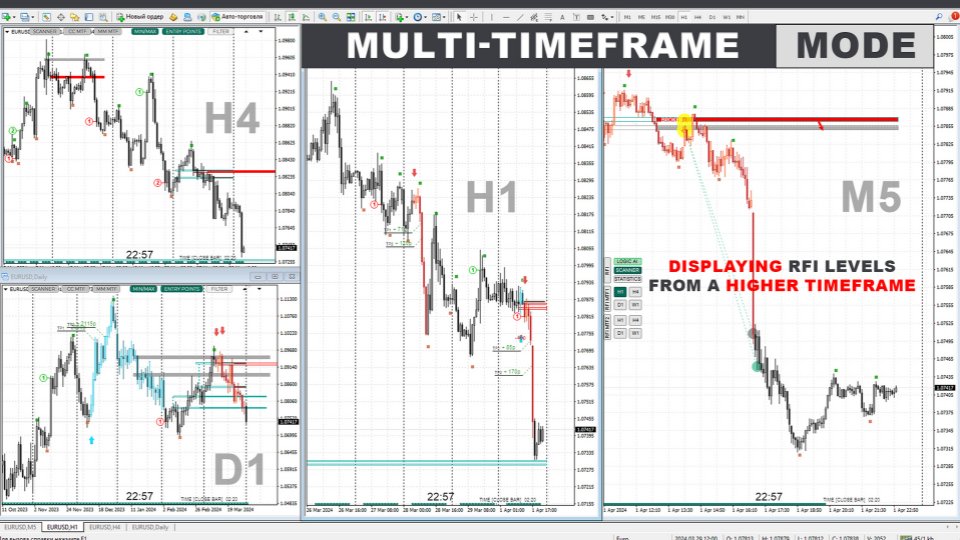
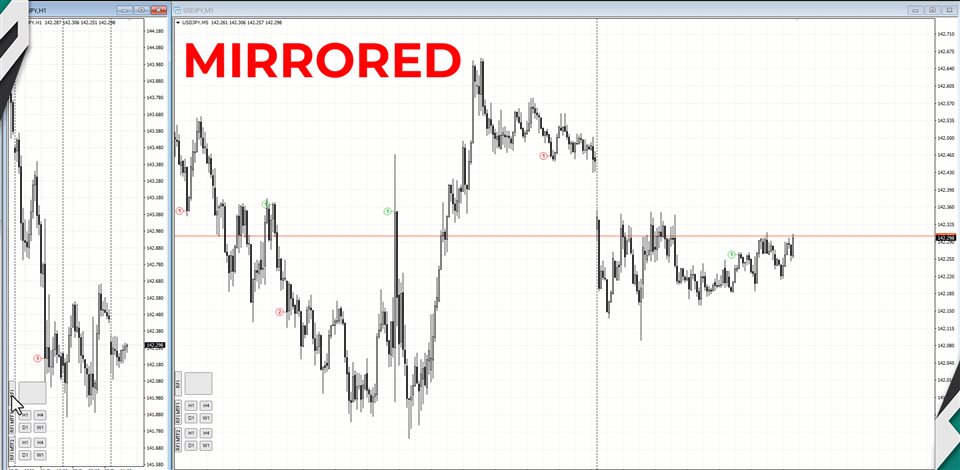
    • 显示更高时间范围内的级别/区域(MTF 模式)
    • 添加了使用更高时间间隔显示级别/区域的功能。此外,该指标还具有自动趋势检测功能( TPSproTREND PRO )。

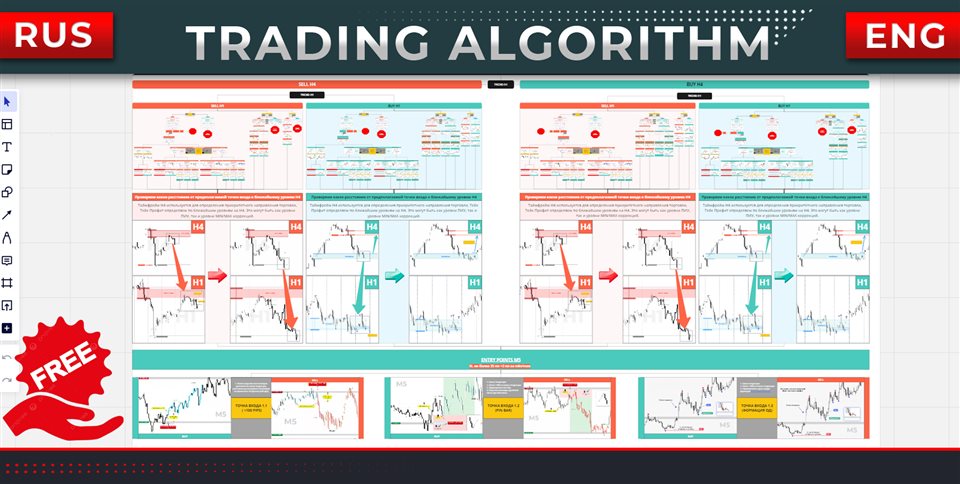
    • 用于交易的单独专业的逐步算法。
    • 该算法专为日内交易而设计,既可顺势交易,也可逆势交易。每个活动模板均提供详细说明。
    • 适用于多种时间范围
    • TPSpro RFI 水平指标可用于图表上的任何时间范围,从一分钟(M1)开始一直到每月(MN)。
    • 图形和声音警报。
    • 该指标提供图形和声音指示,确保您不会错过交易入场信号。还提供手机通知。
    • 简单有效的主动模式扫描仪。
    • 这是一个非常紧凑的活动模式扫描仪,当模式在一个方向上在所有时间范围内激活时,它会自动警报并向您的手机发送通知。
    • 适合专家和初学者。
    • 一步一步的视频指南和说明将通过具体示例解释如何使用指标,即使您是第一次这样做。


    利用该指标您可以:

    • 无论是顺势进入市场还是逆势进入市场,都可以很容易地确定切入点的水平。
    • 高精度地确定任何时间范围内的目标(退出点)。
    • 包括来自更高时间范围的级别(RFI)-MTF 模式。
    • 用于确定交易优先级的模板只有三个。

    热键:

    • R-  显示历史记录中的所有 RFI 级别
    • Z-  隐藏/显示面板
    • 大号  - 显示级别的开始(MTF-2 模式)


    评论 18
    Dennis Boakye Danquah
    326
    Dennis Boakye Danquah 2025.01.15 19:48 
     

    Greatest and most affordable indicator ever .Cheers for this awesome product

    Aravind Kolanupaka
    9060
    Aravind Kolanupaka 2024.11.29 19:33 
     

    Great indicator. Thank you!

    richardholly
    60
    richardholly 2024.11.15 20:38 
     

    Best indicator ever, It is very helpful thank you

    推荐产品
    该指标建立当前报价,可以与历史报价进行比较,并在此基础上进行价格走势预测。指示器有一个文本字段,用于快速导航到所需日期。 选项: 符号 - 选择指标将显示的符号; SymbolPeriod - 选择指标从中获取数据的时段; IndicatorColor - 指示器颜色; HorisontalShift - 由指标绘制的报价移动指定的柱数; Inverse - true 反转引号,false - 原始视图; ChartVerticalShiftStep - 图表垂直移动(键盘上的向上/向下箭头); 接下来是文本字段的设置,您可以在其中输入日期,您可以通过按“回车”立即跳转到该日期。 接下来是文本字段的设置,您可以在其中输入日期,您可以通过按“回车”立即跳转到该日期。
    Introduction to X3 Chart Pattern Scanner X3 Cherart Pattern Scanner is the non-repainting and non-lagging indicator detecting X3 chart patterns including Harmonic pattern, Elliott Wave pattern, X3 patterns, and Japanese Candlestick patterns. Historical patterns match with signal patterns. Hence, you can readily develop the solid trading strategy in your chart. More importantly, this superb pattern scanner can detect the optimal pattern of its kind. In addition, you can switch on and off individu
    PZ The Zone MT5
    PZ TRADING SLU
    This indicator displays buy or sell signals according to Bill Williams' definition of the Trading Zone. [ Installation Guide | Update Guide | Troubleshooting | FAQ | All Products ] Easy to use and understand Avoid trading flat markets Deterministic indicator with clear rules The indicator is non-repainting It implements alerts of all kinds It has straightforward trading implications. A blue arrow is a buy signal A red arrow is a sell signal According to Bill Williams trading in the zone helps t
    Modified Bollinger Bands
    Gennadiy Stanilevych
    The standard Bollinger Bands indicator has been improved by integrating additional indications from the Standard Deviation indicator (StdDev), which gives an additional filter for confirming trading signals. In addition, the color of the indicator's lines shows the beginning of a trend, its development and exhaustion. This indicator has a signal block that notifies the trader of the beginning of the trend on any time frame to which it is attached. Settings Type of messages - select the type of
    Introduction to Chart Pattern MT Chart Pattern MT is a chart pattern scanner to detect the triangle pattern, falling wedge pattern, rising wedge pattern, channel pattern and so on. Chart Pattern MT uses highly sophisticated chart pattern detection algorithm. However, we have designed it in the easy to use with intuitive user interface. Chart Pattern MT will show all the patterns in your chart in the most efficient format for your trading. You do not have to do tedious manual pattern detection an
    Blahtech Market Profile MT5
    Blahtech Limited
    5 (9)
    Was: $249  Now: $149   Market Profile defines a number of day types that can help the trader to determine market behaviour. A key feature is the Value Area, representing the range of price action where 70% of trading took place. Understanding the Value Area can give traders valuable insight into market direction and establish the higher odds trade. It is an excellent addition to any system you may be using. Inspired by Jim Dalton’s book “Mind Over Markets”, this indicator is designed to suit the
    VR Grid Mt5
    Vladimir Pastushak
    3.43 (7)
    VR 网格指示器 设计 用于创建具有用户定义设置的图形网格。与 标准网格 不同,VR 网格用于构建 圆形关卡 。根据用户的选择,轮次级别之间的步长可以是任意的。此外,与其他指标和实用程序不同,即使时间段发生变化或终端重新启动,VR Grid 也能保持网格的位置 。 设置、设置文件、演示版本、说明、问题解决,可以从以下位置获取 [博客] 您可以在以下位置阅读或撰写评论 [关联] 版本为 [MetaTrader 4] 垂直级别 基于实际时间间隔并 忽略缺失 或不存在的周期。因此,级别之间的步长严格对应于用户选择的值。 使用 VR 网格指标时,交易者 可以更改任何级别的垂直线和水平线的样式 、颜色和粗细。这使您可以控制金融工具的 回合水平 。 整数位是 以两个或多个零结尾 的价格(例如:1.23500、5.65900、1923.200)。人们相信,这样的水平 经常充当 作为支撑或阻力的强点。 Horizontal line settings Horizontal line step Horizontal line color Horizontal line style Horizonta
    FREE
    Matreshka
    Dimitr Trifonov
    5 (2)
    Matreshka self-testing and self-optimizing indicator: 1. Is an interpretation of the Elliott Wave Analysis Theory. 2. Based on the principle of the indicator type ZigZag, and the waves are based on the principle of interpretation of the theory of DeMark. 3. Filters waves in length and height. 4. Draws up to six levels of ZigZag at the same time, tracking waves of different orders. 5. Marks Pulsed and Recoil Waves. 6. Draws arrows to open positions 7. Draws three channels. 8. Notes support and re
    This indicator uses a mathematical calculation algorithm . This algorithm calculates the remainder between the updated model and the actual values and produces the possible progress of the graph on the graph. It is not a super prophet in trading, but it is very good for the trader when entering the market and to analyze it before entering. Applicable for all currencies. Данный индикатор использует алгоритм математических вычислений . Данный алгоритм вычисляет остаток между обновленной моделью и
    Chanlun
    Xiaonong Yu
    缠师在新浪博客中以 108 篇博文详细地解释了缠论这一个精妙的数学模型。  “ 缠论 ” 是基于形态学,几何学的一种技术分析理论。这一理论似乎适用于一切具有波动走势的投资市场,比如股票、权证和期货等   。 然而,要应用缠论做交易就必须有足够的时间去正确地画 “ 笔 ” 。可是画 “ 笔 ” 又是一项耗费时间且极易出错误的工作,令众多缠论爱好者痛苦不堪。 本指标依据缠师的缠论原作实现,能够自动且精确地在图表中画出笔、中枢和线段,帮助交易者解决了画笔和线段的烦恼,使得交易者可以直接分析和预测市场走向。 本指标中添加了中枢和线段的选项,可以完整的帮助用户画出缠论中的所有基本构件。 本指标中笔、中枢和线段的颜色、透明度与线宽等,均可由用户自行设定。
    AW Candle Patterns
    AW Trading Software Limited
    AW 蜡烛形态指标是高级趋势指标与强大的蜡烛形态扫描仪的组合。它是识别和突出显示 30 个最可靠的烛台形态的有用工具。此外,它是一个基于彩色条的电流趋势分析器,带有   可调整大小和定位的插件多时间框架趋势面板。根据趋势过滤调整模式显示的独特能力。 优点: 轻松识别蜡烛形态 不重绘结果 内置多时间趋势面板 禁用模式类型(1、2、3 根蜡烛) 显示形态时趋势过滤的调整 显示模式列表: 锤模式 固定/固定 看跌 Harami / 看涨 Harami 看跌 Harami Cross / 看涨 Harami Cross 枢轴点反转向上/枢轴点反转向下 双柱低位收盘价较高/双柱低位收盘价较低 收盘价反转向上 / 收盘价反转向下 中性条 /     两个中性条 双内/内/外 向上推力杆/向下推力杆 晚星/晨星 晚上十字星 / 早上十字星 吞没看跌线/吞没看涨线 镜子酒吧 流星 乌云盖顶 十字星 输入变量: Main settings Trend Filtering Mode - Adjustment of trend filtering when displaying patterns Pat
    Visual Bronze Path Indicator
    AL MOOSAWI ABDULLAH JAFFER BAQER
    Bronze Path Indicator The Bronze Path Indicator is a powerful yet customizable trading tool designed to help traders identify potential market opportunities using advanced technical analysis. This indicator provides a clear visual representation of buy and sell signals, ensuring traders can make informed decisions based on market conditions. Please note that this indicator is not optimized ; it is created for you to fine-tune and optimize it according to your trading strategy and preferenc
    关于指标 该指标基于金融工具收盘价的蒙特卡罗模拟。按照定义,蒙特卡罗是一种统计技术,用于通过基于之前观察的结果的随机数来模拟不同结果的概率。 它是如何工作的? 该指标通过基于历史数据模拟随时间变化的随机价格变动,为证券生成多个价格情景。每次模拟试验使用随机变量来有效地模拟未来在给定时间范围内的市场波动,重点在 收盘价 的波动。 蒙特卡罗模拟的优势 - 蒙特卡罗模拟通过在多种可能的未来情景下进行测试,有助于分析不同交易策略的风险。 - 它有助于确定策略在不同市场条件下的表现,包括罕见的极端事件(尾部风险)。 - 与依赖单点预测不同,蒙特卡罗提供了具有相关概率的潜在结果范围。这有助于理解盈利或亏损的可能性。 对于希望基于不同结果的概率而不是绝对预测来管理风险的交易者来说,蒙特卡罗是一个有用的工具。
    Arrow Hunter Master
    Vitalii Kondratiuk
    Indicator for trend trading Doesn't redraw The algorithm uses reliable and proven time indicators It is recommended to use with common manufacturer's filters as resistance support levels Or standard Bollinger Bands or ZigZag indicators It can also be combined with the RSI indicator to determine whether a currency pair or index is overbought or oversold. The indicator is designed to work on small timeframes from m1 to m15
    Your Pointer
    Nadiya Mirosh
    Your Pointer is no ordinary Forex channel. This corridor is built on the basis of the analysis of several candles, starting from the last one, as a result of which the extremes of the studied interval are determined. They are the ones who create the channel lines. Like all channels, it has a middle line as well as a high and low line. This channel is worth watching for its unusual behavior. The use of the Your Pointer indicator allows the trader to react in time to the price going beyond the bo
    Elliott Wave Trend MT5
    Young Ho Seo
    4 (3)
    Elliott Wave Trend was designed for the scientific wave counting. This tool focuses to get rid of the vagueness of the classic Elliott Wave Counting using the guideline from the template and pattern approach. In doing so, firstly Elliott Wave Trend offers the template for your wave counting. Secondly, it offers Wave Structural Score to assist to identify accurate wave formation. It offers both impulse wave Structural Score and corrective wave Structure Score. Structural Score is the rating to sh
    BoxChart MT5
    Evgeny Shevtsov
    5 (7)
    The market is unfair if only because 10% of participants manage 90% of funds. An ordinary trader has slim changes to stand against these "vultures". This problem can be solved. You just need to be among these 10%, learn to predict their intentions and move with them. Volume is the only preemptive factor that faultlessly works on any timeframe and symbol. First, the volume appears and is accumulated, and only then the price moves. The price moves from one volume to another. Areas of volume accumu
    Golden Spike Premium
    Kwaku Bondzie Ghartey
    Golden Spikes Detector Acknowledgement and Dedications:  The name of this indicator was Inspired by an Original; Mr Grant Koopman; a Knowledgeable and experienced Synthetics trader. I dedicate this indicator to Mr Grant.  Overview:   The Golden Spikes Premium is a groundbreaking trading indicator meticulously crafted for the Boom and Crash indices on the Deriv market. Tailored to meet the needs of discerning traders, this powerful tool operates exclusively on the one-minute timeframe, providing
    Blahtech Supply Demand MT5
    Blahtech Limited
    4.54 (13)
    Was: $299  Now: $149  Supply Demand uses previous price action to identify potential imbalances between buyers and sellers. The key is to identify the better odds zones, not just the untouched ones. Blahtech Supply Demand indicator delivers functionality previously unavailable on any trading platform. This 4-in-1 indicator not only highlights the higher probability zones using a multi-criteria strength engine, but also combines it with multi-timeframe trend analysis, previously confirmed swings
    Prices move for many reasons and these can vary from one operator to another: software, private and institutional traders simultaneously contribute to the formation of the price, making predictive art very difficult. However, there are measurable factors that bind the price to an underlying trend in line with the physical reality that the financial asset represents: these are the macroeconomic indicators. Large investors use this information wisely to set their strategies. Understanding these m
    DYJ TradingView
    Daying Cao
    5 (1)
    DYJ TRADINGVIEW 是一个多指标评级系统,使用评级信号数量和分析工具来发现入场的机会。 DYJ TRADINGVIEW 有10个内置的市场分析指标。 我们使用几种不同的类型,可以很好地相互补充。 使用我们的评级系统关注您喜欢的品种,您可以找到更准确的交易。 参与评级的趋势指标包括 DYJ POWERSIGNAL 、ADX、SMA、布林带。 参与评级的震荡指标包括 MACD、RSI、随机指标、鳄鱼。 当有3个指示器有显示同一方向买入或卖出信号数量大于等于3或更高时,我们开始进入市场交易。 参数 [GENERAL] InpMaxTrendeds = 3 -> 当信号数量大于等于 InpMaxTrendeds 时 此货币对可入场  [TRADINGVIEW]    InpPowerSignalMinPercent = 90   ->   TradeView 最低趋势百分比 InpPowerSignalStrongPercent    =   100   ->   TradeView 强烈趋势百分比 InpPowerSignalMaxPercent   =  100   ->  
    Gioteen Volatility Index (GVI) - your ultimate solution to overcoming market unpredictability and maximizing trading opportunities. This revolutionary indicator helps you in lowering your losing trades due to choppy market movements. The GVI is designed to measure market volatility, providing you with valuable insights to identify the most favorable trading prospects. Its intuitive interface consists of a dynamic red line representing the volatility index, accompanied by blue line that indicate
    Owl Smart Levels MT5
    Sergey Ermolov
    4.07 (28)
    MT4版本  |   FAQ Owl Smart Levels Indicator 是一個完整的交易系統,包含 Bill Williams 的高級分形、構建正確的市場波浪結構的 Valable ZigZag 以及標記準確入場水平的斐波那契水平等流行的市場分析工具 進入市場和地方獲利。 策略的详细说明 指示灯使用说明 顾问-贸易猫头鹰助手助理 私人用户聊天 ->购买后写信给我,我会将您添加到私人聊天中,您可以在那里下载所有奖金 力量在於簡單! Owl Smart Levels 交易系統非常易於使用,因此適合專業人士和剛開始研究市場並為自己選擇交易策略的人。 策略和指標中沒有隱藏的秘密公式和計算方法,所有策略指標都是公開的。 Owl Smart Levels 允許您快速查看進入交易的信號,突出顯示下訂單的水平並向您發送有關已出現信號的通知。 優點很明顯: 清楚地顯示主要和更高時間框架的趨勢方向。 指示儀器信號的出現。 標記開單、止損設置和固定利潤的水平。 沒有多餘的,只有必要的結構! ZigZag 表示全球趨勢的方向,因此也表示貿易方向。 市場反轉點的短線清楚地表明在什麼水平上構建斐波那
    The   Supply and Demand Zones indicator   is one of the best tools we have ever made. This great tool automatically draws supply and demand zones, the best places for opening and closing positions. It has many advanced features such as multi timeframe zones support, displaying the width of zones, alert notifications for retouched zones, and much more. Because of market fractality, this indicator can be used for any kind of trading. Whether you are a positional, swing, or intraday trader does no
    Introducing "X Marks the Spot" – Your Ultimate MetaTrader 5 Indicator for Perfect Trades! Are you tired of the guesswork in trading? Ready to take your MetaTrader 5 experience to a whole new level? Look no further – "X Marks the Spot" is here to revolutionize your trading strategy! What is "X Marks the Spot"? "X Marks the Spot" is not just another indicator – it's your personal trading compass that works seamlessly on all timeframes . Whether you're a beginner or an experienced trader,
    Introduction to Smart Renko The main characteristics of Renko Charting concern price movement. To give you some idea on its working principle, Renko chart is constructed by placing a brick over or below when the price make the movement beyond a predefined range, called brick height. Therefore, naturally one can see clear price movement with less noise than other charting type. Renko charting can provide much clearer trend direction and it helps to identify important support and resistance level
    Banana Binary MT5 Signal
    Nirundorn Promphao
    1 (1)
    Promotion $66 lifetime for you. The principle of this indicator is very simple: detecting the trend with Moving Average, then monitoring the return point of graph by using the crossing of Stochastic Oscillator and finally predicting BUY and SELL signal with arrows, alerts and notifications. The parameters are fixed and automatically calculated on each time frame. Example: If you install indicator on EURUSD, timeframe M5: the indicator will detect the main trend with the Moving Average on this ti
    KopierMaschine - локальный копировщик сделок между различными счетами MetaTrader 4 и MetaTrader 5 в любом направлении расположенных на одном компьютере с интуитивно понятным интерфейсом. Направления копирования: MT4 --> MT5 MT4 --> MT4 MT5 --> MT5 MT5 --> MT4 для копирования между терминалами MetaTrader 4 и   MetaTrader   5 необходимо приобрести версию продукта   KopierMaschine  для    MetaTrader  4 Особенности Программа работает в двух режимах Master и Slave На один подчиненный счет можно копир
    Inputs controller
    Maryna Shulzhenko
    I want again that the wedge light on all the indicators did not converge. No matter how hard you search, you still will not find an indicator that will always and in all conditions give you exclusively profitable signals. As you can see, everything is quite simple, and you don’t even need to analyze anything, in fact. In general, I would say that the Signal No Problem indicator can be a great help for creating your own trading system. It goes without saying that you don’t need to trade only by a
    该产品的买家也购买
    TrendMaestro5
    Stefano Frisetti
    note: this indicator is for METATRADER4, if you want the version for METATRADER5 this is the link:  https://www.mql5.com/it/market/product/108106 TRENDMAESTRO ver 2.4 TRENDMAESTRO recognizes a new TREND in the bud, he never makes mistakes. The certainty of identifying a new TREND is priceless. DESCRIPTION TRENDMAESTRO identifies a new TREND in the bud, this indicator examines the volatility, volumes and momentum to identify the moment in which there is an explosion of one or more of these data a
    FxaccurateLS
    Shiv Raj Kumawat
    WHY IS OUR FXACCCURATE LS MT5 THE PROFITABLE ? PROTECT YOUR CAPITAL WITH RISK MANAGEMENT Gives entry, stop and target levels from time to time. It finds Trading opportunities by analyzing what the price is doing during established trends. POWERFUL INDICATOR FOR A RELIABLE STRATEGIES We have made these indicators with a lot of years of hard work. It is made at a very advanced level. Established trends provide dozens of trading opportunities, but most trend indicators completely ignore them! The
    Big Player Range
    Thalles Nascimento De Carvalho
    5 (2)
    释放 "BigPlayerRange" 的力量:市场技术分析的利器 我们隆重推出 BigPlayerRange ,一款先进的技术分析工具,专为揭示 市场中机构投资者的兴趣区域 而设计。借助该工具,您可以精准识别大玩家的活跃区域,从而提升您的交易策略的效果。 主要特性: 机构兴趣区域映射 : BigPlayerRange 突出显示金融机构的高活动区域,提供关于市场可能走势的重要见解。 目标退出点的预测 :此指标使用两步预测建议潜在退出点,助您基于价格未来方向规划策略。 回调概率分析 :评估当价格回到识别范围时的 回调概率 ,此功能有助于风险管理和策略调整。 如何使用 BigPlayerRange: 识别兴趣区域 :利用此指标锁定机构活跃的关键区域,从而预测重要市场变动。 目标退出点的预测 :根据指标提供的预测制定退出决策,以实现策略性平仓。 回调概率评估 :监测价格回到兴趣范围时的回调可能性,并据此调整策略。 核心触发点:监控价格相对于绿色和红色线的位置 BigPlayerRange 的中心区域 展示了 机构集中的市场能量 。监控价格相对于 绿色和
    Seconds Charts
    Aleksandr Goryachev
    Micro  ******************* Секундные графики MT5 ********************** Более точного инструмента для входа в сделку вы не найдёте. Входные параметры: Timeframe, sek - период построения графика, секунды Displayed bars - отображаемые бары Step of price levels, pp, 0-off - шаг отрисовки ценовых уровней, пункты Scale points per bar, 0-off - масштаб в пунктах на бар Show lines - отображение текущих уровней Show comment - отображение комментария Standard color scheme - стандартная цветовая сх
    当然可以!以下是您提供的文本的中文翻译: 引入   MT4 / MT5 天文指标:您的终极天体交易伙伴 您准备好将交易体验提升到天文高度了吗?不用再寻找,就在我们的革命性 MT4 天文指标中。这个创新工具超越了传统的交易指标,利用复杂的算法提供无与伦比的天文洞察力和精确计算。 指尖上的宇宙信息:   瞻仰一个详尽的面板,展示了一宝藏般的天文数据。了解行星的地理/太阳心坐标,太阳/地球距离,亮度,伸长度,星座,黄道和赤道坐标,甚至是水平坐标——每个细节都经过精心计算并呈现得美轮美奂。指标生成的垂直线对应于时间值,为您的交易旅程提供了宇宙的视角。 行星线条与关系:   在您的图表上欣赏行星线条的魔力,具有可自定义的比例和角度。通过直观的控制面板轻松切换每个行星线条的可见性。通过连结、六分、四分、三分、对冲和逆行等指标,发现行星关系的艺术。在您选择的时间范围内探索这些宇宙构造,使您能够识别重要的交易机会。 揭示甘恩的智慧:   通过受甘恩启发的平方垂直线揭示潜在的反转时机。这种创新修改将甘恩历经考验的原则带入现实,帮助您提前了解市场的转向和趋势。 月亮引导:   在您的图表上优雅地导航月相,
    Bill Williams Advanced
    Siarhei Vashchylka
    5 (9)
    Bill Williams Advanced is designed for automatic chart analysis using Bill Williams' "Profitunity" system. The indicator analyzes four timeframes at once. Manual (Be sure to read before purchasing) Advantages 1. Automatically analyzes the chart using the "Profitunity" system of Bill Williams. The found signals are placed in a table in the corner of the screen. 2. Equipped with a trend filter based on the Alligator indicator. Most of the system signals are recommended to be used only according t
    CBT Quantum Maverick 高效的二元期权交易系统 CBT Quantum Maverick 是一款精心设计的高性能二元期权交易系统,专为追求精准、简单和纪律的交易者打造。无需自定义,该系统经过优化,可直接使用并产生高效结果。只需遵循信号操作,稍加练习即可掌握。 主要特点: 信号精准度: 基于当前K线生成下根K线交易信号,无频繁重绘。 市场多样性: 专为二元期权交易设计,兼容多种经纪商和资产类别,适应不同交易偏好。 兼容性: Deriv Synthetic Charts :适用于任何时间框架。 OTC Charts :来自如 Quotex、PocketOption、Binomo、Stockity、IQOption、Exnova、OlympTrade、Deriv、Binolla 和 Homebroker 的经纪商,可导入 MT5(一周内提供免费导入支持,之后需支付服务费用)。 外汇、加密货币和商品市场 :扩展资产利用。 高收益二元资产 :建议使用90%以上的高回报率资产。 额外优势: 全面的交易计划: 提供系统化和纪律性交易的分步支持计划。 高效时间利用: 每天仅需一
    IVISTscalp5
    Vadym Zhukovskyi
    5 (6)
    我们向您介绍iVISTscalp5指标,它不仅独特,而且在交易操作中也非常有效。该指标基于时间数据,是多年金融市场经验和深入分析的结果。iVISTscalp5指标是手动交易的优秀工具。便利性、简单性和可视化 - 所有的复杂性都隐藏在内部。我们将iVISTscalp5指标的设置和使用简化到了最大程度。该指标适用于MT5终端中您所拥有的所有金融工具。 操作时间为UTC+3的早上4点到晚上8点。 iVISTscalp5指标菜单(见截图1): History - 计算行情的周数 dT_min - 选择时间间隔的时间(分钟) TFline - 绘制水平成交量(时间帧) BARSline - 绘制水平成交量(条数) TFtrend1 - 绘制日线通道(时间帧) BARStrend1 - 绘制日线通道(条数) TFtrend2 - 绘制周线通道(时间帧) BARStrend2 - 绘制周线通道(条数) ALERT_TIMER - 设置闹钟 ALERT - 开启/关闭闹钟 Save - 开启/关闭将时间记录到文本文件。 图表上的红色和蓝色旗帜表示时间(VIST智能剃须系统的信号)。卖出信号为红旗,买入
    EXCLUSIVE! JUST  10 COPIES  AVAILABLE!  3 LEFT!  BONUS AUX VIP Club 2024 : Include EA CAP, CEP, LDH, PSC307 & AO4C to enhance the performance of this tool to its maximum potential  Click Here to Download Files   ( for users only ) FREE Trading Education Available Daily via Zoom --- For More Info or Instant Message Click link ---  https://t.me/abcdwave Transform your trading with the "Five Magic Bullets" Indicator, tailored for traders who embrace the power of Elliott Wave Chaos
    SMCpro
    Arief
    5 (2)
    Indicator USER MANUAL, trade setups, solving issues, etc :  Direct Download Here     ( for users only ) Hello World! Introducing.. SMCpro tool and Indicator for  MetaTrader 5 , a cutting-edge feature designed to revolutionize your trading experience. With innovative ICT Smart Money Concept, you gain unparalleled insight into market dynamics, empowering you to make informed trading decisions like never before. SMC Indicator built on the foundation of advanced algorithms and real-time dat
    The indicator is designed to close positions on the market in time. For example: to take profits ahead of schedule if the price has not reached TakeProfit, and the market is turning around. The indicator analyzes the momentum, not the trend. He does not give any information about the trend. The indicator is well suited for finding divergence. The Ershov 38 Parrots indicator dynamically adjusts to the market and detects price movement impulses of medium and high amplitude. It almost does not rea
    Happy entries
    Godwill Fortune Otieno Juma
    The  product gives optimized entries for 3min ,1 hr and day timeframes  Does well with indices  ASIAN- HK50 AND CHINA A50 USA-US30,US100,US500 GER40 ,UK100 For stocks trade with the day timeframes Happy Entry employs advanced algorithms and real-time data analysis to identify optimal entry points with unprecedented accuracy. Its adaptive nature allows it to seamlessly adjust to changing market conditions, ensuring you never miss out on profitable opportunities. Whether you're a beginner or seas
    GannRS Trend Scalper   GannRS is an advanced trading tool based on Gann Law and Supports and Resistances. designed to have an   active trading at any time not lagging Indications are given at the beginning of a new candle Please watch the full tutorial video. How to use GannRS Very easy to set up... Put it on your chart Adjust inputs Inputs Show Resistance and support : [bool]  true = Shows R/S on chart false = does not show Show Levels :[bool]  true = Shows levels on the chart false = does n
    VTrende Pro
    Andrii Diachenko
    5 (1)
    VTrende Pro - MTF indicator for trend trading with a display panel for MT5 *** Videos can be translated into any language using subtitles (video language - Russian) Although the signals of the VTrende Pro indicator can be used as signals of a full-fledged trading system, it is recommended to use them in conjunction with the Bill Williams TS. VTrende Pro is an extended version of the VTrende indicator. Difference between Pro version and VTrende: - Time zones - Signal V - signal 1-2 waves -    S
    Satoro mt5
    Mykhailo Lozhkin
    5 (1)
    An indicator based on time-tested trading methods that gives a signal that the market is overbought or oversold in a certain period of time The indicator does not disappear when it appears, easy to use Suitable for any trade It can be used on any currency pair or crypto He performed best in the period H1,H4,daily After the purchase, you will also receive a seller's template with settings The seller uses it more for trading on cryptocurrency After the purchase, I also keep in touch with c
    Market DNA
    Arief
    5 (1)
    BONUS AUX VIP Club 2024 : Include EA Check Endpoint, EA Trade Manager, etc to enhance the performance of this tool to its maximum potential Click Here to Download Files ( for users only ) FREE Trading Education Available Daily via Zoom --- For More Info or Instant Message Click link --- https://t.me/abcdwave Direct analysis from several students on the t.me/FXGoldWatch Telegram Public Channel The Breakthrough  PREMIUM  Trading Tool & Indicator for Elliott Wave Chaos Th
    Go Way TREND
    Ywsf Hsyn Hmad Alrsh
    順應潮流。是的,在 15 分鐘的框架上等待進場信號,無論是買入還是賣出,並檢查信號是否出現在 30 分鐘的框架上(有時信號需要一個小時或更長時間才會出現。您可以返回到15分鐘框架並返回到30分鐘框架,重複此操作,直到主要訊號出現在您面前。被記錄,或當相反的訊號出現時它非常簡單並且適用於所有主要貨幣。  金屬、指標和所有框架,但最好的結果是 30 分鐘框架。 始終將止損設置在蠟燭底部下方,資金管理不得超過 資本的10% 順應潮流。是的,在 15 分鐘的框架上等待進場信號,無論是買入還是賣出,並檢查信號是否出現在 30 分鐘的框架上(有時信號需要一個小時或更長時間才會出現。您可以返回到15分鐘框架並返回到30分鐘框架,重複此操作,直到主要訊號出現在您面前。被記錄,或當相反的訊號出現時它非常簡單並且適用於所有主要貨幣。  金屬、指標和所有框架,但最好的結果是 30 分鐘框架。 始終將止損設置在蠟燭底部下方,資金管理不得超過 資本的10% 順應潮流。是的,在 15 分鐘的框架上等待進場信號,無論是買入還是賣出,並檢查信號是否出現在 30 分鐘的框架上(有時信號需要一個小時或更長時間才會
    Piranha version 2
    Maria Strudov
    5 (1)
    "Piranha" - an autonomous trading system that determines overbought and oversold levels on the chart. Red and blue zones represent overbought and oversold levels respectively. Entry points are marked with arrows: a downward arrow in the red zone for "sell" and an upward arrow in the blue zone for "buy". The Take profit level is indicated by the green moving average. Key features: Adjusting the Take profit level as the green moving average changes position. Averaging ability when a new market e
    這是二元期權的指標。它透過移動平均訊號確認來計算吞沒蠟燭。綠色買入和紅色賣出箭頭顯示在圖表上。 它已在 3 分鐘和 5 分鐘圖表上對多個貨幣對(歐元/美元、歐元/日元、美元/日元...等)進行了測試。它也適用於 Pocketoption OTC 市場,例如 EUR/JPY OTC 和 EUR/USD OTC。 對於初學者來說, 如果您使用 martingale,那麼建議的設定是, 初始投資:1.00 美元 馬丁格乘數:2.5 馬丁格步驟:5 對專家交易者來說, 如果您使用 Martingale,那麼您的初始投資將根據您的風險管理策略來決定。但我強烈推薦 2.5 乘數並將步數保持在 5。 該指標可能不會達到第五步,但您需要給自己一些指標買賣的空間。 請參閱隨附的螢幕截圖。和  如果您有任何疑問,請隨時與我聯繫。 請繼續關註二元期權的更多指標。
    Carnaval mt5
    Petro Lytvynov
    This is an indicator that includes the best basic forex indicators, without redrawing. Based on this data, a sell or buy signal is generated. It does not disappear anywhere after the signal, which gives us the opportunity to see the results on the history. It can be used on any currency pair, crypto, metals, stocks It is best used on an hourly chart, but other periods are also acceptable. The best results for the period H1,H4,daily If customers have any questions, I will answer them and aft
    Scalping Fast2
    Ywsf Hsyn Hmad Alrsh
    This factor is traded on the 5M five-minute frame Please see the explanations in the attached images Trading is done according to the trend. If the trend is upward, we buy only when the red line is touched If the trend is downward, we sell only when the blue line is touched In the case of a sideways trend, we can sell when the blue line is touched and buy when the red line is touched When the price reaches the red buy line or the sell line from above, we enter a deal and stop the loss at 5
    Price Action Scanner Pro 是一款识别价格行为并给予提醒的指标 , 它比 Price Action Scanner 能提供更多的功能与配置 . 这款指标可以同时检测最多15个品种 , 不同时间周期的信号 . 你可以分别设置亚盘时间 , 欧盘时间 , 美盘时间 , 检测的时间周期 , 这样就能在交易频繁的时段使用小级别的信号来判断入场时机 , 在交易不频繁的时段使用较大级别的信号来判断入场时机 . 通过设置分隔符 , 来添加不同的品种名称 , 不同的时间周期 .  指标可以设定检测多种常见信号种类 , 有 Pinbar , 吞没形态 , 孕线形态 , 启明星 , 黄昏之星 , Fakey , 在单独的副图里面显示出对应的信息 , 并提示出信号的方向 . 你可以点击对应的 Open Chart 按钮 , 显示出这个品种的 chart , 便于更好的观察 . 你也可以设置每种信号的颜色 , 显示的大小 .  在显示方面 , 也做了升级 . 你可以根据屏幕分辨率的大小 , 选择显示两列 , 三列 , 还是四列内容 , 同时可以调整显示的字体大小 . 信号已经对趋势进行了
    GannTools
    issam rahhal sabour
    GannTools Indicator The GannTools Indicator is a powerful trading tool inspired by W.D. Gann's strategies. This indicator provides traders with dynamic support and resistance levels, trend analysis, and key price patterns using Gann angles and cycles. Key Features: Customizable Gann Fans, Angles, and Cycles for precise market analysis. Automatic identification of key price levels and trend directions. Works on all timeframes and instruments for flexible trading strategies. Integrated visualiza
    How to use Pair Trading Station Pair Trading Station is recommended for H1 time frame and you can use it for any currency pairs. To generate buy and sell signal, follow few steps below to apply Pair Trading Station to your MetaTrader terminal. When you load Pair Trading Station on your chart, Pair Trading station will assess available historical data in your MetaTrader platforms for each currency pair. On your chart, the amount of historical data available will be displayed for each currency pai
    XCalper TFO
    Aecio de Feo Flora Neto
    This oscillator was developed exclusively by xCalper in 2015 based on moving averages calculations to indicate and try predicting oversold and overbought levels. The fast line (white, by default) oscillates basically between values -0.5 (oversold) and +0.5 (overbought). Whenever this line crosses upward value -0.5, it means an oversold price level. When it crosses downward value +0.5, it means an overbought price level. When fast line crosses value 0.0 and returns, it is a strong pull-back indic
    Smooth price for Monarch
    Konstantin Gruzdev
    5 (1)
    The Smooth Price technical indicator is used for plotting a smoothed line as close to the price of the financial instrument as possible, and serves to eliminate its noise components. The indicator is part of the Monarch trading system, but here it is presented as an independent technical analysis tool. The indicator is based on the cluster digital filter , which, unlike the ClusterSMA , is applied directly to the price time series. Smooth Price does not redraw (except the very last, zero bar) an
    Классификатор силы тренда. Показания на истории не меняет. Изменяется классификация только незакрытого бара. По идее подобен полной системе ASCTrend, сигнальный модуль которой, точнее его аппроксимация в несколько "урезанном" виде, есть в свободном доступе, а также в терминале как сигнальный индикатор SilverTrend . Точной копией системы ASCTrend не является. Работает на всех инструментах и всех временных диапазонах. Индикатор использует несколько некоррелируемых между собой алгоритмов для класси
    Currency Index Watcher is a simple and user-friendly tool for whoever wish to trade Forex using currencies indexes. Currency Index Watcher is configurable and usable directly from the panel. Indexes of 8 custom currencies EUR, USD, GBP, JPY, CHF, AUD, CAD, NZD (default) Any 3-chars symbol from your market watch could be used (BTC = bitcoin, RUB = ruble, CNH = yuan etc ...) : double click the symbol label  Ability to select which currencies and made-of pairs will be analyzed : check/uncheck wante
    Forex Relative Performance indicator This indicator calculates the relative strength of major currencies against the US dollar. The basic idea behind this indicator is "to buy strong currency and to sell weak currency". This indicator allows you to quickly identify the best forex pair to trade according to your trading style (Intraday, Scalping, Swing, or Long Term)
    Powerful Hidden Cross Signal
    Ellan Dirgantara Tholkhah
    The latest most requested Binary Options arrow indicator in the Garuda Signals product line is now on MT5! Binary options signal based on multiple time frame cross over analysis. Gets confirmation from the most consistent signals known to man; Ichimoku, SMA, Bollinger Bands; and also uses the 1 Hour time frame as trend confirmation , so you don't have to open up multiple chart and waste time. - Can be used for all time frames up to 1 hour, but is most POWERFUL for 1 and 5 min options. - Place yo
    作者的更多信息
    TPSproTREND PrO MT5
    Roman Podpora
    4.54 (13)
    TPSproTREND PrO
    Roman Podpora
    4.79 (19)
    TPSpro TREND PRO 是一个趋势指标,可以自动分析市场并提供有关趋势及其每次变化的信息,并给出进入交易的信号而无需重新绘制! 该指标使用每根蜡烛,分别对其进行分析。指不同的脉冲——向上或向下脉冲。货币、加密货币、金属、股票、指数交易的准确切入点! MT5版本                 指标的完整描述   我们建议将其与 指示器 -   RFI LEVELS 一起使用 主要功能: 准确的输入信号,无需渲染! 如果出现信号,它仍然相关!这是与重提指标的一个重要区别,重提指标可以提供信号然后改变信号,这可能导致存款资金的损失。现在您可以以更高的概率和准确度进入市场。还有一个功能是在箭头出现后为蜡烛着色,直到达到目标(止盈)或出现反转信号。 显示止损/获利区域 为了提高搜索切入点时的视觉清晰度,创建了一个模块,该模块最初显示买入/卖出区域,在该区域中搜索进入市场的最佳点。用于处理止损水平的附加智能逻辑有助于随着时间的推移减小其大小,从而降低进入交易(移动 sl)时的初始风险。 显示较高时间范围内的最小值/最大值(MTF 模式) 添加了一项功能,可以显示较高时间间隔的最小/最
    TPSpro RFI Levels
    Roman Podpora
    4.82 (22)
    指示       俄罗斯 -        英语   建议 与指示器一起使用     -       TPSpro 趋势专业版 -   MT4版本       交易中的一个关键要素是做出买卖交易工具决定的区域或水平。尽管主要参与者试图隐藏他们在市场中的存在,但他们不可避免地会留下痕迹。我们的任务是学习如何识别这些痕迹并正确解释它们。 主要功能: 向卖家和买家显示活跃区域! 该指标显示所有正确的初始买入和卖出脉冲水平/区域。激活这些水平/区域后,开始寻找切入点,水平会改变颜色并填充特定阴影。此外,还会显示箭头,以便更直观地了解情况。 显示更高时间范围内的级别/区域(MTF 模式) 添加了使用更高时间间隔显示级别/区域的功能。此外,该指标还具有自动趋势检测功能(   TPSproTREND PRO   )。 用于交易的单独专业的逐步算法。 该算法专为日内交易而设计,既可顺势交易,也可逆势交易。每个活动模板均提供详细说明。 适用于多种时间范围 。 TPSpro RFI 水平指标可用于图表上的任何时间范围,从一分钟(M1)开始一直到每月(MN)。 图形和声音警报。 该指标提供图形和声音指示,
    TPSpro Trade PRO
    Roman Podpora
    4.6 (5)
    下载演示版本 说明 -  https://www.mql5.com/ru/blogs/post/758419 一款能够根据给定的止损水平即时计算头寸规模或风险的工具对于专业交易员和新手交易员来说都至关重要。TRADE PRO 交易实用程序提供快速准确的计算,帮助您在时间敏感且波动的市场中做出决策。 主要功能: 原创。简单。有效。 原始、方便地打开主交易面板:将鼠标移到图表右侧,然后单击适当的方向即可下达未来订单。 快速安装市价单 使用 TRADE PRO 设置您的余额或资本的风险百分比,或指定具体的风险金额。在图表上直观地定义止损水平,让该工具自动计算每种货币对的最佳头寸规模。该工具还可以根据指定的风险/回报率自动设置利润目标(止盈)。 下达多个限价订单以分担总风险     (网格模式)。 无论您进行多笔买入或卖出交易还是遵循网格策略,交易面板都提供了下达多笔限价订单的功能,让您可以将主要风险分散到各个部分,并可进行调整。 在现有的市价单上添加额外的限价单。 为了您的方便,如果您已经有未结订单,我们添加了一项功能,可让您快速添加更多具有共同止损和止盈的限价订单。 设置额外的获利水平,
    Show Pips for MT5
    Roman Podpora
    4.67 (21)
    对于那些总是想了解帐户当前情况的人来说,此信息指示器将很有用。 -   更多有用的指标 该指标显示诸如利润点数、百分比和货币等数据,以及当前货币对的点差以及柱在当前时间范围内收盘的时间。 有多种选项可用于将信息线放置在图表上: 价格右侧(运行在价格后面); 作为评论(在图表的左上角); 在屏幕的选定角落。 还可以选择信息分隔符: | / \ # 该指标易于使用且信息丰富。可以在设置中禁用不必要的信息项目。 设置 外观类型     - 信息行的显示类型。有以下三种选择: 跟随价格     - 遵循价格; 作为评论     - 作为评论; 在屏幕的选定角落     - 在屏幕的选定角落。 附件图角     - 如果您选择屏幕选定角的显示类型,则此项目允许您选择四个捕捉角之一; 显示利润?       - 该参数负责以存款货币显示利润; 以百分比显示利润?       - 该参数负责以百分比形式显示利润; 显示传播?       - 该参数负责显示当前点差; 显示酒吧关闭时间?       - 该参数负责显示柱关闭之前的时间; 文字颜色     - 文字颜色; 盈利颜色     - 存在
    FREE
    Show Pips
    Roman Podpora
    4.24 (54)
    对于那些总是想了解帐户当前情况的人来说,此信息指示器将很有用。该指标显示诸如利润点数、百分比和货币等数据,以及当前货币对的点差以及柱在当前时间范围内收盘的时间。 MT5版本 -   更多有用的指标 有多种选项可用于在图表上放置信息线: 价格右侧(运行在价格后面); 作为评论(在图表的左上角); 在屏幕的选定角落。 还可以选择信息分隔符: | / 。 \ # 该指标具有内置热键: 键 1 - 退一步显示信息类型(价格、评论或角落的右侧) 关键2——信息显示类型的进步 键 3 - 更改信息行显示的位置 可以在设置中重新分配热键。 该指标易于使用且信息丰富。可以在设置中禁用不必要的信息项目。 设置 替换显示信息的热键(向后)   - 后退信息显示类型 用于替换显示信息的热键(前进)       - 信息显示类型向前迈进了一步 用于更改外观/角信息字符串类型的热键     - 更改信息行显示的位置 文字颜色     - 文字颜色 盈利颜色     - 有浮动利润时的文字颜色 失色     - 存在浮动损失时的文本颜色 分离器     - 一行中的数据分隔符。可以采用五个值:“|”、“/”、
    FREE
    Color Levels
    Roman Podpora
    4.83 (30)
    Color Levels is a convenient tool for traders using a Trendline and a Rectangle in their technical analysis. It allows setting two empty rectangles, three filled ones, and two tredlines. The indicator parameters are very simple and divided into numbered blocks: The ones beginning with 1 and 2 - empty rectangle (frame) parameters; 3, 4, and 5 - filled rectangle parameters; 6 and 7 - trendline parameters. Simply click a desired object and it will appear in the upper left corner. Main Adjustable Pa
    FREE
    TPSproDraW
    Roman Podpora
    4.56 (16)
    The TPSproDraW indicator allows to draw continuous zigzag lines on the chart. This handy tool will strike fancy of those traders who trade using technical analysis and need visual expression to forecast the price movement. A drawn continuous zigzag line can be removed as easily as it is drawn - just aim a mouse cursor to the zigzag line and press the Shift key. How it helps: The Z key - double press to enable the mode of drawing patterns, press one time to disable the mode, Esc - cancel drawn ob
    FREE
    Terminal
    Roman Podpora
    4 (5)
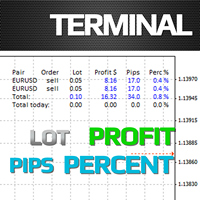
    The Terminal indicator is a substitution for the standard Terminal tab. The indicator is displayed as a kind of table consisting of several elements: A row with column descriptions; Open orders; Summary information of open orders; Summary information of current day closed orders. The indicator settings: Graph corner for attachment - the corner of the chart where the table will be positioned Font - font type Fontsize - font size Text color - display settings Profit color - display settings Loss c
    FREE
    TPSpro Risk Manager Panel is a convenient tool for anyone who wants to keep track of the current account state. The panel is part of our risk management system, and is included into our more powerful product TPSpro Risk Manager . The panel has three columns containing useful information. The first column contains the information about the account state as of the beginning of the month, i.e. the overall result is shown as a percentage and in the deposit currency. The second column shows the daily
    FREE
    TPSpro Screenshot is an indicator that screenshots the chart workspace and saves it to a folder you specify on your computer with a specified resolution and at a specified time interval. The following configurable parameters are available: Screenshot Width - Screenshot width Screenshot Height -Screenshot height The name of the folder for screenshots (by pressing "]") - The name of the folder for screenshots Rewritable File Name - Name of the file being rewritten Step in seconds for a photo - Ste
    FREE
    TradePanel Pro
    Roman Podpora
    3.67 (3)
    此 PRO 版交易面板简化了那些根据止损大小和存款负荷进行资金管理的人的交易。对于那些需要开单而又不想浪费时间计算手数的人来说,这是一个方便的工具。风险和止损值可以在面板本身的字段中设置,从而减少了设置所需手数的时间。在设置中可视选择的 MM 类型在面板上显示为阻止输入的字段之一:对于启用的 MM,手数字段不可用,对于禁用的 MM,风险 (%) 字段不可用。 PRO 版本具有手数划分的优势。例如,计算的手数为 0.18,在设置中,打开两个订单?(手数/2)参数设置为 true,则顾问将打开两个订单,每个订单的手数将等于 0.09。其中一个订单的止盈等于止损 + 2 pp,考虑到点差和佣金。第二个订单的止盈不设,可通过单击面板底部的两个按钮之一进行调整。 默认情况下,顾问包括一个简单的追踪止损和一个转至盈亏平衡。但通常,您只需要使用其中之一。顾问具有响应按下热键的内置功能(可以在设置中更改),即: '~' - 显示/隐藏带有待处理止损订单和限价订单的附加面板。 ‘s’ – 将面板移动到货币对窗口的角落。 带有挂单的附加面板由两行组成: 停止订单及其删除按钮; 限价订单及其删除按钮。 挂单
    TPSpro Risk Manager
    Roman Podpora
    3.67 (3)
    TPSpro 风险管理器   是一个独特的专业风险控制系统,适用于任何培训和任何资本的交易者。让您避免交易中的损失和交易中的严重错误。 TPSpro 风险管理器对于风险管理是必要的,主要是对于剥头皮交易者和日间交易者而言,但任何交易风格的交易者都可以成功使用。 该面板有 3 列,每一列都包含有用的信息。 第一列显示截至当月初的账户信息,即以百分比和存款币种显示总体结果。 第二列显示设置中指定日期的风险。 第三列显示当前账户情况。 如果一天超过规定的风险或超过订单数量,顾问将关闭所有订单,并且不允许开设新订单,从而保护交易者免受“情绪交易”的影响。 “风险管理器”允许您根据以下参数控制交易: 每日损失限额 余额损失限额 交易数量限制 单一方向交易数量限制(网格保护) 连续亏损交易后被迫止损 连续两天亏损后,交易将被锁定一天 风险管理系统允许交易者: 保持每日利润 在线查看您的交易统计数据 理顺交易纪律,显着提高盈利能力(摆脱“倾斜”和“网格”) 查看当前资金并考虑经纪佣金 为了使风险经理能够满负荷工作,它必须位于远程 VPS 或任何其他偏远的地方,在情绪爆发时交易者无法快速到达并干扰
    This copier was originally developed for the professional order management of a team of traders and therefore, first of all, a risk manager was built into it. For simple operation, you need to configure the following settings: For the master! 1. Select the program type ''Program mode'' - master 2. Enter a new name for the ''Folder name'' folder, in which the EA will record information on working with orders. The name must be the same for both master and slave!!! 3. In the ''Feedback from the
    筛选:
    Dennis Boakye Danquah
    326
    Dennis Boakye Danquah 2025.01.15 19:48 
     

    Greatest and most affordable indicator ever .Cheers for this awesome product

    jajajak12
    129
    jajajak12 2024.12.05 08:03 
     

    The indicator by itself is good, the main problem is whenever u dont understand how u to use it and need some help, u dont get any answer or solution from the developer. meanwhile the youtube videos is on russian and the auto translate not doing good at translating. so unless u figure it out how to work by yourself, it will take a work to understand how the indicator works

    Roman Podpora
    102061
    来自开发人员的回复 Roman Podpora 2024.12.05 08:44
    All clients in this group receive support - https://t.me/SCHOOL_of_TPSRO/2194. And you got it too. Why lie to yourself is unclear to me.
    Aravind Kolanupaka
    9060
    Aravind Kolanupaka 2024.11.29 19:33 
     

    Great indicator. Thank you!

    Roman Podpora
    102061
    来自开发人员的回复 Roman Podpora 2024.12.05 08:44
    Thank you for your feedback) I’m very pleased
    richardholly
    60
    richardholly 2024.11.15 20:38 
     

    Best indicator ever, It is very helpful thank you

    Roman Podpora
    102061
    来自开发人员的回复 Roman Podpora 2024.11.15 20:51
    Thanks a lot)! Trading statistics will soon be available on our website, in addition to the signals service)
    Furnharkwen Mayer
    90
    Furnharkwen Mayer 2024.11.12 11:30 
     

    Unfortunately, I have to revise my original review of the **TPSpro RFI Levels** indicator, as its performance and results do not meet my expectations. Initially, the indicator seemed promising and supportive for my Smart Money Concept (SMC) strategies, but after extensive use, a different picture has emerged. **Problems and Criticisms:** 1. **Inconsistent Signals:** The signals generated by the indicator are neither clearly defined nor consistent. There is a lack of clear entry and exit points, which are essential for SMC traders. Often, it is recommended to wait for confirmations before acting on a signal, but these confirmations are unreliable, and many signals fail to meet even the provider's own criteria. 2. **Complexity Without Added Value:** The indicator requires numerous settings, complex training, and "basic strategies" that ultimately confuse rather than support. This is disappointing for a tool that promises ease of use. 3. **Lack of Transparency:** Promised statistics that should demonstrate a clear success rate have not been provided. Claims about the effectiveness of the indicators remain unsupported by evidence or tangible results. 4. **Monetization Through Signal Group:** Additionally, the provider offers a paid signal group based on the indicators. The focus appears to be less on the quality of the signals and more on generating additional revenue streams through paid groups, training sessions, and other upsells. This gives the impression that the primary goal is financial gain rather than delivering a high-quality and reliable product. 5. **Questionable Value of the Indicators:** If the indicators were as effective as claimed, it should be easy to prove their performance through transparent statistics. However, this is not the case. Instead, the numerous rules and guidelines seem like an attempt to obscure weaknesses. **Conclusion:** After extensive use and analysis, I have concluded that the **TPSpro RFI Levels** indicator does not meet the expectations one would have for a professional trading tool. The lack of transparency, inconsistent signals, unnecessary complexity, and monetization through paid signal groups and training make it unsuitable for me. Unfortunately, I can no longer recommend this indicator and urge potential buyers to carefully consider their decision before purchasing this product. I hope the provider addresses the issues mentioned and works on making the product a truly valuable tool for traders in the future.

    overcore21
    134
    overcore21 2024.09.19 16:51 
     

    uso los indicadores RFI y TREND pro para analizar empresas, metales y energías ... uso la temporalidad de 1H y la verdad funciona muy bien en conjunto.

    Arash Ghasempour
    101
    Arash Ghasempour 2024.09.18 07:24 
     

    Very good indicator to have For trading as new user it can be very useful It's few months I used it and last update make it more user friendly and clear to understand Recommend to everyone

    Pham Phuong
    78
    Pham Phuong 2024.09.13 09:38 
     

    very good service, tools easy to use

    Roman Podpora
    102061
    来自开发人员的回复 Roman Podpora 2024.09.13 12:59
    Thank you for your feedback) We are trying)
    Gryffn10
    232
    Gryffn10 2024.08.31 08:03 
     

    用户没有留下任何评级信息

    Roman Podpora
    102061
    来自开发人员的回复 Roman Podpora 2024.09.08 09:43
    Thank you very much for your feedback) Join the telegram group (pinned to my profile) - there are a lot of interesting things there)
    Spark690
    74
    Spark690 2024.08.09 15:51 
     

    Беру свои слова обратно) Индикатор хороший

    Takashi Ohtaku
    284
    Takashi Ohtaku 2024.05.14 01:38 
     

    これは凄い!!相場の事何もわからなくても勝てる。使いやすい。サポートのレスポンスも早い。これから更なるアップデートを期待しております。

    Roman Podpora
    102061
    来自开发人员的回复 Roman Podpora 2024.05.14 08:12
    Thank you very much for your feedback)! We will try better)
    arismops111
    69
    arismops111 2024.05.07 23:35 
     

    Very good indicator!Roman is very helpfully he anwer all my many questions :-)

    Roman Podpora
    102061
    来自开发人员的回复 Roman Podpora 2024.05.13 13:15
    Thank you) Glad to help you)
    themauri67
    140
    themauri67 2024.05.07 19:44 
     

    this indicator combined with the TS PRO Trend is very supportive to me and also the author is always available to help

    Roman Podpora
    102061
    来自开发人员的回复 Roman Podpora 2024.05.07 20:04
    Thank you) Yes, both indicators are a whole trading system) We are always happy to help)!
    Dragos Dinescu
    351
    Dragos Dinescu 2024.03.19 21:30 
     

    My personal opinion: this indicator is at least two levels above anything else here. I use it together with TrendPro, and the first effect is that instantaneously it cleared my mind and I could see what is important on the chart. This had two consequences: it helped me not to overtrade ( but to wait the right moment when it's important to trade ) and improved the odds for the trades taken at levels in accordance with the rules. These two consequences means an overall edge improvement. This indicator managed to catch the intrinsic logic of the market, and the AI logic embeeded it's crystal sharp - I still didn't see a losing trade from the yellow circle! OK, I know it will be, but still the win rate combined with risk-reward is clearly a wining card. It has even a psychological effect of relaxation, because I have always an overall image about what's going on, and there are only a couple of patterns to which I should react - nothing too complicated, but extremely efficient. The additional training videos and articles are also very educative - I catched the overall idea ( which is brilliant ) from the first sight. The author always had a very clear, to-the-point and helpful answer to any question I raised, generally in a matter of minutes. I feel like blessed to arrive in contact with this very affordable, efficient and finely tuned indicator, which will stay on my charts as long as MT5 will be alive! I still don't know why there are so little reviews here - probably the other customers are busy making their profits, there is no other explanation! :) Wonderful work, Roman!

    Roman Podpora
    102061
    来自开发人员的回复 Roman Podpora 2024.03.19 21:39
    Oh my God))) Thank you for such a wonderful and pleasant review)!!! It makes us do more)
    Sky777777
    44
    Sky777777 2024.02.07 08:19 
     

    Отличный индикатор. Разработчик всегда на связи. Все работает отлично.

    Roman Podpora
    102061
    来自开发人员的回复 Roman Podpora 2024.02.07 11:30
    Спасибо за отзыв)! Это должна быть основа для каждой профессиональной стратегии без индикаторов.
    John Fox
    125
    John Fox 2024.01.23 08:13 
     

    This is an excellent tool for your trading tool kit.Drawing in the support and resistance lines really helps especially when you can have other time frames support and resistance showing. The support is excellent. Response is very fast.

    Roman Podpora
    102061
    来自开发人员的回复 Roman Podpora 2024.01.23 08:15
    Thank you very much for your feedback, we are working on better service)
    Marcos Yuge
    644
    Marcos Yuge 2024.01.18 01:40 
     

    Excellent tool. Complements any strategy. The reading material about the indicator is also a very interesting extra. Finally, the author is very quick to clarify doubts.

    Roman Podpora
    102061
    来自开发人员的回复 Roman Podpora 2024.01.18 07:53
    Thanks for the feedback) This is the basis for any strategy)
    Needadream123
    290
    Needadream123 2023.12.27 13:33 
     

    I appreciate this indicator and the work of this gentleman, constantly updated and good support, I really appreciate it, super cool

    Roman Podpora
    102061
    来自开发人员的回复 Roman Podpora 2023.12.27 13:39
    Thanks a lot)!
    We are trying for you)
    回复评论
    版本 5.4 2025.01.14
    Logic AI components updated.
    版本 5.3 2024.12.27
    📊 Logic AI 信号现在以图标显示,取代了箭头。
    ✂️ 模板完成后自动修剪水平线,以减少图表上的视觉干扰,专注于相关区域(PRUNING 按钮)。
    🔍 扫描器已更新以符合 TPSproSYSTEM 策略,现在仅检测单一方向的模板和趋势。
    🤖 指标已适配我们的 RFI SIGNALS。
    🚀 进一步优化了 Logic AI 助手的功能。
    版本 5.2 2024.11.12
    - 修复了在 MTF1 和 MTF2 模式下止损功能和 Logic AI 信号取消的问题。
    - 优化算法,以提升整体性能和准确性。
    版本 5.1 2024.08.14
    Version 5.1 - Fixed filtering in the scanner.
    版本 5.0 2024.08.12
    Version 5.0

    - Comprehensive bug fixes.
    - New feature for locking/fixing the pair when clicking on the last square with an arrow.
    - The indicator no longer crashes when saving a template.
    - Fixed bugs in the scanner.
    版本 4.7 2024.07.31
    Version 4.7
    - Added a function to collapse the COMPLETED panel by clicking
    - Fixed errors (trade copies) in the COMPLETED module
    - Improved LOGIC AI (MTF-2)
    版本 4.6 2024.07.19
    Version 4.6

    - Fixed pair filtering in the scanner.
    - Fixed errors in the COMPLETED module: all correct trades with positive or negative results are saved and displayed.
    - Added a function for synchronous switching of instruments (buttons in the scanner 1-2).
    版本 4.0 2024.07.01
    Version 4.0

    1. Added new logic for LOGIC AI on MTF-2
    2. Improved interface for MTF-2
    3. Alerts (LOGIC AI) for MTF-1 and MTF-2
    4. Added future take profits for LOGIC AI
    5. Improved LOGIC AI signals
    6. Hotkey for MTF-2 (L) — adds level starts
    版本 3.5 2024.05.10
    v. 3.5 LOGIC AI (RETEST) has been added. A filter has been attached to BROKEN based on the trading strategy algorithm TPSproSYSTEM.
    版本 3.4 2024.01.21
    Error test
    版本 3.3 2024.01.16
    3.3
    1. Added logic for BROKEN (LOGIC AI)
    2. Fixed RFI logic for all timeframes
    3. Optimized code
    4. New visualization for MTF2
    5. New parameter for MTF1-2 (color) - Newly formed RFI
    6. Fixed errors in LOGIC AI
    7. And much more.
    版本 2.4 2023.11.15
    2.4 code optimization