 MetaTrader 5
 专家
专家
 指标
指标
 程序库
程序库
 实用工具
实用工具
 窗口小部件
窗口小部件
 规则
规则
适用于MetaTrader 4的EA交易和指标 - 343
 EA交易自动执行市场交易,而指标可使您更准确地分析报价并预测价格行为。
通过这些应用程序,您将能够更明智地在MetaTrader 4执行交易,抓住更多的交易机会。
EA交易自动执行市场交易,而指标可使您更准确地分析报价并预测价格行为。
通过这些应用程序,您将能够更明智地在MetaTrader 4执行交易,抓住更多的交易机会。 
Did you ever encounter a problem that your terminal failed to reestablish a connection and caused your EA to stop working? How much money did you lose because you were not aware of the connection error? Worry no more, I am here to present you a solution for your nightmare. This utility indicator sends a real time push notification or email when your terminal encounters a connection failure. You will be notified immediately even if your terminal is yet to establish a success connection to your br

这个多时间框架和多品种指标扫描吞没和镊子形态。 特征 可以同时监控您的市场报价窗口中可见的所有交易品种。将该指标仅应用于一张图表,并立即监控整个市场。 监控从 M1 到 MN 的每个时间范围,并在识别出吞没或镊子形成时向您发送实时警报。支持所有 Metatrader 原生警报类型。 使用 RSI 作为趋势过滤器,以正确识别潜在的逆转。 该指示器包括一个交互式面板。请参阅单独的屏幕截图。 输入参数
输入参数的描述和解释可以在 这里 找到。 重要的 我强烈建议将指标放在干净(空)的图表上,上面没有任何其他可能干扰扫描仪的指标。另请注意,由于具有多功能性,图表上不会绘制买入/卖出建议或线条和箭头。 我强烈建议将指标放在干净(空)的图表上,上面没有任何其他可能干扰扫描仪的指标。另请注意,由于具有多功能性,图表上不会绘制买入/卖出建议或线条和箭头。

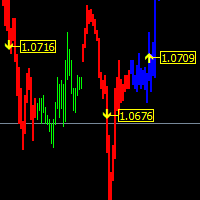
AIS Advanced Grade Feasibility 指标旨在预测未来价格可能达到的水平。他的工作是分析最后三个柱形图并在此基础上进行预测。该指标可用于任何时间范围和任何货币对。在设置的帮助下,您可以达到预期的预测质量。
预测深度 - 以条形图设置所需的预测深度。建议在 18-31 内选择此参数。 你可以超越这些限制。但在这种情况下,预测水平的“固定”是可能的(对于小于 18 的值),或者水平宽度过大(对于大于 31 的值)。
置信水平 1、置信水平 2 和置信水平 3 - 预测置信水平。可在 1-99 范围内设置。置信度 1 应该大于置信度 2,置信度 3 应该是最小的。 这些水平中的每一个都显示价格将达到此值的概率百分比,该值由预测深度参数确定的柱线数量决定。
Color lvl high 和 Color lvl low - 允许您选择线条的颜色 Style lvl - 允许您选择与级别对应的线条样式 宽度 lvl - 设置与级别对应的线的宽度

Slide Trend is a simple indicator that shows a trend and allows for easy and fast navigation between charts. It was designed for quick analysis and aids you to scroll very fast through all the charts in the inputs list. The minimalist graphic allows receiving data on trend on D1, W1 and MN timeframes. The Trend feature (in the inputs) allows you to filter and view only the most powerful symbols. In this case, the circles are all of the same color. This indicator is a utility that speeds up navig
Algo Zones is an indicator that simplify the visual approach and it gives you very quickly the information of your favorite indicator. The indicator colors areas based on indicator and levels chosen in input. This graphic display improves significantly your market attitude and it prevents you from making silly mistakes. The zones are colored in base of levels of this indicators: ATR, Momentum, RSI, MACD and Stochastic.
Input values Number_of_Bars (default 100) numbers of bars where show coloure

This indicator can display 1 or 2 MACD indicator on different time-frames and settings. Uses EMA for calculation. The active indicators can give visual and sound alert on zero-level-cross if the user choose that option. Alert can be set on one or both active indicator, even if the time-frame, and the period different on each. When alert set to both, the two MACD histogram must be on the same size of the 0 level to get an arrow. There is a display panel with buttons on the main chart, what is sho

You can use the signals to Forex. The indicator works on all pairs. You can use it for scalping and intraday trading but also for the long-term trading. Periods: M1 M5 M15 M30 H1 H4 D1 This indicator is not repainting signs. It gives immediate signal when a new candle opens. Easy to use. All pairs.
Indicator Settings Alert Signal - Configuration of Alerts. Show Line Ianx - Show Ianx line. Show Arrow Signal Ianx Buy - Show Buy signal arrow. Color Arrow Signal Ianx Buy - Buy Arrow Color. Wingding
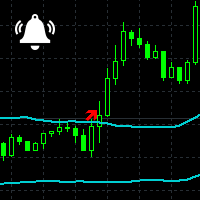
Channel Notifier is a universal indicator, which can plot different types of channels with the ability to send notifications about the channel breakouts. A breakout can be registered based on different rules, such as the price directly reaching a new level, a bar closing beyond the channel, the whole bar being outside the channel, etc. The notifications can be configured as alerts in the MetaTrader terminal, or as push notifications to mobile devices.
Input parameters
Indicator - type of the i
MyBreakeven Expert Advisor automatically moves a position to breakeven. The EA works both with all open positions and with a certain order. The robot allows moving a position to breakeven in several modes: Points - move a position to breakeven when reaching a certain profit in points. To work in this mode, fill in the SizePoints field in the inputs; Summ - move a position to breakeven when reaching a certain profit in deposit currency. To work in this mode, fill in the SizeSumm field in the inpu

Do you want to see the candlestick formation on a higher timeframe, but do not want to be detached from the lower chart you trade on? Then this indicator is for you! It draws candles of any timeframe as histogram bars and accurately replicates the proportions between the candle body and wicks. At the same time, the time scale is not interrupted. For example, on a minute chart, each M5 candle will take up 5 bars. Each candle formed before the start of the indicator will be replicated five times w

This is a multitimeframe version of the popular Force index oscillator. Interpretation of the conventional version of the indicator is relatively complex, therefore, its multitimeframe representation is especially relevant. Monitoring different periods becomes comfortable and the indicator turns out to be more informative. It provides the ability to show or hide any graphs, from minute to daily inclusive. It is also possible to select the oscillator plotting style: line, section or histogram. Yo
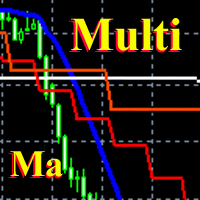
This is a fully multi timeframe version of the Moving average standard indicator, which works for any combination of timeframes. The indicator allows quickly and effortlessly viewing the charts from different timeframes at the same time. You can create and set of intervals and freely switch to a higher or lower one. At the same time, the selected charts will always be displayed in a correct time scale. The interaction of the short-term and long-term trends will be clearly visible, and it will al
The main function helps you trade in the direction of the trend D1. All this make it Become One trend trading system easy to use for beginners, advanced and professional traders. This indicator will give you a new perspective and it suggests you a decision on the market. The indicator is equipped with a pop-up and audio alert. This indicator creates a very important that optimizes the entry points. We are very happy to have created this indicator and we hope it will be useful to all.
Features D

ChartTrader is a professional trading tool that every trader needs in their toolbox. It has been developed to work with the MT4 Platform. ChartTrader offers a number of options to make placing orders in the Forex market quick and easy. The GUI sits on the chart window so there is no need to navigate to separate windows when placing orders. The program allows you to set pending and instant orders. It has a built in risk management system, so every trade can risk a percentage or a fixed amount in

123模式 是最受欢迎,功能强大和灵活的图表模式之一。该模式由三个价格点组成:底部,峰值或谷值以及38.2%至71.8%之间的斐波纳契回撤位。当价格突破最后一个峰值或谷值时,该形态被认为是有效的,此时指标绘制箭头,发出警报并可以进行交易。 [ 安装指南 | 更新指南 | 故障排除 | 常见问题 | 所有产品 ]
清除交易信号 可自定义的颜色和尺寸 实施绩效统计 可定制的斐波那契回撤水平 显示适当的止损和获利水平
该指标可用于查找连续或反转形态 它是不可重涂和不可重涂的 它实现了电子邮件/声音/视觉警报 123模式 可以表现为连续或反转模式。为了简化操作,该指标使您可以选择要寻找哪种类型的形态,使其成为趋势或反转交易者的绝佳工具。
设置 将指标加载到任何图表时,将显示一组选项作为输入参数。如果您认为它们太多,请不要感到失望,因为参数被分组为不言自明的块。这就是每个参数块的作用。 幅度-幅度表示替代价格点之间的最小柱线量。要找到大图案,请增加幅度参数。要查找较小的模式,请减小幅度参数。 闵。回撤-形态中所需的最小斐波那契回撤。设置为零不对其进行评估。 最大。回撤-形态中可能的最大斐

This indicator is built on a high-precision strategy, which is based on a set of different Moving Averages. Together they form a strategy that provides stable, and most importantly accurate signals.
What is a Moving Average (MA) It is one of the most popular, proven and effective ways to work in the Forex market. Its task is to average price values by smoothing local movements, thereby helping the trader to focus on the major price movements.
How to Trade By default, the indicator has 2 lines
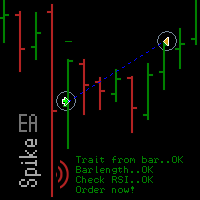
Spike missed? The EA_Spike reacts to spike and uses the RSI indicator as filter. The trade selection and frequency is set with Barlength, TradesperDay and the RSI. The expert advisor is open for many underlyings and all chart periods. It feels most comfortable in a portfolio and can run on several charts with various settings at the same time. You will find suitable settings with the optimization.
Backtest Examples as screenshots. Based on tick data .
Inputs The setting options of the EA are:

The easy-to-use trading system SmartScalper generates the following signals: BUY SELL close BUY close SEEL SmartScalper works on the М15 timeframe and is optimized to work on GBPUSD, XAUUSD, GBPJPY, EURJPY, EURUSD. 12 different sets of trading algorithms are designed for trading (6 buy and 6 sell trades), which can be quickly selected by the trader using buttons in the indicator window, or are set in the input dialog. The efficiency of the trading algorithms chosen by the trader is measured in r

The strategy is based on the elements used in trading by the market makers - trading against the crowd. The EA uses real trade volume information. The indicator simultaneously displays the information on 10 pairs on the chart, where the results can also be compared.
Online results of the EA operation Signal: ExchangeOnLine
Expert Advisor Settings For the on-line version to work, it is necessary to add the "" to the list of allowed URL in Tools > Options > Expert Advisors. Mode - trading mode L

Fully automatic scalper EA. Trades are opened based on two indicators. The news filter is built-in. It is recommended to perform optimization for your broker and account type. Optimize only the settings of the indicator. Minimum deposit is 1000 USD or cents per 0.01 lot per 1 pair. It works around the clock, VPS is recommended. Recommended timeframe is H1. A live monitoring of the Colibri can be found here: https://www.mql5.com/en/users/ildarvin/seller
Settings Lots - initial lot Fix lot on/off

MultiCurrency Indicators is a multi-currency indicator which calculates the values of multiple standard indicators for each of the 8 major currencies: EUR, GBP, AUD, NZD, USD, CAD, CHF, JPY.
Advantages of the indicator Calculation is performed for 8 virtual charts of the currencies: EUR, GBP, AUD, NZD, USD, CAD, CHF, JPY; Show the currency strength, which does not depend on the currency pair; It allows determining the strongest and the weakest currencies at any moment, it also sorts currencies

This indicator marks the long or short force of each candle. Green = long. Red = Short
Parameters: The periods serve to make the indicator functions faster or slower. We recommend to run faster periods 4-10 or slower periods 12-26. PeriodFast : Numbers of Bars used for the calculations of fast period (Recommended value 4) PeriodSlow : Numbers of Bars used for the calculations of slow period (Recommended value 10)

The function of this indicator is to indicate to us the degree of volatility that is having a specific section. As long as the volatility line does not cross with its mean it is indicative that the volatility continues, and as long as the price does not reverse the continuation should be guaranteed. The crossing below its average would indicate exhaustion or end of said section.
Parameters: The periods serve to make the indicator functions faster or slower. You can modify the periods but the re

The function of this indicator is to confirm or cancel a possible rupture of a roof or floor. Parameters: The periods serve to make the indicator functions faster or slower. You can modify the periods but the recommended ones are the ones that come by default or is 14-12. PeriodSentry : Number of Bars used for calculations (Recommended value 14). PeriodMedium : Number of average Bars used for calculations (Recommended value 12). BandSup : Superior Band (Recommended value 50). BandInf : Inferior

This tool set Stop Loss and Take Profit, which are invisible for the broker. But keep in mind that the terminal must be constantly running and connected. It means that you cannot turn off your computer or close the terminal. In the strategy tester, the tool opens positions and manages them using stop-order for demonstration purposes.
Parameters Take Profit Stop Loss Slippage
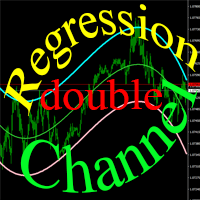
Trading robot for a real account. It is a continuation of the idea used as the basis of the popular Regression Channel EA. Unlike its predecessor, it uses a bidirectional trading algorithm. The robot trades inside a channel formed by regression curves. Deals are always by stop losses.
Strategy Features The robot trades inside a trend channel bound by the curves of a polynomial regression. The trend direction and strength are determined by the gradient of the channel cures during the trading. Ma

BG Robonight is an Expert Advisor that works at the junction of the American and Pacific sessions. The default settings are designed for trading on the M15 timeframe. With these settings, the EA operates in the classic night scalper mode. The initial objective of the EA was to enable multicurrency trading with the same settings for all pairs. By default, the EA is recommended for use on the following currency pairs: AUDCAD, CADCHF, EURCAD, GBPCAD, AUDCHF, GBPAUD. The EA features a news filter, w

News Calculator and Trading Panel is a high-tech exclusive calendar indicator, which shows news for many currencies. At the same time, it is a versatile trading panel. The News Calculator indicator shows the news on the chart in a detailed form and draws vertical lines: for low, medium and high-impact news. The indicator contains multiple features. Many buttons are displayed on the chart, each button is responsible for a certain action. When a news event occurs, the indicator generates notificat

MMM Ichimoku EA strategy: The robot uses its built in Ichimoku indicator all the time and does a calculation to determine the prices trends. If it indicates the price will be bullish, it sends a buy order. If the indicator indicates the price will be bearish, it sends a sell order; It will not send an order unless the calculations determines a good trend of profit; Like all MMM products it is also programmed to minimize your losses and protect your money from the hostile market. We have protecti

I present you the Goliath scalping Expert Advisor. The trade operations are performed according to a certain algorithm. Only one order can be opened on one financial instrument at a time. Also, Stop Loss and Take Profit are always set when opening orders. Timeframe: M5
Parameters Lot - specified lot value of a trading position Risk - automated calculation per deal StopLoss - maximum allowed loss level TakeProfit - maximum profit value StartHour - trading start time, hours
StartMinute - trading

Strx Super Grid is a grid system with many advanced features. It places the first 2 orders as BUY_STOP and SELL_STOP distanced from current price by the GridPoints specified; when an order becomes active, the other is canceled. User can also choose to open immediately a position or a pending order via the new FirstImmediateOrder input. If GridPoints is 0 (default), grid is auto-sized based on last 500 bars (max-min closes) divided by MaxOrders input parameter. If trade becomes profitable, after
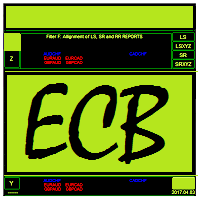
Ejike Currency Basket compiles and analyses foreign exchange currency strength and volatility dynamics for the 8 major currencies. Its data are formulated from market prices and volatility. ECB visually cross-references its own reports to generate high probability trade pairs, the build-up to which is interactive that the trader can easily assume the role of Analyst. Its 28-pair real time monitoring involves a constant comparison of its current to past data. On adjusting a parameter, it will cha

This indicator is based on ADX, RSI and CCI. Each indicator show trend arrows on each timeframe. If all arrows are in the same trend, the SELL/BUY signal is the strongest.
Settings Spread Threshold - value of spread threshold ADX Setup ADX Period ADX Price - price of ADX (Close, Open, High, Low, Median(High + Low)/2, Typical(High + Low + Close)/3, Weighted(High + Low + Close + Close)/4). Level of ADX Trend - ADX level Strong of ADX Trend - ADX for Strong Signal RSI Setup M1...MN period Price -

This robot uses a custom hidden oscillating indicator and also analyzes the market response. It traded mostly at the time of higher volatility. It works with several pending orders with different size of volume and their position actively modifies. It uses advanced money management. TradingMode setting can also meet the conditions FIFO.
It is successful in different markets and different timeframes. Best results are achieves with a broker with the spread to 5 points on EURUSD. Is necessary a br
This indicator works based on an improved system of triple moving averages (MA). In conjunction, this system is able to deliver impressive results in trading. The indicator is easy to use. It represents 2 arrows which are automatically drawn after a bar is closed, showing where the price is likely to move in the nearest future based on the combination of the signals from all MAs.
What is Moving Average (MA)? It is one of the most popular, proven and efficient methods for Forex trading. Its prim

Neurone is a trend strategy based on neural network analysis.
Strategy Description The strategy is based on the algorithm of a self-learning neural network. The idea of the algorithm was taken from a famous demonstration of artificial intelligence training in the game with 11 matches. The trading day is divided into 6 trading intervals, which are associated with the H4 candles. Each candle withing a day is a neuron. The history data associated with the neuron are passed as input for the neurons

RiverScope Lite automatically determines the nearest most important price levels and support and resistance zones in history, it also identifies a large number of price action patterns (the lite version is limited to 10, while the full version has 30+). The support and resistance levels are determined based on an algorithm that calculates and filters the historical values of the price, its movement character, volumes, etc. It displays the current situation, therefore the nearest levels change in

The Expert Advisor uses 3 different strategies based on news fluctuations. The EA downloads the news from economic sites. The EA takes into account only HIGH and MEDIUM impact news and trades on their basis. The EA uses a smart profit taking system. It was backtested and optimized using real ticks with 99,9% quality. Monitoring : https://www.mql5.com/en/signals/author/profi_mql . Optimized for EURUSD, AUDUSD, GBPUSD, USDJPY, NZDUSD / H1 For the EA to work correctly, open Tools > Options > Expert

The MACD TrendMA indicator is a trading system developed on the basis of the MACD indicator popular among many traders, and which is based on measuring the inclination (trend) angle of the moving averages, while measuring the ratio (convergence/divergence) between them. The signal for entering/exiting the market is the frame of the bars colors and color of the MACD TrendMA histogram according to the trend, which can be customized in the properties window of the indicator - in case the inclinatio

The News Notifier EA downloads, displays and sends email or push notifications with the news of the intraday economic calendar from investing.com, as well as the status of the trading account.
Easy adjustment of input parameters for: Choosing the language of the news (English, Russian); Settings the color for the information bar and text; The number of lines of news displayed; Selecting the period and time for automatic updating and notification of information; Selecting the type of the broadca
Gold Digger Martingale Robot is a fully automated scalping Expert Advisor based on Heiken Ashi, Moving Average and Ichimoku Kinko Hyo. Each entry point is calculated using an advanced entry filter based on Price Action by following the trend.
Advantages Money management system. Indicators are Heiken Ashi, Moving Average and Ichimoku Kinko Hyo for filter sideway and scalping by following the trend. Easy to set up.
Requirements Symbols: XAUUSD H4. Minimum deposit: $500. Leverage: 1:400-1:500. An

我建议你阅读 产品博客 (手册)从头到尾,以便从一开始就清楚地了解指标提供的内容。 此多时间框架和多符号指标扫描 pin bars。结合您自己的规则和技术,此指标将允许您创建(或增强)您自己的强大系统。 特征
可以同时监控“市场观察”窗口中可见的所有符号。只需将指标应用于一个图表,即可立即监控整个市场。 可以监控从 M1 到 MN 的每个时间范围,并在识别出 pin bar 时向您发送实时警报。支持所有 Metatrader 原生警报类型。 可以使用 RSI 作为趋势过滤器,以便正确识别潜在的逆转。 该指标包含一个交互面板。请参阅单独的屏幕截图。 可以配置为显示买入/卖出线和 TP/SL 线(基于 ATR 乘数)。这些线将显示在图表上,您可以通过单击面板中的信号来打开该图表。请参见下面的屏幕截图 该指标可以将信号 (不带交易建议级别)写入文件或 作为全局变量,可供专家顾问用于自动交易。 输入参数
输入参数的描述和解释可以 在这里 找到。 重要的
请注意,由于多功能性,买入/卖出建议、线条和箭头都不会绘制在安装指标的同一图表上。它们将绘制在单击面板中的信号时打开的图表上。 强烈

This indicator can display 1-3 CCI indicator on different time frames and settings. The active indicators can give visual and sound alert on oversold/overbought level if the user choose that option. Alert can be set on one or all active indicator, even if the time frame, the period and the oversold/overbought level different on each. There is a display panel with buttons on the main chart, what is show the active indicators and their settings. There is an option to hide this panel. With the butt

Multi Feature Robot suit for trading in semi automatic mode. The robot uses Heiken Ashi indicator to form signals. It provides two options for trades. 1. Heiken Ashi trade - use signal trade for buy and sell. 2. Reverse trade - use Heiken Ashi stop loss for buy stop and sell stop. Also, provide additional feature for a trader which is: 3. Trend line trade - use trend line for buy and sell. This trend line trade feature is not for fully automated trading because it needs trend line input. Trader
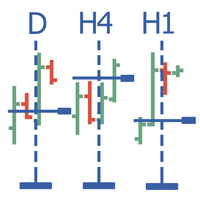
Multitimeframe navigation and research tool MT4 ( XY expert advisor) is a convenient tool that allows analyzing the trading instruments on different time frames and fast switching between them. Easy to use. It has no adjustable parameters. Charts with an XY Expert Advisor can be either the same symbol (instrument) or different (from version 2.0). When a symbol is changed on one of the charts with the XY expert advisor , cascade change of symbols occurs on other charts with the XY attached. The X

This indicator can determine the current direction of the market and the most probable future direction on the basis of its own algorithms which only analyze the price action. The indicator calculates and displays current buy/sell levels, as well as required buy/sell levels for a balanced movement. The indicator generates buy/sell signals. These signals can be filtered both manual and automatically, and you can also enable both filters.
Features fast, convenient, easy working wherever possible

The Triple Exponential Moving Average (TEMA) combines a single EMA, a double EMA and a triple EMA. TEMA = 3*EMA - 3*EMA(EMA) + EMA(EMA(EMA)) Setting is very easy, you must set only period of one EMA. I prefer to use two TEMAs for accurate signal.
Settings Period of EMA - defined period of EMA. Test it on Demo account before Real Account. Trading is risky and at your own risk.
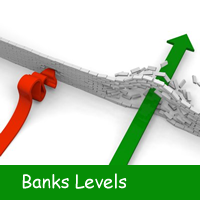
This indicator calculates and draws bank levels from a minimum of three days to a maximum of ten days. It is very useful to trade the breakout or the pullback and when the price levels break the highest or lowest level, indicating an imminent explosion of volatility. Best use with Pips Average Range indicator.
Parameters settings numbers_of_day - from 3 to 10 (better use on 10 days). levels_High_color - set color for High levels. levels_Low_color - set color for Low levels.
This indicator compares the pips of the current day with the average of pips made in the previous three days. The "Percentage today range" is red if today's figure is less than the range of the previous three days, but turns green when the percentage exceeds 100%. When the range exceeds 100% there are good trading opportunities because we are in the presence of increased volatility of the past three days. Best use with Banks Day Levels indicator.
Parameters settings corner (indicator display po
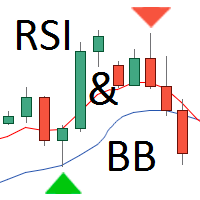
A lot of traders are interested in the Reversal Strategy for Binary Options. Most used indicators are Bollinger Bands (BB) and the Relative Strength Index (RSI). This indicator combines the BB and RSI indicators, information box with text message about the appearing signal and signal arrows on the price chart. The information box displays the preliminary and main signals for currency pairs with corresponding timeframes and accompanying audio alerts. The signals are generated for the currency pai

具有经过验证的概念和盈利能力的最佳、最有效、可靠的产品。感谢您的考虑。
该指标根据H.M.Gartley的发展(《股票市场利润》,1935年)识别和确认谐波模式(XABCD)。
它将D点投影为透视投影中的一个点(在设置中指定ProjectionD_Mode = true)。
不会重绘。当工作时间段的柱形图关闭时,如果已识别的模式点在Patterns_Fractal_Bars柱中未移动,则在图表上出现一个箭头(指向预期价格运动的方向)。从此刻起,箭头将永久保留在图表上。
注意:连续出现2-3个或更多箭头 - 这是市场条件的变化,而不是重绘。
总共有85种模式(包括Gartley-222和Gartley-222WS,完整列表可在评论部分的Google Drive链接中找到)。在所有已识别的模式中,只有最新识别的模式填充了单一颜色。
参数 DrawPatterns(true/false)- 以实心颜色绘制模式 ProjectionD_Mode(true/false)- 定义D点作为透视投影模式 Patterns_Fractal_Bars - 在认定为形成分形的情况下,最新
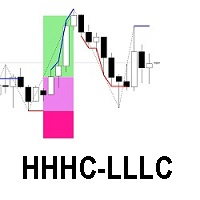
The HHHC-LLLC indicator uses candle by candle analysis, based on the principle of trend confirmation from Higher High, Higher Close candles (bullish) and Lower Low, Lower Close candles (bearish). There is no lag, no re-painting, and averaging is not used. HHHC-LLLC helps confirm: market structure and levels - look left to see them line up trends, pullbacks & reversals Bull moves (blue), Bear moves (red) Structure Zig Zags (black dotted lines), for summarizing market moves exhaustion and stalling
OP CD HTB (Opposite Prices Convergence/Divergence High Top Bottom) is an indicator of convergence/divergence of the bearish sentiment among the mirrored financial instruments. The indicator is the second out of the two possible versions (HBT and HTB) of the bearish convergence/divergence origins. Multiple use of the indicator allows you to find convergences/divergences between the price of the main financial instrument and any other financial instruments simultaneously. Users can select the sell
OP CD HBT (Opposite Prices Convergence/Divergence High Bottom Top) is an indicator of convergence/divergence of the bearish sentiment among the mirrored financial instruments. The indicator is the first out of the two possible versions (HBT and HTB) of the bearish convergence/divergence origins. Multiple use of the indicator allows you to find convergences/divergences between the price of the main financial instrument and any other financial instruments simultaneously. Users can select the sell
OP CD LTB (Opposite Prices Convergence/Divergence Low Top Bottom) is an indicator of convergence/divergence of the bullish sentiment among the mirrored financial instruments. The indicator is the second out of the two possible versions (LBT and LTB) of the bullish convergence/divergence origins. Multiple use of the indicator allows you to find convergences/divergences between the price of the main financial instrument and any other financial instruments simultaneously. Users can select the sell
OP CD LBT (Opposite Prices Convergence/Divergence Low Bottom Top) is an indicator of convergence/divergence of the bullish sentiment among the mirrored financial instruments. The indicator is the first out of the two possible versions (LBT and LTB) of the bullish convergence/divergence origins. Multiple use of the indicator allows you to find convergences/divergences between the price of the main financial instrument and any other financial instruments simultaneously. Users can select the sell g

The MultiCurrency RSI indicator calculates the values of the standard RSI indicator for each of 8 major currencies: EUR, GBP, AUD, NZD, USD, CAD, CHF, JPY.
Advantage of the indicator: The calculation is performed based on 8 virtual currency charts: EUR, GBP, AUD, NZD, USD, CAD, CHF, JPY; Shows the strength of currencies, not depending on the currency pair; Allows any time to determine the strongest and the weakest currency, also sorts currencies by strength; At any time it shows the current str

MMM Momentum EA strategy: The robot uses its internal Momentum indicator all the time and does a calculation to determine the prices trends. If it indicates the price will be bullish, it sends a buy order. If the Stochastic indicator indicates the price will be bearish, it sends a sell order; It will not send an order unless the calculations determines a good trend of profit; Like all MMM products it is also programmed to minimize your losses and protect your money from the hostile market. We ha

This indicator can display 1-6 RSI indicator on different timeframes and settings. The active indicators can give visual and sound alert on oversold/overbought level if the user choose that option. Alert can be set on one or all active indicator, even if the timeframe, the period and the oversold/overbought level different on each.There is a display panel with buttons on the main chart, what is show the active indicators and their settings.There is an option to hide this panel. With the buttons
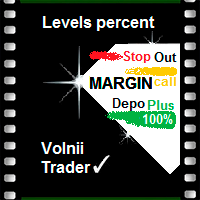
Indicator of the Margin Call, Stop Out and Plus 100 (one hundred percent of profit to the deposit) levels. It has been designed to better visualize and maintain money management when trading financial instruments. The levels drawn by the indicator have different colors. They visualize the price range, at which a broker generates a notification (Margin Call) and force closes the deals (Stop Out) due to the shortage of funds on the account, in case the price goes against the positions opened by a
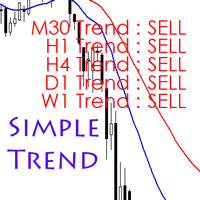
According to experts, trading against the trend is said to be hazardous, and perhaps sometimes it is a mistake that we easily make. Simple Trend Info is designed to display the trend of an asset class on different time frames and assists in minimizing trading against the trend. It uses the conventional moving averages to determine whether the trend is bullish or bearish and displays the trend on the screen. The time frames are limited to 5 options and you can adjust them as per your needs. The d

在下单之前,ACB Trade Filter 可以帮助你回答一个实际问题:当前市场是否支持这笔交易,还是你正在混乱的条件下勉强接受一个信号? 该指标分析市场情绪和趋势,然后通过彩色柱状图与趋势方向显示结果。请在正常进场信号出现后使用它,而不是用它代替进场系统。 一眼看懂三种市场状态 绿色柱状图并且趋势看涨: 当前条件支持按照你的策略寻找做多机会。 红色柱状图并且趋势看跌: 当前条件支持按照你的策略寻找做空机会。 灰色柱状图或横盘趋势: 方向不明确,因此更适合放弃这次机会。 它在交易策略中的位置 当你的进场指标产生信号时,可以先检查 ACB Trade Filter 再决定是否行动。如果柱状图和趋势与交易方向一致,就继续进行正常分析。如果两者与信号冲突,你就有明确的理由暂停,而不是接受每一个信号。 它可以自然地配合 ACB Breakout Arrows,但并不局限于这一款指标。你也可以将它用于动量交易、回调进场、突破方法,或者任何需要第二个市场方向判断的手动策略。 它的目的不是制造更多交易,而是帮助你减少质量较低的决定,避免逆着整体方向进场,并在震荡行情中保持选择性。 选择适合你的过滤

This is no martingale, grid, hedge or other averaging strategy. This expert is a classic break-out-strategy with special filter. It monitors market movements and set pending trades. If not activated in a certain time frame, new levels are set. On activation the experts trails the trade very closely. Every trade is protected by stop-loss. Best trading times are while London and USA is open. We suggest – and have tested it with – EURUSD and GBPUSD We also suggest a VPS with very fast ping times an

YPY Check Your Broker is a universal multifunctional software complex which uses primary tick data. It allows traders to perform comparative analysis of the trading conditions and execution quality, identify abnormal BID prices outside the indicative quotes. It also reflects the facts of redrawing bars in the terminal, spread extension, controls the leverage stop out level values, speed of execution and server connection breaks, maintains a detailed statistics on the slippages. The YPY Check You

Noirtier Scalper is a ready trading solution for your account. This robot can be of interest to those who are at the beginning of their journey in trading, as well as for more advanced traders who wish to diversify their risks. This Expert Advisor performs trading operation at the end of the New York session. Trades are opened and closed based on a special algorithm, which provides the maximum accuracy of entries. Also the Expert Advisor includes the smart Money Management system which is calcul
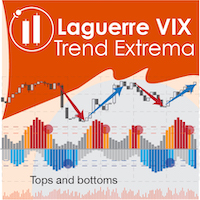
The Laguerre VIX Trend Extrema (LVTE) indicator detects market tops and bottoms. As its name suggests, LVTE is a percentage price oscillator that identifies extreme ranges in market price. How to use: Buy when the indicator was in the lower "blue" range for more than 2 candles, and then moves up into grey. Sell when the indicator was in the upper "red" range, and then moves down into orange. Please see screenshots for examples! To make it simple, the indicator can show this by paint

此EA是一个 高频交易系统 ,只在市场波动剧烈时进行交易。通过运用独特的技术指标,检测市场的短期波动,在价格形成突破时入场,并在几秒内抓住几个点迅速离场。每一个挂单都有内在止损,每一个已成交的单子有移动止损进行保护。 请注意,此EA的实盘表现严重依赖于对 经纪商 和 VPS 的选择。 推荐在一个真正的ECN经纪商开户,经纪商必须要有最低的点差,最小的手续费和最快的执行速度。 推荐在mql5.com上租赁 VPS ,把和服务器间的通讯延迟降低到0~2毫秒。 推荐在这些货币对上使用: EURUSD GBPUSD USDJPY EURGBP 。 推荐在 M1 周期上使用。 信号: https://www.mql5.com/en/signals/author/oodd008 回测: https://www.mql5.com/en/users/oodd008/blog
Parameters Lots - 使用固定手数 Risk - 根据账户净值自动计算手数,只有当Lots是0时才有效 EA_Comment - 设置自己的评论信息 MAGIC - Magic数字,无需更改 Max_Sprea
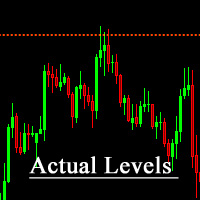
The indicator shows significant support and resistance levels. When the price approaches these levels, it in some way responds either to the levels themselves, or to the areas that are near these levels. These levels can be viewed as potential reversal zone. Accordingly, the levels can be used for performing trading operations or closing previously opened positions.
For example You can buy if the price rolls back from the support level upwards, or sell if the price rolls back from the resistanc

HC candlestick pattern is a simple and convenient indicator able to define candle patterns. Candlestick charts are a type of financial chart for tracking the movement of securities. They have their origins in the centuries-old Japanese rice trade and have made their way into modern day price charting. Some investors find them more visually appealing than the standard bar charts and the price action is easier to interpret. Hc candlestick pattern is a special indicator designed to find divergence
The Expert Advisor tries to enter the market at the beginning of a trend. If the price moves in the unfavorable direction, the EA hedges the deal by placing an opposite order with a larger volume. The EA will change direction in the course of the trend until it is captured. The minimum distance for changing direction is specified by the Min Turn Step parameter, the actual distance can be longer and depends on the current volatility, it is controlled by the Mult Factor Next Orders parameter. The
MetaTrader 市场 - 在您的交易程序端可以直接使用为交易者提供的自动交易和技术指标。
MQL5.community 支付系统 提供给MQL5.com 网站所有已注册用户用于MetaTrade服务方面的事务。您可以使用WebMoney,PayPal 或银行卡进行存取款。
