适用于MetaTrader 4的付费技术指标 - 89
Metatrader 4 的三个 MA 买入和卖出信号 PRO 指标是 3 MA 的交易系统,只要趋势转向相反方向,它就会发出买入和卖出信号。
该系统指标由使用 3 个不同时期的 3 条移动平均线组成。
该指标以箭头形式提供实际交易买卖信号。
在 MT4 交易平台上下载并安装指标后,它应该如下图所示。
关键点 趋势信号指标 非重绘箭头 初学者友好 非常值得添加到您的指标集合中 该指标可以与任何现有的交易策略或系统一起作为趋势反转信号确认工具。
基本交易信号 来自 Metatrader 4 的三个 MA 买入和卖出信号 PRO 指标的信号很容易解释,如下所示:
买 一旦图表上印有绿色信号箭头,就会发出买入信号。 将止损设置在支撑下方。 为预定的利润目标退出买入交易或等待卖出信号。 卖 一旦紫色信号箭头印在图表上,就会发出卖出信号。 将止损置于短期阻力之上。 为预定的利润目标退出卖出交易或等待买入信号。 可调参数和设置 MA方法,更快的MA周期,更慢的MA周期
随意探索指标的不同参数和设置以创建您自己的个性化指标设置。
关于该指标的更多信息 货币对:适用于任何货币对
交

MT4 的 3rd Candle Forex Scalper 指标是真正的剥头皮指标,适用于任何时间范围和货币对。
关键点: 蓝色箭头代表买入交易机会。 红色箭头代表卖出交易机会。 该指标非常可靠,重量轻,不会减慢您的交易平台。
如何与之交易? 每当图表上弹出蓝色黄牛箭头时,就建立买入头寸。
每当图表上弹出红色黄牛箭头时,就建立卖出头寸。
当图表上出现相反的交易信号时退出交易。
随意使用您自己喜欢的交易方法,通过 3rd Candle Forex Scalper 指标打开和关闭交易。
指标规格 交易平台:为 Metatrader 4 (MT4) 开发
货币对:适用于任何货币对
时间范围:适用于任何时间范围
输入参数:Shift 箭头、过滤牛熊蜡烛、颜色设置和样式
指标类型:剥头皮
重绘?不重绘彩色买卖剥头皮箭头。
如何编辑指标的输入和参数? 在附有指标的图表中用鼠标右键单击。
从下拉菜单中,单击指标列表。
从列表中选择指标并按编辑。
现在您可以编辑指标。
最后,按确定按钮保存更新的配置。

To download MT5 version please click here . This is the exact conversion from TradingView: "B-Xtrender" By "QuantTherapy". - It is an oscillator based on RSI and multiple layers of moving averages. - It is a two in one indicator to calculate overbought and oversold zones for different RSI settings. - This indicator lets you read the buffers for all data on the window. - This is a non-repaint and light processing load indicator. - You can message in private chat for further changes you need.

* All Symbols x All Timeframes scan just by pressing scanner button ** *** Contact me to send you instructions and add you in "Candle Scanner group" for sharing or seeing experiences with other users. Introduction: Candles tell their story. When looking at a candle, it’s best viewed as a contest between buyers and sellers. Candlestick patterns are used to predict the future direction of price movement. Candlesticks are an easy way to understand the price action. You can use candlesticks to decid

Metatrader 4 的 Obie Scalper 指标是一种易于使用的外汇剥头皮指标,可在较短的时间范围内快速获利。
该指标分析图表以寻找在各个交易时段可能出现的快速剥头皮机会。
最好的结果是在最动荡的交易时段(伦敦和美国)取得的。
当然,Obie Scalper 指标适用于您偏好的任何时间范围和货币对。
如何与之交易(示例)? 一旦浅蓝色箭头印在图表上,就开始买入剥头皮交易。
一旦洋红色箭头印在图表上,就开始卖出剥头皮交易。
以 8-15 点的利润退出交易。
利用短期止损来减少损失。
随意使用您自己喜欢的交易方法来打开和关闭 AFSTAR 外汇指标的交易。
指标规格 交易平台:为 Metatrader 4 (MT4) 开发
货币对:适用于任何货币对
时间范围:适用于任何时间范围
输入参数:周期、平均值、颜色设置和样式
指标类型:趋势
重绘?不重新绘制信号箭头。
DepthTrendView is an indicator that is used to see the direction of the market very clearly compared to the indicators that are commonly used by many people.
What is interesting about this indicator is that you can see the direction of the trend and also know that the market is at the end or that the market wants to start a new trend.
How to Use: 1- To see the earliest BUY direction you need to see previous candle below Aqua Line before green arrow appear.
2- To see the earliest SELL directi

Rapid 5M Scalper with Alerts indicator for MT4 是一款出色的买入/卖出快速信号工具,适用于剥头皮交易者和日内交易者。
这些信号非常容易理解,它们在主图表窗口中显示为蓝色和红色圆点。
买卖信号: 蓝色箭头是买入信号。 红色箭头是卖出信号。 随意尝试指标的不同设置和输入值。
该指标同样适用于所有货币对(主要货币对、次要货币对和外来货币对),如果使用得当,它会显示出可喜的结果。
带警报的 Rapid 5M Scalper 示例 下面的示例图表显示了 Rapid 5M Scalper with Alerts 指示器在 MT4 交易图表上的运行情况。
交易提示: 使用此剥头皮指标进行交易时,请随意使用您自己喜欢的交易入场、止损和获利策略。
与往常一样,根据整体趋势进行交易,并首先在模拟账户上进行练习,直到您完全理解该指标。
指标规格和输入: 交易平台:为 Metatrader 4 (MT4) 开发
交易工具:适用于外汇、股票、商品、股指、贵金属、能源和股票
时间范围:适用于任何时间范围
交易风格:适用于剥头皮交易、日内交易和

MA Revolution is upgraded version of standard Moving A verage. With the current upgrade moving average line got more sensitive with different market conditions. It gets more flexible by decreasing default period step by step while market is sharp and incrasing period back to default period step by step while market is normal again. testing of the ide a shows th at this upgr aded version gives much more acur acy for detecting m arket direction, ch anges in direction are shown much e arly th an
Place the indicator on the chart, preferably with a timeframe of H1 or H4. If you are trading in the daily range or, conversely, on lower timeframes, you will need to adjust the RSI and ATR levels accordingly.
The blue arrows of the indicator will be a signal to open a long position, the red arrows will be a signal to open a short position:
1) Blue arrow for longs (growth) and red arrow for shorts (decline).
2) Two horizontal lines for current positions (one for entry and one for stop).
3
This indicator is very useful for those who trade with investor techniques. That's why I named it InvestorTool. Why investors? Isn't this a tool for trading? This indicator is basically to help investors to identify which pairs are very close to their All-Time-Low or All-Time-High. So that the investor will quickly spot which instruments are "relatively" at its low cost, and telling the minimum equity required.
If the pair is close to All-Time-Low then investor can put a buy position. When t

NOTE: PRICE WILL RISE VERY SOON. DON'T SKIP THIS OFFER! Dear traders I am glad to introduce the " Market Swing Scanner Board" indicator to you. This indicator was made mainly to be used in combination with the Market Swing Index Indicator. You use the "Market Swing Scanner Board" indicator to scan for trading opportunities on the Market Swing Index Indicator . This tool is designed for serious traders who have decided to make a difference through trading. Be the next person to witness this st
市场结构MTF指标是一个成功的尝试,以形式化结构的价格运动使用一个独特的算法。 它准确地将任何价格走势分解为其组成元素,并允许您不会错过任何有趣的进入或退出点。 市场结构MTF指标的一个重要特征是在两个时间框架上同时可视化价格变动的结构–在当前和任何旧的时间框架上由用户选择。 尽管与各种曲折的外部相似性,但这个指标与它们根本不同,并且没有曲折具有的所有缺点–延迟和重绘。 市场结构MTF指标的使用允许您仅基于"动量修正"结构工作,既可以跟随趋势,也可以确定趋势反转的时刻。 此外,该指标与任何交易系统和策略(水平,趋势线,市场概况,保证金区域,期权水平等)完美结合,加强它们,并允许您在运动开始时找到切入点,并在趋势方向 此外,以下工具包含在市场结构MTF指标中: *Fibo回撤和Fibo扩张,以确定价格移动路径上的移动目标和重要区域 *在自动模式下构建水平线-由当前和旧时间框架上高于和低于当前价格的重要极端值确定的最近支撑和阻力水平。 *自动检测当前和较早的时间帧(上升/下降趋势或持平)的市场状况,并以箭头的形式输出这些信息 *"智能"警报-按一个按钮设置标记。 当触摸哪个价格时,用户收

Analyzing multiple time frames of a currency pair in one window can make you confused. To analyze multiple time frames, you need reliable indicators. One of them is using 9TF RSI MA . I've been working day and night to create code that is simple but reliable and covers all nine time frames in just one indicator . Let's look at some of the advantages of this indicator: Colorful histogram . The color of the curve in each timeframe is different from one another. Arrows indicating the crossing of

KT Trend Exhaustion is our personal implementation of the famous Trend Exhaustion Index developed by Clifford L. Creel, Ph.D., in 1991.
The change in price direction often comes with uncertainty. TEI helps to tackle the uncertainty by showing a crisp direction using the smoothed color-changing index.
Features
Easy to use and interpret. It comes with a multi-timeframe scanner that scans the upcoming signals across all the time-frames. It can be used as an entry signal or trend confirmation. Al

KT Know Sure thing is a momentum oscillator based on the smoothed rate of change over four different timescales and was developed by Martin Pring. In 1992, Pring published the initial description of the indicator in Stocks & Commodities magazine's "Summed Rate of Change (KST)" article. KST creates a momentum oscillator by combining the price momentum measurements from four different price cycles. Traders can utilize KST to search for bullish or bearish divergences, signal line crossovers, and ce

KT Forex Line can be described as an improved version of the moving average indicator. The indicator is embedded in the main trading chart and features a line that switches between blue and white depending on the prevailing direction or mood of the market.
Utilizing the indicator is simple. You do not need to understand complex graphs and intricate lines. Recognize the indicator line's color and trade accordingly.
Key Features
The indicator has customizable colors, with the blue and red being

The KT Market Speed is a unique and straightforward oscillator-based technical analysis tool that helps traders visualize the speed at which the price of an instrument changes based on the preset length. The Market Speed representation helps correctly map the price momentum: is it moving fast, slowing down, or trapped in a range? These are the questions the indicator answers, giving traders more bandwidth to execute better-informed trade positions.
Formula
It's a simple technical analysis tool

KT Forex Super Scalper is created to identify market trends and plot trade signals based on the direction of the predetermined trend. It functions very similarly to moving averages but reacts quickly to changes in price actions and can signal right away once a valid trend is confirmed. The quick reactionary feature makes it a valuable tool for scalpers. However, anyone familiar with moving averages can use it for actual trading because of its signaling process and chart demonstration simplicity

The double top bottom pattern is arguably one of the technical analysis's most popular chart patterns. These patterns are used to capitalize on recurring patterns and identify trend reversal patterns, thereby creating well-placed entry and exit levels. The KT Double Top Bottom is based on these patterns and fine-tunes the trade signal development process for traders.
Features
It's based on one of the most reliable trading patterns and brings some fine-tuning and automation to the process. Also

多个指标合二为一......以产生高赢信号 给我发消息以获取完成系统的奖励指示器和操作方法策略 使用单个指标生成的信号在交易时可能会有风险。 这是因为仅使用一个指标进行交易会给出更多错误信号。 因此,许多外汇交易者使用三个或更多指标来过滤掉良好的交易设置。 然而,对信号使用多个指标也可能会变得复杂和混乱。 当这些指标产生相互矛盾的信号时尤其如此。 然而,Obie Gold Scalper 指标通过使用多个指标提供良好的信号。 因此,MT4 的 Obie Gold Scalper 指标避免了指标矛盾的问题。 交易信号: 绿色箭头是买入信号。 红色箭头是卖出信号。 指标规格和输入:
货币对:适用于任何货币对 时间范围:适用于任何时间范围 交易风格:适用于剥头皮交易、日内交易和波段交易 输入参数:变量(输入选项卡)、颜色设置和样式 指标类型:信号 指标是否重绘? 不。 Live Testing Tester Screen Record Video

PLEASE LEAVE US A 5-STAR REVIEW LDS Scalper User Manual+ Extra LDS CSDIF INDICATOR + Training Videos ABOUT LDS SCALPER INDICATOR STRATEGY Built on 15+ years of trading experience. LDS Scalper is a very powerful trading indicator for scalping strategy, returns very high accuracy rate in forex, futures, cryptocurrencies, stocks and indices. This indicator displays arrow signals based on price action information with high accuracy. The LDS Scalper Indicator strategy when applied can turn a ne
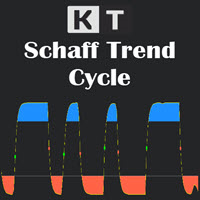
The Schaff Trend Cycle (STC) is a technical analysis tool that helps traders and investors plot highly-probable predictions on the price direction of an instrument. Due to its predictive properties, It's a good tool for foreign exchange (forex) traders to plot buy and sell signals. The Schaff Trend Cycle was developed by prominent forex trader and analyst Doug Schaff in 1999. The idea driving the STC is the proven narrative that market trends rise or fall in cyclical patterns across all time fr
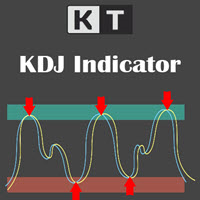
Basic technical analysis tools use signals during market changes by providing critical information that can influence investment and trading decisions. Several technical analysis tools are developed for this purpose, and one of the most popular indicators traders use the KDJ Random index. It's known as the Random Index, is primarily a trend-following indicator that aids traders in identifying trends and prime entry points.
Features
It analyzes and projects changes in trends and price patterns
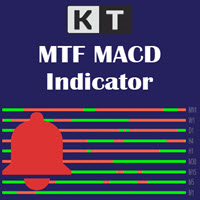
作为一名交易者,同时监控多个时间周期可以帮助你更好地了解市场趋势,并判断多个周期之间是否达成一致或存在分歧。 KT 多时间周期(MTF)MACD 指标可在一个图表中显示所有时间周期的 MACD(移动平均收敛/发散)情况,从而提供整体方向的可视化概览。 该指标以表格形式展示每个时间周期对应的 MACD 趋势,你还可以在图表上直观地看到 MACD 是否在各周期中增强或减弱动量。
功能特点
KT MTF MACD 可同时监控多达 5 个不同的时间周期、周期间隔和交易品种。 它能够识别每条数据流的 MACD 趋势状态和信号。 将多时间周期的复杂图表整合为一个简洁的概览视图。 通过减少使用的图表和指标,节省电脑资源。 支持高级颜色编码功能和自定义选项。 当趋势变化时,可通过提醒功能第一时间通知你。
结论 多时间周期交易是提升交易效果的优秀方法,因为它可以帮助你在更大趋势中找到最佳入场点。 通过 KT MTF MACD,你无需在多个图表中来回切换,它允许你在一个界面中观察多个时间周期的市场行为。 你可以先在模拟账户中测试该指标,看看它如何与你的交易策略结合。

Confluence Indicator is unique indicator which collects differnt popular indicators and analyzes their data. It decides an overall trend with its strength. It is not only helpful for identifying the the current picture of the market but also helps traders to stay away from non trending market. It maximize the chance of winning by giving an aggregate picuture of markets best reliable technical indicator settings There are total 7 types of signal which this indicator provides. Each candle will sho

WARNING!! THIS SWORD IS TOO SHARP! ONLY 10 COPIES LEFT FOR THE NEXT PRICE TO BE 8,000$ FOR UNLIMITED PLAN. Dear traders I am very glad once again to introduce to you my other tool called "Forex Sword Indicator". In short this tool is meant to give you an edge over the market that you have been waiting for so long. Now, here it is. It is a very very simple tool but yet a dangerous sword. I call it a Holy grail indicator!. I will not talk a lot about this tool. Just let the tool speak by itse
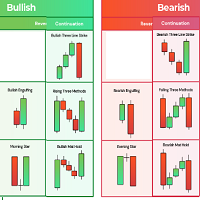
simple indicator based on some candle patterns recognition arrows appear on candles when bear signal / bull signal based on candle pattern recognition two strategies available you can enable / disable them indicator can work on any chart and time frame i prefer to work on high time frames especially the Daily charts D1 red arrows appears above candle showing a bear signal after candle completed - arrow will be blue during candle formation Green arrows appears below candle showing a bull signal a
The Ichimoku indicator is an entire system by itself with an amazing win rate many traders feel that the chart looks like a mess when we add the indicator to the chart this is because there are too many elements present in the indicator we have a solution for that now "TT Ichimoku on off button indicator" ABOUT THIS INDICATOR This is an Ichimoku indicator that has the toggle feature separately for every element ie. Kumo cloud button, kijun button, etc... you can also hide/show the indicator
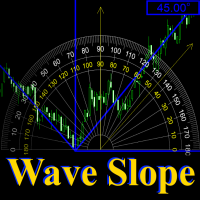
Wave Slope - works on the basis of the ZigZag indicator and is designed to measure the slope of the current wave, in degrees.
The sharper the angle of inclination, the stronger the trend. And on this you can build a trading system.
In the settings, you can connect the ZigZag indicator, set the color and width of the slope line.
And you can also turn on and off the sound signal, which is triggered in case of a change in the slope of the wave.

What Is the Coppock Curve? The Coppock Curve is a long-term price momentum indicator used primarily to recognize major downturns and upturns in a stock market index. It is calculated as a 10-period weighted moving average of the sum of the 14-period rate of change and the 11-period rate of change for the index. It is also known as the "Coppock Guide."
Example of How to Use the Coppock Curve Apply the Coppock Curve to a weekly/monthly price chart of a stock index or stock index exchange traded f

Hercules is a trend indicator which is a very powerfull tool to enter into the position at right time. it also indicates the the rangebound areas very easyly. Its visual representation is same like supertrend . But it is more advanced then super trend . If you combine the entry signal of multiple time frame it would give 98% accuracy in most of the symbols. Additional Features Notification Alerts Email Arrow for buy and sell signals Easyly accesible buffers for EA development
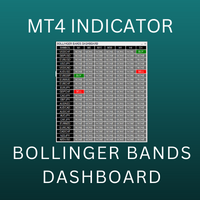
Bollinger Bands Multi Dashboard MT4 uses the value of Bollinger Bands indicator. This dashboard will monitor all symbols in the market watch. We can set up to receive an alert, notification or an email when the buy/sell signal appear on each timeframe. You can check all symbols via only 1 chart. This dashboard will check almost popular time frame (M1,M5,M15,M30,H1,H4 and D1). The colors can be customized. We can have a look at many pairs and many time frames without opening the chart. In additio
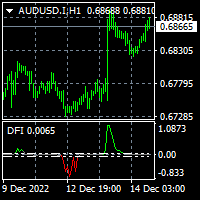
To download MT5 version please click here . - This is the exact conversion from TradingView: "Trend Direction Force Index - TDFI [wm]" By "causecelebre". - This indicator uses multiple levels of averaging to detect trend strength. - You can optimize filter low and filter high levels to achieve best results. - You have access to buffers to use in EAs. - This is a light-load processing and non-repaint indicator. - You can message in private chat for further changes you need.

Analyzing multiple time frames of a currency pair in one window can make you confused. To analyze multiple time frames, you need reliable indicators. One of them is using 9TF MACD Limited Bar . I've been working day and night to create code that is simple but reliable and covers all nine time frames in just one indicator . Attention! When first installed, the indicator does not look intact. Changing the timeframe will solve the problem. Let's look at some of the advantages of this indicator: C

Analyzing multiple time frames of a currency pair in one window can make you confused. To analyze multiple time frames, you need reliable indicators. One of them is using 9TF STOCH RSI LIMITED BAR . I've been working day and night to create code that is simple but reliable and covers all nine time frames in just one indicator . Attention! When first installed, the indicator does not look intact. Changing the timeframe will solve the problem. Let's look at some of the advantages of this indicat

The most crucial price level in any "Volume Profile" is the "Point of Control" . Is the price level with the highest traded volume. And mainly, is the level where the big guys start there their positions, so it's an accumulation/distribution level for smart money.
The idea of the indicator arose after the "MR Volume Profile Rectangles" indicator was made. When creating the "MR Volume Profile Rectangles" indicator, we spent a lot of time comparing the volumes with those from the volume profile
在 V2 上添加警报
现场测试
Metatrader 4 的 NoRepaint Signals 指标是一个完整的外汇交易系统,可在图表上打印准确的买卖箭头。
该指标使用多个指标来生成高赢信号交易 该指标在主 MT4 图表窗口中显示为绿色和红色箭头。
使用单个指标生成的信号在交易时可能会有风险。 这是因为仅使用一个指标进行交易会给出更多错误信号。 因此,许多外汇交易者使用三个或更多指标来过滤掉良好的交易设置。
然而,对信号使用多个指标也可能会变得复杂和混乱。 当这些指标产生相互矛盾的信号时尤其如此。 然而,NoRepaint Signals 指标通过使用多个指标提供良好的信号。 因此,MT4 的 NoRepaint Signals 指标避免了指标矛盾的问题。
这些指标组合起来就是移动平均线、相对强度指数、布林带、魔术过滤器、赫尔和我自己的两个个人指标。 只需按照指示器显示的信号操作即可!
交易信号: 绿色箭头是买入信号。 红色箭头是卖出信号。 NoRepaint Signals 指标可用于交易进入和退出,或用作其他策略和系统的趋势确认信号指标。
该指标同样适用于所有货
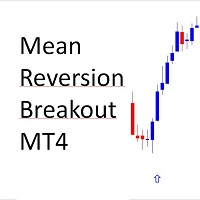
Buy and Sell Arrows when price breaks away from mean price. Sends Alerts – On MT4 To Your Phone To Your Email
Does not repaint .
Works on any Forex pair, any timeframe.
10 Activations allowed so you are free from limitations >> MT5 Version Here
For spreads from a tiny 0.1 pips RAW/ECN Accounts, click here . Check out my Waka Esque EA signal here: >> High Risk Settings or Medium Risk Settings .
What Is The Meaning Of Mean Reversion? Mean reversion, or reversion to the mean, is a theor

Dear Traders this is my another tool called " Swing Master Indicator ". As the name above the indicator is designed to help you in swing trading by capturing the low and highs of the price. You may us this tool with any trading strategy and style from scalping to position trading. It is made for level of traders including newbies and advanced traders even prop-firms, hedge funds and banks to help them make sold market analysis. I create tools for serious traders who want to make a difference in

!! FLASH SALE !! Over 80% off !! For ONE week only. Now only $47 - normally $297! >>> Ends on 30 June 2023 - Don't miss it!
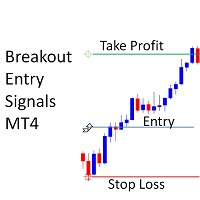
Buy and Sell Alerts when price breaks out following strict price action. Sends Alerts – On MT4 To Your Phone To Your Email
Does not repaint .
Works on any Forex pair, any timeframe.
10 Activations allowed so you are free from limitations >> MT5 Version Here For spreads from a tiny 0.1 pips RAW/ECN Accounts, click here . Check out my Waka Esque EA signal her

QCAFE+ Trend Filters is a simple but useful for Traders to eliminate false signal from all kinds of Buy/Sell signal indicators. With QCAFE+, Traders can identify UP Trend/DOWN Trend or SIDEWAY period of Market to decide whether Enter a Trade or Not. With 5 Elements of Filters which are shown the Momentum and Strength of the Market; Each element has 3 types of arrows to show Uptrend (Blue UP arrows), Down Trend (Orange Down arrows) or Sideway (Grey Arrows). The Top Element is the main signal tha

The indicator returning pivot point based trendlines with highlighted breakouts . Trendline caculated by pivot point and other clue are ATR, Stdev. The indicator also includes integrated alerts for trendlines breakouts and foward message to Telegram channel or group if you want. Settings · Lookback bar: Default 200 is number of bar caculate when init indicator. · Length: Pivot points period · Slope Calculation Method: Determines how this lope is calcula
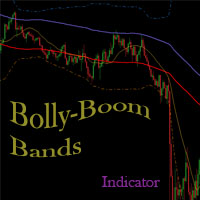
Bolly Boom Bands is an indicator which identifies when a Trend is strong and when it is not, hence it is just a lateral oscillation of the price which can push you to waste money opening inconsistent positions. It is so easy to use and similar to kind-of Bollinger Bands with Fibonacci ranges, it will be useful to find those channels where you should wait if price is inside or when these are broken to start operating into the trend area... As you can imagine it is recommended for opening position

用箭頭顯示價格反轉點。 適用於所有時間範圍和所有貨幣對。 適用於剝頭皮交易和長期交易。 當藍色箭頭出現時,您需要開一個買單。 當紅色箭頭出現時,您需要開賣單。 推薦時間框架 M5、M15、H1、H4。 該指標顯示 GBPUSD、XAUUSD、EURUSD、USDJPY、AUDUSD、USDCHF、EURGBP、EURJPY、EURCHF 和其他主要貨幣對的最佳結果。
該指標非常適合日內剝頭皮,因為它每天在較小的時間範圍 M5 和 M15 上顯示許多切入點。 也就是說,使用這個指標,我們可以在一天之內收到很多進場信號。
該指標的好處: 適合剝頭皮交易 在一天之內提供許多有效的入口點。 適用於所有時間範圍 適用於所有貨幣對
建議: 出現藍色箭頭時打開買單 出現紅色箭頭時打開賣單
指標設置: Averaging_Period - 指標的工作平均數。 此參數設置信號的數量和精度。 Send_Email - 發送信號到電子郵件和電話 width - 信號箭頭的大小
獎金: 購買指標 發表評論。 誠實的評論。 不一定好。 審查必須是誠實的。 獲得機器人作為禮物 https://www.
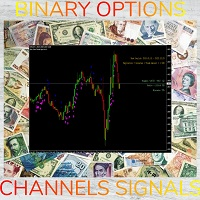
SYSTEM INTRODUCTION: The Binary Options Channels System Is Specifically Designed For Binary Options Trading. Unlike Other Systems And Indicators That Were Adopted From Other Trading Environments For Binary Options. Little Wonder Why Many Of Such Systems Fail To Make Money . Many End Up Loosing Money For Their Users. A Very Important Fact That Must Be Noted Is The Fact That Application Of Martingale Is not Required. Thus Making It Safer For Traders Usage And Profitability. A Trader Can Use Fi
SYSTEM INTRODUCTION: The Binary Options Momentum System Is Specifically Designed For Binary Options Trading. Unlike Other Systems And Indicators That Were Adopted From Other Trading Environments For Binary Options. Little Wonder Why Many Of Such Systems Fail To Make Money . Many End Up Loosing Money For Their Users. A Very Important Fact That Must Be Noted Is The Fact That Application Of Martingale Is not Required. Thus Making It Safer For Traders Usage And Profitability. A Trader Can Use Fi

TradeMo 是一個 100% 準確的信號指標,僅響應價格行為。 因此,當 8 條線性移動平均線穿過 10 條線性移動平均線時,預期買入信號,當 8 條線性移動平均線低於 10 條線性移動平均線時,預期賣出信號。 而已! 看我在這裡解釋我是如何使用它的。
該指標會針對所有時間範圍進行調整,但我建議使用更高的時間範圍,例如 1 小時時間範圍,以最大化您的點數。 我有一種獨特的方式來解釋為什麼更高的時間框架在這裡使交易變得如此容易。
我不使用止損,但如果您必須使用,我建議您只使用 5 點止損。
指標說明: 為避免虛假信號,只有在出現信號警告框時才開始交易。 聲音通知可用。 為獲得最佳結果,我建議在 1 小時時間範圍內進行交易。 箭頭也將出現在圖表上,向下表示賣出交易,向上表示買入交易如果出現箭頭但沒有發出警報,則這是一個錯誤信號,因此可以防止重新繪製。
幾個月前,當我終於完成了這個指標的開發時,我製作了這個視頻來展示我的新指標的功能,直到今天它仍然完美運行。 在這裡使用我的課程僅 1 週後,聽聽一個完全陌生的人不得不說的話。 您可以在下面視頻的設置中關閉字幕您的語言。

VaviStar is an indicator based on trend retracements determined by ZigZag segments. It is theorized, and statistics confirm, that stocks react to certain retracement levels. Many use Fibonacci retracement levels (23.6%, 38.2%, 61.8%). It is assumed that once the price goes beyond the 61.8% retracement, we can already speak of a trend reversal. This indicator allows you to comfortably chart a segment of the ZigZag with the relative operating levels chosen. With a reversal mindset , you can use it
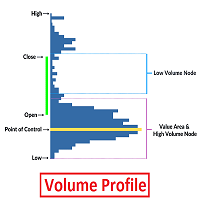
Volume Profile is an advanced charting study that displays trading activity over a specified time period at specified price levels. The study (accounting for user defined parameters such as number of rows and time period) plots a histogram on the chart meant to reveal dominant and/or significant price levels based on volume. Essentially, Volume Profile takes the total volume traded at a specific price level during the specified time period and divides the total volume into either buy volume or s

MAD - Moving Average Distance The MAD Indicator uses ATR and the distance to a moving average to determine if price has the potential for mean reversion. Works on all time frames and pairs. It will only check for the condition at the beginning of a new candle so it doesn't repaint. A signal will include an arrow on the chart, alert popup and cell phone notification.
Settings: ATR_Multiplier: Multiplier of ATR for the calculation. (Recommended: 5)
MA_Period: Moving Average Period to use (EMA).

Real Trade 在 1 小时以下的时间范围内进行交易。 在上升趋势和下降趋势方向上交易。 与更高的时间趋势方向交易并交易第一根蜡烛。 使用相反的比例退出或使用比率退出 1:1 或更高以及追踪止损。 在活跃时间和更高的趋势方向交易真实趋势以获得最佳结果。 在测试仪中加载指示器以研究结果和潜力。 使用顺势交易的剥头皮箭头或使用斐波那契目标或两者兼而有之。 推荐用于 5 或 15 分钟图表。
将 FIb 用于目标和止损: https://www.mql5.com/en/code/12813
Real Trade 在 1 小时以下的时间范围内进行交易。 在上升趋势和下降趋势方向上交易。 与更高的时间趋势方向交易并交易第一根蜡烛。 使用相反的比例退出或使用比率退出 1:1 或更高以及追踪止损。 在活跃时间和更高的趋势方向交易真实趋势以获得最佳结果。 在测试仪中加载指示器以研究结果和潜力。 使用顺势交易的剥头皮箭头或使用斐波那契目标或两者兼而有之。 推荐用于 5 或 15 分钟图表。
将 FIb 用于目标和止损: https://www.mql5.com/en/code/12813

Dear Trader It is my pleasure to introduce to you my tool called the " Forex Sniper Indicator" . The major aim of this tool is to help serious traders and investors in all type of Financial Markets to catch price next movement right at the moment the price direction is about to change. This tool can be used to snipe the price direction in both down trend, uptrend and ranging markets. This tool can be used as the stand alone tool though it may be combined with other tools as well. My goal is to h
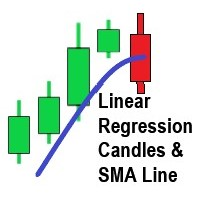

Uses a trend filter to plot the lines and arrows. Great for scalping. Settings: TrendPeriod: change to your preference. Alerts. How to use: Can be used on any time frame. Attached to chart, and wait for arrow to appear on multiple timeframes. Buy : - Blue arrow and blue line cross below price on multiple time frames; e.g., on D,W,M or H1,H4,Daily or M30,H1,H4 Sell : - Yellow arrow and red line cross above price on multiple time frames; e.g., on D,W,M or H1, H4, Daily or M30,H1,H4
**Best re

To get access to MT5 version please click here . - This is a conversion from TradingView: "Hull Suite" By "Insilico". - This is a light-load processing and non-repaint indicator. - You can message in private chat for further changes you need. note: Color filled areas and colored candles are not supported in MT4 version. Here is the source code of a simple Expert Advisor operating based on signals from Hull Suite . #property strict input string EA_Setting= "" ; input int magic_number= 1234 ; inp

DYJ RSI控制器 是一个全货币对RSI交易系统它能显示每一个货币对M1到MN周期的RSI值当某个周期的RSI值达到超卖区和超买区时有颜色提示,你能根据这些信息做出正确的交易 请你制作一个RSI指标模板命名为DYJ RSI,保存它 当你用鼠标单击超卖区或者超买区时,自动打开相应货币对 周期的 图表,并加载RSI指标 INPUT
InpPairs = "GBPUSD,EURUSD,USDJPY,USDCHF,XAUUSD,USDCAD,GBPJPY,EURJPY,EURGBP,EURAUD,EURNZD,EURCAD,CADJPY,AUDUSD,AUDNZD,AUDCAD,AUDJPY,NZDJPY,NZDUSD,NZDCAD,GBPAUD,GBPNZD,GBPCAD,CHFJPY,NZDCHF,AUDCHF,EURCHF"; InpStrategyMinTimeFrame = PERIOD_M1 -- Strategy MinPeriod InpStrategyMaxTimeFrame = PE

Bank Executive Indicator Uses A Simple method of tracking price as it moves across the chart and signals when a potential long or short position is active and indicates this to the trader giving you the opportunity to take a position on the market. Or you can simply use this indicator to give yourself signals and determine if you want to take the trade or learn the strategy on your own.
To measure the daily range, sell when above 30 pips in the European or US session, buy when below 30 pips in the European or US session. Take profit only around 30 pips because this is only an indicator for daily trading. FEATURES : Sum Range, max 30 Show Rectangle
Show Level
OC SR Line Width OC SR Line Color Show Label
Custom Label Position
Custom Font Label
Custom Font Size
Custom Mark Session
Show Line Break Event Point

最佳止损点查找工具使用常规的流行止损技术,如固定止损或将其置于以前的高点和低点之下,由于一些原因,是不利的。1. 经纪人已经知道这些区域,所以他们很容易采取这种做法。2. 2.你不能总是使用固定的止损,因为市场在不同的时间会变得非常宽广或非常稀薄,你要么从市场中获得更少的收益,要么过度暴露自己,迅速被止损。3. 3.当你使用已经流行的止损技术来设置你的止损时,很多其他人可能会像你一样使用这个止损。某些经纪商甚至可能把你的交易看作是抄袭其他交易者的,只因为你使用了类似的止损价格。通过我们的工具,我们创建了一个定制的算法,部分使用ATR,实时计算市场宽度,并在任何时候都给出一个最佳位置,在稀薄的市场中缩小止损尺寸,在扩大的市场条件下扩大止损尺寸,给你的交易足够的空间,以便市场在将你的交易取出或达到你的止损价格之前进行斗争。这是我们最好的工具之一,可以帮助在疯狂的市场条件下保持你的头寸安全。它是完全可定制的,而且你可以在任何市场上使用它。

Median Renko Terminator works best with renko charts if you do not have a renko chart generator I will email it to you for free and give you the correct settings for scalping or to swing trade NON-REPAINT COMES WITH ALERTS WHEN THERE IS A SIGNAL Conditions to sell: big purple arrow shows you the direction first then you take the small purple arrow to enter the same direction of the purple arrow. Conditions to buy: big white arrow shows you the up direction first then you take small white arrow
Exponential moving average (EMA) and super trend are popular and good indicators that is often and used to determine the trend direction. One of the best trading strategies with trailing stop is trading strategy with using a combination of Exponential Moving Average (EMA) and Super Trend indicators. EMA SuperTrend Strategy Indicator is the indicator consist of EMA, Super Trend and Alert function also other calculations are needed. It's also has extra indicator there are Automated Fibonacci Retr

Bank Expert Indicator Uses A Simple method of tracking price as it moves across the chart and signals when a potential long or short position is active and indicates this to the trader giving you the opportunity to take a position on the market. Or you can simply use this indicator to give yourself signals and determine if you want to take the trade or learn the strategy on your own. The Signals From this indicator are targeted at long-term positions and focus on top quality call outs.
!! FLASH SALE !! Over 80% off !! For ONE week only. Now only $47 - normally $297! >>> Ends on 30 June 2023 - Don't miss it!
Sends Alerts – On MT4 To Your Phone To Your Email
Does not repaint .
Works on any Forex pair, any timeframe.
10 Activations allowed so you are free from limitations >> MT5 Version Here
For spreads from a tiny 0.1 pips RAW/ECN Accounts, click here . Check out my Waka Esque EA signal here: >> High Risk Settings or Medium Risk Settings .
What Is An Order Blo
The indicator is coded to be suitable for every parity and every period. The purpose of the indicator is to capture the correct signal levels. The product is equipped with all notification and alarm options. In this way, you will be able to receive signals even if you are not at the screen. The product tries to find the signals in the trend direction as a strategy. Thus, it is more reliable. you have input signals. For default settings, recommended periods should be M15,M30,H1.

Innovative Max Min swing This is a really different indicator for drawing Max and Min on the charts. This indicator draws Min and Max levels in a innovative way, based on a volatility proprietary calculation. In this way you will be able to draw trendlines in an objective way and also to see the break of Max and Min levels. You have three paramaters you can play with, in order to suite the volatility to your trading style. The indicator works on every time frame. Added: - Sound Notification
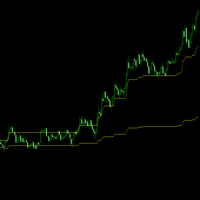
Is the market ranging (balance) or trending (Imbalance) ? This indicator exports a huge concept used in volume analysis (value area) into the price action. It makes it on Intraday level. How to read it? Simple! But you need to make practice. Making profit in market is more than a 2-rule system.
When the price inside the lines, the market is in "range mode".
If the price is above the upper line, the market is trending up.
If the price is below the lower line the market is trending down. Yo

Clear trend filter This is a filter-trend indicator. From the settings you can select to use more filter or less. The very interesting part of the indicator comes out using with all the filter. In this way you can follow the trend easily even when the market is without a strong trend, but is instead more flat. I personally use it on 1 minutue timeframe with MORE FILTER (you can select it from the input setting) in order to have an overlook of trend in the market. Added: - Sound Notificatio
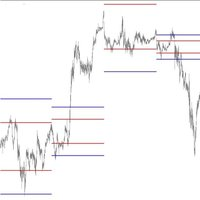
Equilibrium Levels support resistence Intraday indicator --> it means it works on lower TimeFrames , from 1minute to 4hours. This indicator is able to calculate and draw 2 levels (1 support and 1 resistence) representing the Barycenter's levels for a specific day session. From the setting you can choose only one parameter, that's the lenght of Barycenter's orbit. I personally attach the same indicator 2 times on the same chart, inputting as orbit: 0.15 and 0.30. Then what you will no
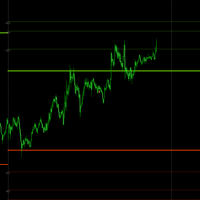
This indicator draws the projections of Fibonacci above the yesterday high and below the yesterday low. Why?
1) First of all, in this you can take the pulse of the market (trend or range). For instance If the price runs above yesterday's high the trend is UP.
2) In this way you will have automatic targets for the trend
3) you can wait the market on excess levels for contrarian and low risk trades.
If you buy the product feel free to contact me for additional tips or info.
I wish you all t
学习如何在MetaTrader AppStore上购买EA交易,MetaTrader平台的应用程序商店。
MQL5.community支付系统支持通过PayPay、银行卡和热门付款系统进行交易。为更好的客户体验我们强烈建议您在购买前测试EA交易。
您错过了交易机会:
- 免费交易应用程序
- 8,000+信号可供复制
- 探索金融市场的经济新闻
注册
登录