适用于MetaTrader 4的付费技术指标 - 62

The reason why many traders new to using the Fibonacci retracement tool find it hard to effectively use it is because they are having trouble identifying swing points that are significant enough to be considered.
Main Features Show Fibonacci number with LL to HH in multitimeframe
Show 23.6,38.2,50,61.8,78.6,88.6,100,112.8,127.2,141.4,161.8,200,224,261.8,314,361.8 and 423 of Fibonacci number
Easy to use with simple interface. Real time information for the Fibonacci number .
Settings Global
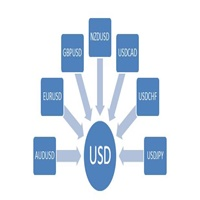
The USDIndex is the USD dollar index, which is integrated for the seven currencies of AUDUSD, EURUSD, GBPUSD, NZDUSD, USDCAD, USDCHF and USDJPY. Through this index, the direction of USD overall trend can be intuitively understood. The USDIndex works better with other indexes in combination. For example, the combination of USDIndex and AUDIndex can directly reflect the trend of currency AUDUSD. It is easy to understand that the currency AUDUSD is split into two indices, one is the USDIndex and
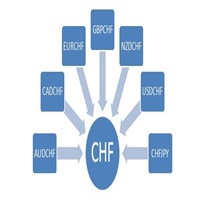
The CHFIndex is the Swiss franc index, which is integrated for the seven currencies of AUDCHF, CADCHF, EURCHF, GBPCHF, NZDCHF, USDCHF and CHFJPY. Through this index, the direction of CHF overall trend can be intuitively understood. The CHFIndex works better with other indexes in combination. For example, the combination of CHFIndex and JPYIndex can directly reflect the trend of currency CHFJPY. It is easy to understand that the currency CHFJPY is split into two indices, one is the CHFIndex an
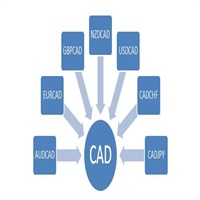
The CADIndex is the Canadian dollar index, which is integrated for the seven currencies of AUDCAD, EURCAD, GBPCAD, NZDCAD, USDCAD, CADCHF and CADJPY. Through this index, the direction of CAD overall trend can be intuitively understood. The CADIndex works better with other indexes in combination. For example, the combination of CADIndex and EURIndex can directly reflect the trend of currency EURCAD. It is easy to understand that the currency EURCAD is split into two indices, one is the CADInde
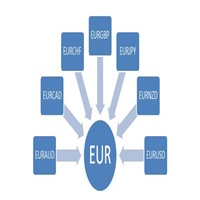
The EURIndex is the Europe dollar index, which is integrated for the seven currencies of EURAUD, EURCAD, EURCHF, EURGBP, EURJPY, EURNZD and EURUSD. Through this index, the direction of EUR overall trend can be intuitively understood. The EURIndex works better with other indexes in combination. For example, the combination of EURIndex and CHFIndex can directly reflect the trend of currency EURCHF. It is easy to understand that the currency EURCHF is split into two indices, one is the EURIndex
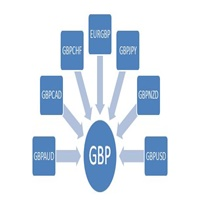
The GBPIndex is the Pound index, which is integrated for the seven currencies of GBPAUD, GBPCAD, GBPCHF, GBPJPY, GBPNZD, GBPUSD and EURGBP. Through this index, the direction of USD overall trend can be intuitively understood. The GBPIndex works better with other indexes in combination. For example, the combination of GBPIndex and NZDIndex can directly reflect the trend of currency GBPNZD. It is easy to understand that the currency GBPNZD is split into two indices, one is the GBPIndex and the
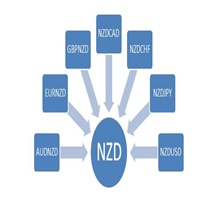
The NZDIndex is the Pound index, which is integrated for the seven currencies of AUDNZD, EURNZD, GBPNZD, NZDCAD, NZDCHF, NZDJPY and NZDUSD. Through this index, the direction of USD overall trend can be intuitively understood. The NZDIndex works better with other indexes in combination. For example, the combination of NZDIndex and GBPIndex can directly reflect the trend of currency GBPNZD. It is easy to understand that the currency GBPNZD is split into two indices, one is the NZDIndex and the
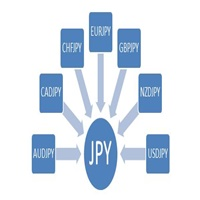
The JPYIndex is the YEN index, which is integrated for the seven currencies of AUDJPY, CADJPY, CHFJPY, EURJPY, GBPJPY, NZDJPY and USDJPY. The JPY Index works better with other indexes in combination. For example, the combination of JPYIndex and AUDIndex can directly reflect the trend of currency AUDJPY. It is easy to understand that the currency AUDJPY is split into two indices, one is the JPYIndex and the other is the AUDIndex. Through the analysis, it can be intuitively found that, in a

Do you want to see the future lines of the ZigZag indicator? This indicator will help you do that because the indicator model is based on two indicators: Historical Memory and ZigZag. So it can forecast the ZigZag lines. Very useful as an assistant, acts as a key point to forecast the future price movement. The forecast is made using the method of searching the most similar part in the history (pattern) to the current one. The indicator is drawn as a line that shows the result of change o

FXC iCCI-DivergencE MT4 Indicator
This is an advanced CCI indicator that finds trend-turn divergences on the current symbol. The indicator detects divergence between the CCI and the price movements as a strong trend-turn pattern.
Main features: Advanced divergence settings
Price based on Close, Open or High/Low prices Give Buy/Sell open signals PUSH notifications
E-mail sending Pop-up alert Customizeable Information panel Input parameters: CCI Period: The Period size of the CCI indicator.
C

You cannot predict 100% where the price will go ... However, having a better price zone to open a trade when there is a trading signal always puts you in a better position.
Indicator "PivoZone" is based on the author's method for determining price reversal-continuation zones. Indicator supports all timeframes with clear visualization on the chart. Unlike standard pivot points, it takes into account the volatility of an asset and allows for a better definition of the market entry zone. Suitabl

This gives you many opportunities and gives you beautiful goals in a short time that you can see for yourself and this indicator depends on the foundations and rules of special knowledge It also gives you entry and exit areas with very good and profitable goals This is an indicator that I have been training on for a long time The results were more than impressive

FXC iDeM-DivergencE MT4 Indicator
This is an advanced DeMarker indicator that finds trend-turn divergences on the current symbol. The indicator detects divergence between the DeMarker and the price movements as a strong trend-turn pattern.
Main features: Advanced divergence settings
Price based on Close, Open or High/Low prices Give Buy/Sell open signals PUSH notifications
E-mail sending Pop-up alert Customizeable Information panel Input parameters: DeM Period: The Period size of the DeMarke

The Supertrend indicator available on the MQL5 Market for MetaTrader 4 is an exceptional tool for traders seeking to identify prevailing trends in specific trading instruments. This indicator boasts two built-in indicators, Average True Range and Standard Deviation, allowing traders to choose the most suitable indicator based on their preferred trading strategy. Additionally, users can customize the period of these indicators and select the price (Close, High, Low, Open, Weighted) to which it s

This indicator Super Turbo indicator.Indicator displays trend movement. Indicator calculates automatically line. Features
FiltPer - displays indicator period. Step - displays indicator Step. Trend - displays indicator trend (true/false). X - move the trend left and right.
Y - move the trend up and down.
How to understand the status:
If the Trend color is green, trend is up.
If the Trend color is red, trend is down.
////////////////////////////////////////////////////////////////////

Indicator user manual: https://www.mql5.com/en/blogs/post/741402
A moving average is a widely used technical indicator and it often acts as dynamic support or resistance. MA bounce is useful tool based on this technical indicator. It can be used as proximity sensor , so you will get alert when price is near selected moving average. It can be used as bounce indicator as well, and you will get non-repainting BUY/SELL arrows, when there is high probability of a price bounce fro

Hi. The main obstacle for multi timeframe traders or traders who use multiple indicators on multiple charts is when they want to do analysis on multiple pairs quickly. You can imagine if there are 3 or 10 charts that must be opened when you want to do analysis. and each chart has its own template. of course it will take a long time to replace one by one before analysis. how many opportunities are lost due to the time spent changing charts. or maybe when a mentor wants to explain to his students

This indicator watch the Fibonacci retracement for levels and timeframes selected by the trader. In the workload of day trading, having your eyes on all the timeframes to validate some information, for Fibonacci traders, is really time consuming and requires constant focus. With this in mind, this tool allows you to have your attention on other trading details while this one monitors the retracements of each timeframe in real time. In the charts, this indicator data (retracement %, age of the r

Positon index is the cyclical index of market trend movement, and Positon's value ranges from 0 to 100. When Positon value is below 10, it means that the market is in extreme decline, the market atmosphere is extremely pessimistic, and the market is about to hit bottom and turn around. When Positon value is above 80, it means that the market is in extreme excitement, the market atmosphere is extremely bullish, the market is about to peak and there is a sharp decline.
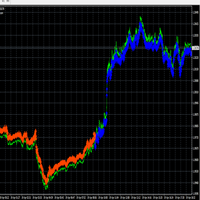
耐心是无压力剥头皮的关键。 当您看到它通过 200 移动平均线时交易箭头,并通过扩大或从没有移动平均过滤器的最后一个摆动点形成趋势。 适用于 1 分钟时间框架,捕捉日内动量走势。 使用追踪止损轻松获得 20 个点或为更大的趋势停留更长时间。 查看该指标中真正大笔交易的照片中的示例。 1 分钟的时间框架效果最好。 缩小以查看趋势。 箭头不会重新绘制或重新计算。 附加到 1 分钟的时间框架并研究交易,看看它是否可用于您的策略。
一世
规则:
买蓝色 红色出售 远离横盘整理 交易量大,交易动量 使用止损
耐心是无压力剥头皮的关键。 当您看到它通过 200 移动平均线时交易箭头,并通过扩大或从没有移动平均过滤器的最后一个摆动点形成趋势。 适用于 1 分钟时间框架,捕捉日内动量走势。 使用追踪止损轻松获得 20 个点或为更大的趋势停留更长时间。 查看该指标中真正大笔交易的照片中的示例。 1 分钟的时间框架效果最好。 缩小以查看趋势。 箭头不会重新绘制或重新计算。 附加到 1 分钟的时间框架并研究交易,看看它是否可用于您的策略。
一世
规则:
买蓝色 红色出售 远离横

This is a combination of 3 customized indicators, to make chart clean, we only showing up or down arrows. This gives good result in 1 hour and above time frames. In one hour chart, please set sl around 50 pips. Once price moves into your direction, it would be good to trail your sl by 30 to 50 pips to get more profit as this indicator kinda trend follower. In four hour chart, set ls around 100 pips. Works in all major pairs and winning ration is around 70 % based on back test in mt4.

How to use this indicator is simple.
Please look on pictures. Please use Pending Limit order only.
Set Pending order according line, with Take Profit and Stop Loss base on line. example1: Put pending order Sell Limit 1 on the line of Sell Limit 1 and Take Profit on Take Profit 1 line, Stop Loss on Stop Loss line...skip... example2: Put pending order Sell Limit 5 on the line of Sell Limit 5 and Take Profit on Take Profit 3,4,5 line, Stop Loss on Stop Loss line.
and do to opposite buy limit

This is indicator for checking your trades. Please see the pictures attachment, the indicator show info about: - Breakeven Level; - Margin Call Level; - Two volume info, past and current (With color exchange base on the past volume); - Spreads; - Swap Long and Swap Short (With color change, positive and negative swap); - Running Price; -Today High Low Pips; - Today Open to Current Running Price pips.
This indicator not for trading entry, only to assist your trade management
Regards

The Alpha Trend Experience the cutting-edge in trend analysis. The Alpha Trend doesn't just identify trends—it filters out the noise, focusing only on the primary movements of price. Whether you're a Binary Option pro or a scalping enthusiast in the Forex world, this tool is tailored for you. Here's the secret: The initial thrust of a major trend often sets its enduring direction, irrespective of the minor fluctuations within. With Alpha Trend, you can decode this momentum, pinpointing the most
FiboZZ Trade Panel is trade assistants designed for manual trading and include account information panel with automatic drawing of ZigZag Extreme Arrows , Daily Fibonacci Extension with 3 levels for targets. You can use it with the following tow strategies or to use the indicators to create your own strategies. The information panel shows you: -Today and Yesterday Profits, -Balance, -Last Profit, -Last Open Lot Size, -All Open Buy/Sell Position and total lots , -Free Margin Level, -Equity, -24 h

Zip Trend This is a hybrid trend indicator as it is based on average true range signals that determine the range of low and high price fluctuations, as well as closing prices. As a result, it indicates the current market volatility. The indicator of the oscillator family is also used. The indicator helps to calculate the oversold and overbought levels of a trading instrument.
This indicator allows you to find the most likely trend reversal points. When the trend changes, the Zip Trend indicat

The Trends Definitive indicator does not redraw and does not lag, it shows points for entering the market, points of potential market reversal. Uses one parameter for settings.
Currency pairs never rise or fall in a straight line. Their ups and downs are interspersed with pullbacks and reversals. Every rise and every fall is reflected in your emotional state: hope is replaced by fear, and when it passes, hope appears again. The market uses your fear to prevent you from taking advantage of a s

The Trrend indicator tracks the market trend while ignoring the sharp market fluctuations and noise around the average price. It catches the trend and shows favorable moments of entering the market with arrows. The indicator can be used both for pipsing on small periods and for long-term trading. The indicator implements a kind of technical analysis based on the idea that the market is cyclical in nature. Simple, visual and efficient trend detection. The indicator does not redraw and does not l

Time Range Pivot Points is an indicator that will plot Pivot Point + Support and Resistance levels on the chart, but it will calculate the formula based on a specific time range, that can be defined in the settings. If you want to successfully trade the European and US sessions it will be smart to check all levels generated by the Asian session time range. This indicator will allow you to do that. Everything is designed to get you an advantage of the potential support and resistance levels for t

This is a very complex indicator that calculates resistance and supportlevels. When the calculation is done, it merges levels that are close to eachother. It support different timeframes, simply by changing timeframe.
Features: See support and resistance levels Alarm can be set off when price enters a support/resistance zone Different timeframes
See screenshots for visual.

This system never paints. This system created by using Envolpes bands and parabloic Sars. This indicator is only working in M5 period and EURUSD Symbol. This system is for long term and profitable. Signals are shown as arrows. as an optional limit orders. You can set a voice alarm or email notification. You can fins our other products from link : https://www.mql5.com/en/users/drbastem/seller Also, you can ask all your questins from email : haskayafx@gmail.com or mobile : +90 530 8

Description Complete breaker market maker Key zones indicator, It provides precise zones where could be an excellent break or reversal opportunity. KEY LINKS: How to Install - Frequent Questions - All Products How is this indicator useful? It will allow you to trade retracement or breakout patterns, every time they occur in a given zone. NEVER repaints. It signals clear possible money management levels as stop and take profit. You’ll be able to identify potential resistance or support lev

The Storm Prices indicator is trendy, arrow family. It is easy to work and understand when the first red arrow appears, you need to buy, when the first blue arrow appears, sell. The indicator is used for scalping and pipsing. The indicator makes calculations based on several technical indicators. Determines the direction of the trend and gives a fairly clear indication of the position. The indicator allows you to determine the opportunities for entering the market for a short time. There is a sw

Trend VZ informs about the emergence of a new trend, and also serves to identify reversal points of price change. The main problem a trader faces is determining the point of entry into the market. Trend VZ is a trend indicator for the MetaTrader 4 trading platform. This indicator allows you to find the most likely trend reversal points. You won't find such an indicator anywhere else. A simple but effective system for determining the Forex trend. From the screenshots you can see for yourself the

The Sim Sim Trend indicator helps to analyze the market on a selected time frame. They define the mainstream.
It is extremely important for any trader to correctly determine the direction and strength of the trend movement. Unfortunately, there is no single correct solution to this problem. Many traders trade at different time frames. For this reason, the received signals are perceived subjectively.
Trend indicators provide an opportunity to classify the direction of price movement by deter

Trend Sys, an indicator designed to detect trends in price movement and allows you to quickly determine the direction of the trend. The best way to trade Trend Sys is to enter the market when Trend Sys peaks and goes the other way. This is a sign of a trend reversal. I hope you enjoy this indicator and leave your comments to make it even better. Good luck and happy trading.

Using the Trend Moment indicator, you can find not only overbought and oversold zones, but also be able to identify the strongest reversals of the current trend. This will take your trading to a whole new level. Forget about slipping in oscillators, be it Stochastic or RSI or any other oscillator. Trend Moment signals 100% do not redraw and do not require adjusting the parameters - the indicator will work equally well on any chart, even with default parameters.
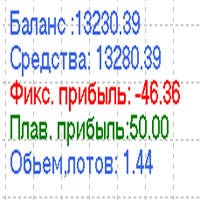
Индикатор помощник при торговле на валютных рынках.Работает на любых таймфреймах и любых валютных парах.Стоит его установить на любое открытое окно,чтобы получить текущую информацию по счету.Для более детальной информации нужно зайти в историю терминала и выбрать конкретный период торговли.Это может быть один день,последние три дня,неделя,месяц или вся торговля по данному счету.Индикатор учитывает все протаргованные сделки доступные в истории за выбранный период времени и по все торгуемым инстру
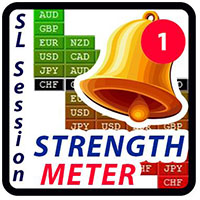
SL Curruncy impulse https://www.mql5.com/en/market/product/82593 SL Session Strength 28 Pair flow of this intraday Asian London New York Sessions strength.SL Session Strength 28 indicator best for intraday scalper. market powerful move time you can catch best symbol. because you'll know which currencies are best to trade at that moment. Buy strong currencies and sell weak currencies (Diverging currencies). Suggested timeframes to trading : M5 - M15 - M30 - You can however just change session

The 4 headed dragon is an indicator that has two functions. 1) Set the background trend. 2) Mark the predominant trend. By combining these two indicator signals, we will be able to trade for or against the trend, adapting the signals to your reading of the market.
You can download the demo and test it yourself.
1) Set the background trend.
Define four possibilities of trend that are the four heads of the dragon, marked by colors on the indicator, marking a) Powerful buying trend. b)

Trend Sens is a universal indicator, the values of which are calculated based on different indicators. The iPump indicator is a versatile indicator that combines the advantages of three categories of indicators. You get 3 indicators in 1 product. Trend Sense itself appeared in the process of many years of work with financial assets. The indicator has become a consequence of those desires and requirements, for the analysis that I personally would like to use for trading.

With the development of information technologies and a large number of participants, financial markets are less and less amenable to analysis by outdated indicators. Conventional technical analysis tools, such as the Moving Average or Stochastic, in their pure form are not able to determine the direction of the trend or its reversal. Can one indicator indicate the correct direction of the future price, without changing its parameters, in the history of 14 years? At the same time, not to lose ad
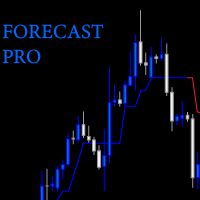
Questo tipo di indicatore fa previsioni leggendo il volume delle candele. Il valore ATR, compreso nell'indicatore FORECAST PRO,è confrontato con i livelli di supporto e resistenza con le medie dei prezzi di apertura e chiusura delle candele. Creando così segnali di ingresso sul mercato tramite frecce colorate. Le frecce saranno confermate una volta che si è verificato il breakout.
L' INDICATORE DI TREND PRO mostra la direzione del mercato e rende facile sapere quando si è verificato il breakout. È facile da impostare e molto utile con una conoscenza di base dell'azione dei prezzi. Puoi utilizzare PRO TREND INDICATOR per scambiare tutti gli asset che rompono il supporto o la resistenza. Trova il set up che si addice di più alla tua strategia di trading per individuare i punti di breakout.
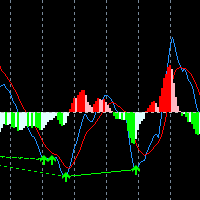
MACD称为异同移动平均线,是从双指数移动平均线发展而来的,由快的指数移动平均线(EMA12)减去慢的指数移动平均线(EMA26)得到快线DIF,再用2×(快线DIF-DIF的9日加权移动均线DEA)得到MACD柱。MACD的意义和双移动平均线基本相同,即由快、慢均线的离散、聚合表征当前的多空状态和股价可能的发展变化趋势,但阅读起来更方便。MACD的变化代表着市场趋势的变化,不同K线级别的MACD代表当前级别周期中的买卖趋势。
1.本指标增加MACD的双线显示, 2.并且对能量柱进行4色不同的渐变 ! 3.增加MACD背离信号显示及提示
合作QQ:556024" 合作wechat:556024" 合作email:556024@qq.com"

指标加载后会显示显示接近真实的余额净值变化图,并含有入金出金提示等.
1.指标是余额净值趋势显示 2.净值估算才用了订单逆向计算,对每个货币对订单在K线图上的走势进行了回溯估算得出较准确的净值 3.若是想要全部历史进行计算,请在历史中选择全部,如果不用全部也可,有自行选择的权利. 4.会有平台的tickvalue数值不对,造成某段区域的计算不准确,现大部分会自动处理异常 5.把握真实的净值曲线,可以对很多马丁类,网格类的EA有一定的风险甄别,防止这类EA人为的做曲线,只显示出它们余额走势较好的走向. 6.出入金都会在响应的位置显示 7.切换周期,随着时间轴变化 希望大家交易愉快,净值,余额涨涨涨.牛气冲天哦!
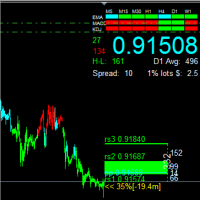
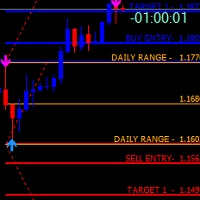
1.该指标提供了日内趋势的判断,周期切换到4H以下有效" 2.该指标提供了日内支撑阻力精确的计算,顺势趋势条件下方框为进场基准价格" 3.该指标提供了现价到日内支撑阻力的间隔计算便于清晰分析局势" 4.该指标提供了从5分钟到W的三个指标对每个时段的判断分析" 5.该指标提供了日价格数据显示" 6.该指标提供了某些重要开单信息显示" 7.该指标提供了K线运行时间进程,以及倒计剩余时间"
申明1:该指标支撑主力框应用于趋势交易,非趋势的震荡分为请自行睁眼判断哦" 申明2:方框颜色和高度代表方向以及趋势大小"
作者:qq556024 email:556024@qq.com "
适宜人群:波段交易 日内交易.支撑阻力寻找,大局观判断!

Emerged is a convenient indicator for technical analysis and is suitable for trading binary options. The indicator uses color signaling: blue - when changing from descending to ascending, and red - on the contrary, to descending. You can use the indicator when entering the market. All entry points are optimal points at which movement changes. Entry points should be used as potential market reversal points. The default indicator settings are quite effective most of the time.
Emerged hybrid tre
The intelligent algorithm of the Reversibles indicator determines the direction and strength of a trend, and also signals a trend change. Reversibles is a technical analysis indicator. Uses just one parameter for settings.
The indicator is built for simple and effective visual trend detection with an additional smoothing filter. The indicator does not redraw and does not lag. Shows potential market reversal points. The indicator can work on any timeframe.
You can set up message alerts as so

Interesting Trend - can be easily used as an independent trading system. The indicator tracks the market trend, ignoring sharp market fluctuations and noise around the average price. Implements an indication of trend movement with moments for potential stops in the indicator.
Simple, visual and efficient use. The indicator does not redraw and does not lag. Works on all currency pairs and on all timeframes. You can interpret it like this: The location of the rate above or below the shadows ind

The NASDAQ 100 Power Indicator serves with TREND and trend reversals indication using automated arrows that indicates buy or sell at that price and has built-in signal provider across all time frames with alerts and provides also the automated support and resistance that can draw technical analysis patterns like double bottom, double top, head and shoulders etc. using closing and open prices, in assistance for if a trader did not see the pattern sooner for their technical analysis. The indicator

The Progres indicator uses calculations designed to smooth out sharp fluctuations that do not affect the overall picture of price movement.
This is an auxiliary tool for technical analysis, which helps to determine the direction of the trend: either upward or downward price movement on the selected trading instrument. The indicator is a trend-type indicator; it smooths out price fluctuations during signal formation by averaging data.
The trend can be ascending (bullish) and decreasing (bear
This indicator helps trader quickly change symbol for all current charts. Help manual: 1-Traders add this indicator to one of the openning chart. Traders can add this to all charts. They all work properly. if SingleChartImpact = true: only chart with indicator can change symbol. If false, all opened charts will be changed 2-From the chart that has this indicator added, traders press one key on the keyboard to show all symbols which are available on market watch window in button form. For example

This indicator Pluuto Alert indicator.Indicator displays trend movement. Indicator calculates automatically line.Alert = arrow.When the alert is up the next alert is down,when the alert is down the next alert is up (new bar). Features
FiltPer - displays indicator period.Line1. FiltPer2 - displays indicator period.Line2. Multiplier - displays indicator multiplier.(FlitPer,Line1;step) Deviation1 - displays indicator deviation.(Line2) Deviation2 - displays indicator deviation.(Arrow) Trend - displ
Bintang Binary Indicator work all pairs Time Frame : M5 Expaired : 1 Candle No Repaint, No Delay and Alerts Use manual and auto trading Easy to use Trial Version, Rent Version and Full Version avaliable Trial Version >>> download here https://www.mql5.com/en/market/product/54602 Trial Version not have Alerts Rent version 1 month, 3 month, 6 month, 9 month, and 1 years
Auto trading is better use MT2 Trading Platform (Contact me for discount 10 % MT2 trading licence) Work good for forex trading
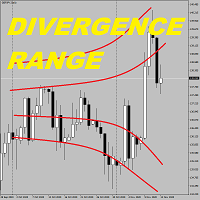
Divergence Range 发散范围 差异范围是一种非常简单有效的指标,可根据标准移动平均指标计算价格差异范围。 该指标有两组线,三条线,分别位于标准移动平均线上方的 upper1 , upper2 , upper3 和下方的三行( low1 , lower2 , lower3 ),它们显示了价格移动与标准移动平均线之间的差异范围。从标准移动平均线来看,最多的两个线实际上涵盖了 95 %以上的价格移动。 参量 期间 = 48 (默认) Shift = 0 (默认) 方法 = 指数(默认) 显示统计信息 = 真(默认) 统计单位 = 2500 (默认) 周期 / 班次 / 方法:这是移动平均线的标准周期参数,您可以选择任何类型的移动平均线。一般原则是,您应该相对较长的时间,以获得更稳定,更平滑的分歧范围。 Show Statistice / Statis 单位:这是用于显示散度范围有效性的统计信息的参数。当它打开时,指示器将显示价格高点超过相应上限的百分比,而低点跌破相应上限的百分比。 主要特点 1. 通常,只有不到 20 %的单元超出上线 1 和下线 1 所涵盖的范围。

Торговая стратегия Shark Channel основанная на возврате цены к среднему значению, рекомендуется вести торговлю на валютных парах находящихся 70 процентов времени во флете: AUDCAD,AUDCHF,CADCHF,AUDNZD,CHFJPY. Остальные пары не рекомендуются к торговле!
Time Frame текущий таймфрейм или (1,5,15,30,60,240,1440) Half Length колличество анализируемых свечей Price скорость движения цены Bands Devivations коэфициент ширины канала Interpolate

实时货币强度 我们提供了一种简单有效的货币强度指标,可让您大致了解市场情况。该指标显示八种主要货币的强度,并且可以在一个指标窗口中查看。 主要特点 这是基于八个最清算主要货币池的实时货币实力。 这意味着,每时每刻,货币的强度都与当时的八种货币的总库有关。因此,该货币强度不需要计算的参考起点。您无需任何主观设置即可比较指标与历史事件的表现。 参数 前缀字符串:调整符号名称,例如 UDA-EURUSD 的“ UDA- ” 后缀字符串:调整符号名称,例如 EURUSD.ah 的“ .ah ” CalculationPeriod :此期间用于计算八种主要货币的池,建议期间为 24,96 和 384 ,这将计算短期,中期和长期的货币强度变动。最重要的是中期,例如 96 ,应用于每日图表。 ShowOnlysymbolOnChart :仅显示与图表符号相关的货币。 USD / EUR / GPB / CHF / JPY / AUD / CAD / NZD :启用每种货币 EnableSmoothLine :通过移动平均线平滑线。 SmoothNN :用于平滑线移动平均值的单位 理论与实施

The Trend Rever indicator uses two lines of different colors to display buy or sell signals. The first of these lines is red and the second is blue. When changing the color of the lines, an arrow is also displayed, which indicates which deal to open, buy or sell. A simple but effective system for determining the Forex trend. The algorithm takes into account the measurement of prices, and this method also focuses on the measurement of each of the price drops - which gives more detailed informati
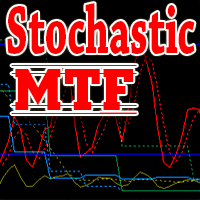
The indicator displays the Stochastic oscillator indicator readings of four time frames simultaneously in the lower window of the chart.
An example of a possible use: the direction of all indicator lines in one direction is a sign of a strong trend. The use of the lag factor - in the case of the indicator lines staying in one area for a long time - is a sign of trend "fatigue", its stop or reversal. The indicator is redrawn only within the candlestick of its own timeframe.
The indicator has

The indicator is designed to determine the momentum of the price.
The Stochastic is recommended to be used during the lateral movement phase together with other indicators. However, some Stochastic signals have worked well in the trending market.
Overbought and oversold zones
Oscillator zones above 80% and below 20% are called overbought and oversold zones, respectively. When the price enters the overbought zone (that is, trades near the upper border of the range), if it bounces down, the

Least Square MA Description: The Least Square Moving Average indicator allows you to assess the direction of the market movement and its possible reversals. The indicator is a line that is displayed in the price window. Input parameters: LSMA_Period - the period for calculating the moving average using the least squares method; Prediction - the number of candles used to construct the predicted moving average using the least squares method, provided that its rate (falling or growing remains); D

Indicator of strong levels. Usually, price either bounces off them or breaks out powerfully with a strong move. Also, often in areas of such levels, the price turns into sideways movement, gaining strength before a new impulse.
Settings: Timeframe - Select a timeframe; TopColor - Color of support zones; BotColor - Color of resistance zones; Price_mark - Color of price labels; Price_Width - The size of price labels.

The Trend Map indicator is designed to detect trends in price movement and allows you to quickly determine not only the direction of the trend, but also to understand the levels of interaction between buyers and sellers. It has no settings and therefore can be perceived as it signals. It contains only three lines, each of which is designed to unambiguously perceive the present moment. Line # 2 characterizes the global direction of the price movement. If we see that the other two lines are above

Trend LineA is a powerful trend indicator equipped with everything you need to trade and at the same time very easy to use. The indicator calculates the most probable zones of trend stop / reversal, zones of confident trend movements. The indicator works on all timeframes and currency pairs. The indicator gives quite accurate signals and it is customary to use it both in trend and flat markets. It is advisable to use the indicator in combination with other instruments for more reliable signals

Trend Target analyzes the main parameters of Forex, helps to obtain information about the current position of all market transactions for a particular asset. Trend Target makes it possible to classify the direction of price movement by determining its strength. Solving this problem helps to enter the market on time. You can not only see the direction of the trend, but also the levels that you can work with.
The indicator also allows plotting levels. Quickly identifies support and resistance l
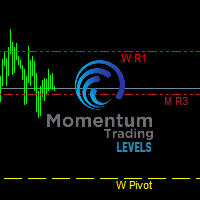
Momentum Trading Levels MT4 Indicator: - Dynamic Monthly-Weekly-Daily Support And Resistance Pivot System - Helps Locate Institutional Liquidity Levels And Forecast Price - Allows Trader To See Monthly Weekly Daily Levels On All Time Frames - Helps Locate Monthly Weekly Daily Extremes And Confluence - "Sunday Data" Feature Allows Accurate Monthly Weekly Daily Data With Minimum Discrepancies - Helps Pinpoint Optimal Entries And Exits - Ideal For Navigating Mid-Week Reversal Patterns - Premium A

隆重推出 Parabolic Predictor Dashboard ,这是一种基于流行的 Parabolic Indicator 的高级多品种、多时间框架和非重绘仪表板指标。它过滤传统的抛物线信号以识别准确的趋势并预测市场进入和退出水平。
该指标不仅仅是仪表板。只需单击该符号,您就可以在新的图表窗口中查看趋势方向、准确的入场水平和获利水平。借助我们的快速警报系统,您绝不会错过任何信号或再次获利。每次点击都会收到移动通知、电子邮件和弹出警报。
Parabolic Predictor Dashboard 指标提供了一系列旨在增强您的交易体验的功能。它提供多货币、多时间框架和非重绘仪表板,提供易用性和灵活性。您可以毫不费力地监控各种货币对和时间框架,方便随时了解市场趋势。
使用此指标,您可以通过在新图表窗口上查看入场和获利水平获得清晰的视觉确认。此功能可帮助您做出明智的交易决策并确保交易执行的准确性。
通过我们全面的警报系统保持领先地位。每当产生信号或需要获利时,接收移动警报、电子邮件警报和桌面警报。即使您不在交易平台上,您也绝不会错过任何机会。
抛物线
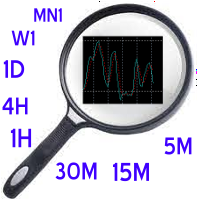
This is an indicator that shows the value of Stochastic of different timeframe on a single chart window. It also shows the average stochastic value of all the values of Stochastic (MN1, W1, 1D, 4H, 1H, 30M, 15M and 5M) shown. It can be used to know the oversold and overbought of any instrument.
who can use it? All types of traders. Be it- Scalper Swing traders News traders Long term traders Input Parameters %K period - Value of %K period of stochastic used;
%D period - Value of %D period of s

hi traders I am a Forex and binary expert trader from 2012 . I have many robust & highly profitable trading strategies. I've created these trading system with a long time effort and experience of vast knowledge. All my trading indicator will give 95 to 99% accurate performance. If you follow the signal it will give almost 100% success. They are extremely powerful, accurate & easy to trade. New Trader friendly no past experience needed. clear and friendly interface Alert notification 100% non re
MetaTrader市场是独有的自动交易和技术指标商店。
阅读MQL5.community用户备忘更多地了解我们提供给交易者的独特的服务:复制交易信号,自由职业者开发的自定义应用程序,通过支付系统完成的自动付款和MQL5云网络。
您错过了交易机会:
- 免费交易应用程序
- 8,000+信号可供复制
- 探索金融市场的经济新闻
注册
登录