适用于MetaTrader 4的付费技术指标 - 64
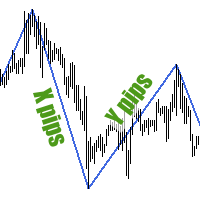
Зигзаг строится по ценовым волнам, размер которых не меньше заданного в настройках. Индикатор не способен нарисовать две вершины (максимум и минимум) на одной свече, поэтому для определения волн небольших размеров следует использовать меньшие таймфреймы графика. Зигзаг в виде гистограммы можете скачать здесь .
Для сбора статистики по размерам ценовых волн используйте идикатор Wave Size Stats .
ПАРАМЕТРЫ MinWaveSize: минимальный размер волны, на котором будет построено очередное плечо зиг
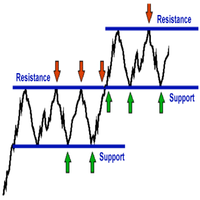
Are you tired of drawing Support & Resistance levels for all charts of the same Symbol while doing Multi-Timeframe analysis? Well, if you are a Price Action trader then this indicator will solve your problem. Draw on 1 Timeframe and it will auto-sync with other charts of the same Symbol. You can draw rectangles, lines, and eclipse. It will give an alert when touched/break on line. It work's on all Timeframes.
Major Update Added:: 1}triangle 2}Fibonacci Retracement 3}Text Lable 4}Up/Down Arrow

This is a trend indicator without redrawing Developed instead of the binary options strategy (by the color of the Martingale candlestick) Also works well in forex trading When to open trades (binary options) A signal will appear in the place with a candle signaling the current candle It is recommended to open a deal for one candle of the current timeframe M1 and M5 When a blue dot appears, open a deal up When a red dot appears, open a trade down. How to open trades on Forex. When a signal is rec
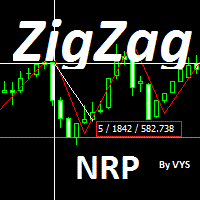
Zigzag indicator with removed redrawing open a deal Stands when the price crossed the zigzag line If the price crosses the line from the bottom up, then this is a buy signal If the price crosses the line from top to bottom then this is a sell signal Stoploss is set at the bend of the Exit the deal by the opposite signal or take profit
Zigzag nrp indicator is easy to set up In it you can choose a suitable period for yourself Recommended period 3. This is an individual development This tool

Cloud Stair is an Indicator has 2 Cloud (Up Trend and Down Trend). Cloud will turn Red when trend go down. Cloud will turn Blue when trend go up. You can use this indicator as a Support and Resistance level. Trend very strong when there are no opposite side. Open Buy position when the indicator show blue cloud and no red cloud. Open Sell position when the indicator show red cloud and no blue cloud.
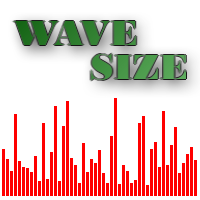
Гистограмма отображает длину ценовых волн, которые не меньше заданного размера. Индикатор наглядно показывает направление коротких/длинных ценовых движений и динамику волатильности. Также Wave Size Histogram подойдет для поиска закономерностей в ценовых движениях. Например, после крупной волны (большое значение гистограммы) зачастую идет слабое движение цены в противоположную сторону (небольшое значение гистограммы), которое идеально пододит для торговли по Мартингейлу.
Для сбора статистики п

Smoothing Oscillator , is a powerful indicator that vibrates along with the market, resulting in a very useful tool to improve and decide your trading. This indicator is a smoothed version of the Super Oscillator MT4 that you can download at this link https://www.mql5.com/es/market/product/59070 The idea of this indicator is to smooth and limit the aggressiveness of the previous indicator, it has less power in terms of pullback points but has more power to detect trends and consolidation

Resistance Support Day 支撑和阻力水平指标。
水平是按一天计算的。
该指标仅适用于少于一天的图表周期,不适用于其他图表周期。 指标设置说明: Display_Mode - 选择显示整个历史或某一天的指标读数的方法 ...其他设置选择图形对象的颜色 建议:指标应用于 GBPUSD 货币对 支撑和阻力水平指标。
水平是按一天计算的。
该指标仅适用于少于一天的图表周期,不适用于其他图表周期。 指标设置说明: Display_Mode - 选择显示整个历史或某一天的指标读数的方法 ...其他设置选择图形对象的颜色 建议:指标应用于 GBPUSD 货币对
支撑和阻力水平指标。
水平是按一天计算的。
该指标仅适用于少于一天的图表周期,不适用于其他图表周期。 指标设置说明: Display_Mode - 选择显示整个历史或某一天的指标读数的方法 ...其他设置选择图形对象的颜色 建议:指标应用于 GBPUSD 货币对
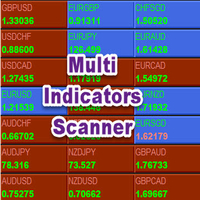
Multi Indicators Scanner Indicator Scan ADX ,Moving Average ,ENVELOPE ,SAR , MACD ,RSI and ATR . We can change all input parameters in chart window. scanner works Multiple Time Frame we can change Timeframe . Symbol button based on Trend color , we can click button and open chart . We can also save templates in input. Default settings Time Frame 1Hour Templates Name Default Auto Arrange Chart true
The original an indicator for technical analysis of the market, currencies, currency pairs, precious metals and oil, and you can also analyze various cryptocurrencies such as Bitcoin and Ethereum. The indicator analyzes quotes and, based on their data, displays its icons on the chart for trading analysis. The indicator works very well, does not freeze and does not slow down even a weak processor in the computer, and is also not very demanding on the rest of the hardware resources on the compute

The Winner of Balance indicator is based on the author's method of detecting market sentiment. designed to understand what the mood is in the market, who wins-bears or bulls.
Input parameters:
1. Settings for setting levels:
1.1. ATR Period - the period of the standard ATR indicator
1.2. K Lower Order, ATR-coefficient for setting the lower threshold in ATR (hotpink color) 1.3. KUpper Border, ATR - coefficient for setting the upper threshold in ATR (the Aqua color) 2. Settings for calcul

The indicator builds a graphical analysis based on the Fibonacci theory.
Fibo Fan is used for the analysis of the impulses and corrections of the movement.
Reversal lines (2 lines at the base of the Fibonacci fan) are used to analyze the direction of movements.
The indicator displays the of 4 the target line in each direction.
The indicator takes into account market volatility.
If the price is above the reversal lines, it makes sense to consider buying, if lower, then selling.
You can op

Candle close countdown indicator. Almost all indicators work by ticks and therefore stop counting when the price stops in moments of little volatility. This indicator does not stop and remains synchronized with the broker's clock. It also has other functions that can help the trader. All features are configurable and you can choose if you want to use it or not: - Volume control: the counter changes color when the current candle has a higher volume of contracts than the pr

The indicator determines the state of the market: trend or flat.
The state of the market is determined by taking into account volatility.
The flat (trading corridor)is displayed in yellow.
The green color shows the upward trend.
The red color shows the downward trend.
The height of the label corresponds to the volatility in the market.
The indicator does not redraw .
Settings History_Size - the amount of history for calculation.
Period_Candles - the number of candles to calculate the

The indicator plots flexible support and resistance levels (dots). A special phase of movement is used for construction. Levels are formed dynamically, that is, each new candle can continue the level or complete it.
The level can provide resistance or support to the price even where it is no longer there. Also, support and resistance levels can change roles. The importance of levels is affected by: the amount of time the level is formed and the number of touches.
The significance of these l

The indicator is a trading system for short-term trading.
Scalper Assistant helps to determine the direction of the transaction, and also shows the entry and exit points.
The indicator draws two lines (possible points for opening positions).
At the moment of the breakdown of the upper line up (and when all trading conditions are met), an up arrow appears (a buy signal), as well as 2 goals.
At the moment of the breakdown of the lower line down (and when all trading conditions are met), a do
This is Supply Demand Indicator based on Fractal , RSI and Stochastic Oscillator . It have Six Cover Option, you can do adjust your needed by set to true or set to false: ------------------------ Option 1: UseTrendFractal = true; UseRSI = false; UseStochastic = true; ------------------------ Option 2: UseTrendFractal = true; UseRSI = true; UseStochastic = false; ------------------------ Option 3: UseTrendFractal = false; UseRSI = false; UseStochastic = true; ------------------------ Option 4: Us

Fibonacci calculator is used with Elliot Waves, it can generate remarkable results. A trader could use these levels or ratios to find high probability trades with very small stop loss. You may also use these ratios to find Elliott Waves extensions and to book profit near those levels. For Elliot Wave experts, Fibonacci calculator is a highly useful tool that can assist them in calculating Fibonacci extension and retracement levels for the market price. The indicator proves itself as a useful one
This indicator show POWER of major currencies AUD, CAD, CHF, EUR, GBP, JPY, NZD, USD, XAU Calculation base Average and Ticking Volume.
Recommendation use on HIGH TIMEFRAME.
If want use as your desired, you can choose freely which timeframe you like. Default set in H1, H4, D1 and W1
Test indicator demo first got your rhythms and rhyme of POWER .
See Pictures attachment for more information. Note: Don't forget to turn on 28 Symbol + XAUUSD before put this indicator in to your chart.

This MACD Magic indicator coded due to inspired in a another similar indicator ,Here Macd Magic calculate Double trend confirmation. With ATR Ratio Based TP point , ATR value input are available in input settings . MACD Magic indicator provides Accurate signals on all Major currency pair and stocks. This indicator Very easy to analysis trend and set target point

¿Has escuchado decir que la tendencia es tu amiga? pues nada es mas cierto en el mundo del trading. Este indicador analiza las tendencias y su fuerza para que puedas aprovecharlas y utilizamos un conjunto de indicadores como RSI, %W, MACD y EMAS para analizar el mercado y sus movimientos, por lo que podrás mantener tu gráfico limpio sabiendo que todos estos indicadores los tienes en uno solo. Este, como cualquier indicador, no representa una certeza de compra o venta definitiva, por lo siempre r
LordMACDSignal is an indicator for META TRADER that uses the MACD trend of the financial market by default and principle.
LordMACDSignal has been optimized with MACD indicator to analyze the trend through candles and detect the next movement.
LordMACDSignal sends signal alerts about a trend of upward or downward divergence, and also reports possible reverse situations in overloaded pairs. Made with love and care, Join Telegram Group: https://t.me/expertlord

Индикатор присваивает каждой свече уникальный код, который зависит от ее параметров - направления, размеров верхней и нижней тени и размера тела. Алгоритм расчета кода свечи следующий: строится семизначный двоичный код, первое место в котором обозначает направление свечи, 2-е и 3-е места - размер тела, 3-е и 4-е - размер верхней тени, 5-е и 6-е - размер нижней тени (см. скриншот 7). На эти позиции ставится 0 или 1 в зависимости от параметров свечи:
Направление свечи (цвет тела)
1 – бычья св
---> Check all the other products <---
The Candle Bias is a coloring indicator that doesn't take account of the close price of the bars.
It will color the candle in the bearish color (of your choice) if the downard range is greater than the upward range. Conversely, it will color the candle in the bullish color of your choice if the upward range is greater than the downward range.
This is a major helper for Multi Time Frame analysis, it works on every security and every Time Frame. You

You ask yourself the question every time you open your charts: how to win in trading? Will using a lot of indicators work? well know that I also asked myself the same questions when I first started trading. After testing many indicators, I realized that winning trading is simple and accurate trading. after several months of thinking and optimizing I was able to find my solution: Candle Good Setup Candle Good setup is a trend and entry timing indicator analyzing the market in multi-frame to g
REVERSAL AREA INDICATOR
This Indicator will generate signals on top and bottom of the swings .
It will check for some support and resistance found and generate the signals at such areas. There is high probability of the price moving in favorable directions as they are signals when there is support and resistance . The advantage is that the entries will have small stop loss and high risk to reward ratios as they are near tops and bottoms. 1. This is an indicator that will provid
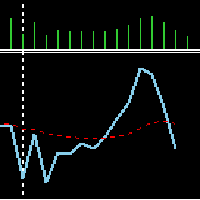
Volume MA This indicator shows selected period of volume and it's moving averages. Easy to use has nothing complicated. It has two parameters input. Volume period: Default is 9 Signal MA: Default is 21 If the blue line is rising, there is an increase in the volume within the selected period. If it is the opposite, it is falling. The dashed Red line shows the moving average of the volume values within the selected period.
Top and Bottom Scalper
BINARY AND FOREX
The signals indicate strong reversal points (Tops/bottoms)- The indicator gives accurate signals on any currency pairs and instruments. It also has a setting for adjusting the frequency of the signals. It is further strengthened and made robust by the support and resistance zones. There are different qualities of zones as per robustness.
Inputs ZONE SETTINGS; BackLimit - default is 10 000. Check the past bars for formations. First Time Fram
Dual Trend Scalper
Advantages You Get
Easy, visual and effective trend detection. you can find the IMPULSE COLOR PANEL FOR QUICK TREND DETECTION Gives you the ability to filter and further improve your trading strategies. YOU HAVE TREND DETECTION IMPULSE FILTER , AS WELL AS 2 LEVELS OF SUPERTREND. Enhanced statistics calculation following the entry point, take profit and exit signal. ENTRY CAN BE AS PER VARIATION OF SETTINGS AND PARAMETERS, SL AND TARGETS ALSO CAN BE ADJUSTED Neve
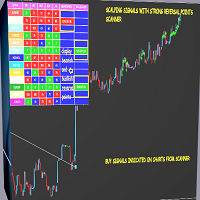
REVERSAL SIGNALS SCALPER SCANNER
Indicator is a multi purpose tool and very useful to know the EXTREME TURNING POINTS of any pair / stock/ commodity. The extreme levels can be input and it will show you when those levels have reached . So that you can plan your EXTREME REVERSAL TRADES . It is a MULTI TIME FRAME TREND ANALYSIS TOOL AND IT WILL suggest probable changes in the trend and swing . It is very useful for day trading , scalping, and swing trading .
SPECIAL FEATURE - CLICK ON THE RE
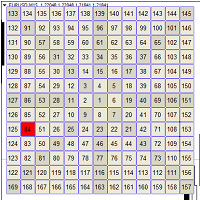
Gunn Chart 江恩广场的价格走势。 计算是相对于当前价格进行的。
在计算中,您可以使用 Digit 和 minus_znak 设置来使用定价的一部分。
例如:当前价格看起来像 - 1.23456,并且 Digit 设置为 _5____,
那么数字23456将参与计算, 对于 _6____ 将是数字 123456
对于 __4____,数字将为 3456
___3___ 的数字将是 456
该 minus_znak设置删除号码定价的权利
例如: Digit 设置为 _5____ 并且 minus_znak 设置为 _0
定价的形式为 23456
在 _1 将是 2345
在 _2 将是 234 要移动方块,您需要使用键盘按键:
向上箭头 - 向上移动方块 向下箭头 - 方块向下移动 向右箭头 - 方块向右移动 向左箭头 - 将方块向左移动 指标设置说明: _width - 以像素为单位的单元格宽度 _height - 单元格的高度(以像素为单位)
_font_size - 文字大小 clr_txt - 文本颜色 clr_back

Trend Anthropoid is a trend indicator that allows you to effectively determine the direction of the current trend, as well as identify potential reversal points. The indicator makes it possible to classify the direction of price movement by determining its strength. Solving this problem helps to enter the market on time and get the desired result.
Let's start with the benefits. Allows you to determine the current trend. You can quickly understand which trend is currently developing in the mar

Канал Achieved состоит из двух линий отображающих канал. Линии канала определяются по простому и надежному алгоритму. Канал желательно использовать для торговли внутри канала. Индикатор не перерисовывается и не запаздывает, в основе работы простые алгоритмы. Работает на всех валютных парах и на всех таймфреймах. Как всегда предупреждение, не надо забывать, что подход должен быть комплексным, сигналы индикатора требуют дополнительной информации для входа в рынок.
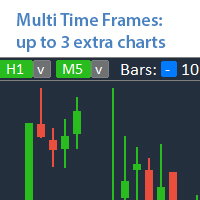
Analyze up to 3 additional charts of other timeframes , without switching the main chart. My #1 Utility : includes 65+ functions | Contact me if you have any questions The indicator opens in a separate window: The window can be moved to any place on the chart (using the [<M>] button). The window can also be minimized to save space ( [ <^>] button) In the window that appears, you can configure: The period of the 1st chart (left);
The period of the 2nd chart (center); The peri

The principle is very simple, practical and effective - they are implemented in the Compass indicator, which will help traders to protect their deposit from loss. This is one of the implementations of the indicator for protecting a position from loss. Similar implementations exist, this is not a complex algorithm. The indicator uses a series of moving averages, which, with a given Length step, form the resulting lines that are displayed on the price chart as blue and red lines. These lines are t

The Agency indicator reveals all the main market conditions (trend, retracement in a trend, flat), which allows you to enter the market at any time and use any trading methods and styles. The indicator is a directional system (ADX). The directional system was developed by J. Wilder in the mid-70s in addition to the PARABOLIC SAR system and then developed by a number of analysts. It has two main rows of points. The first row of red dots shows the direction of the sell trend. The second row of gr

Implement analyzes market dynamics for pivot points. If you want to learn how to spot the correct reversals for consistently likely profitable trading, buy this indicator. Shows favorable moments of entering the market in stripes. Ready-made trading system.
The principle of operation of the indicator is to automatically determine the current state of the market when placed on a chart, analyze historical data based on historical data and display instructions for further actions on the trader's
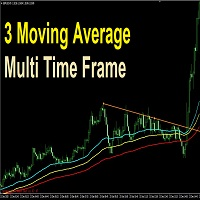
The simplest and profitable strategy is to break the trend of the small time frame in the direction of the big time frame.
3 moving average multi time frame is for those who trade on a 5-minute frame and want to enter with the direction of the hour; Or trade on the hour and want to enter with the daily trend, or the minute with the quarter hour trend.... This indicator draw three moving averages that show the direction of the big trend and help to enter with the end of the correction ,and re
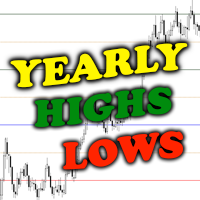
This indicator automatically plots Yearly High , Yearly Low and Yearly Average price levels from the previous year. It also builds two additional equidistant parallel levels ( Extended Highs R2 , R3 / Extended Lows S2 , R3 ) extended from previous Year High / Low. Extended High R3 / Low S3 is 100 percent Low-to-High extension ( as in Fibonacci 100 % extensions ) above / below the previous Year H/L and is the final reversal level with a sure reaction. Extended High/Low R3/S3 represent the ulti

Multiphase is a non-redrawing channel indicator based on moving averages. The key difference between the Multiphase indicator and other channel indicators (for example, from the same Bollinger Band) is that Multiphase takes into account not simple moving averages, but double-smoothed ones, which, on the one hand, makes it possible to more clearly determine the market movement, but, with on the other hand, it makes the indicator less sensitive.
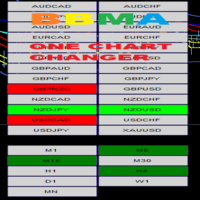
This is Mini Dashboard of BBMA with Reentry Signal and Trends. *More convenience to change any symbols in One Chart. *Multipairs and Multi Timeframe
Reentry Signal : Are based on BBMA Method . You can select any Time Frames to scan the current signals of Reentry. RED BUTTON = REENTRY SELLS GREEN BUTTON = REENTRY BUY
Trends : Multi Time Frames Are based on BBMA Method. GREEN BUTTON = TREND UP RED BUTTON = TREND DOWN.
Inputs: MultiPairs : any list of symbols. Options to attach indicator on

The Trend Logic indicator provides an opportunity to classify the direction of price movement by determining its strength. Solving this problem helps to enter the market on time and make a good profit. It is extremely important for any trader to correctly determine the direction and strength of the trend movement. Unfortunately, there is no single correct solution to this problem. Many traders trade at different time frames. For this reason, the received signals are perceived subjectively. The

The Effect indicator shows the points of potential market reversal. Simple, visual and efficient trend detection. Ready-made trading system. The intelligent algorithm of the indicator determines the trend with good probability. Uses just one parameter for settings. The indicator does not redraw and does not lag. Works on all currency pairs and all timeframes.
You should remember that using a combination of forecasting tools, it is advisable to choose 2-3 indicators for trading. Otherwise, the
This version of the MACD named MACD Platinum is the MACD indicator calculated with ZeroLag moving averages (ZLEMA) .
ZLEMA is an abbreviation of Zero Lag Exponential Moving Average . It was developed by John Ehlers and Rick Way. ZLEMA is a kind of Exponential moving average but its main idea is to eliminate the lag arising from the very nature of the moving averages and other trend following indicators.

Reversal Trend indicator, which recalculates values for a new period without changing the previous ones. According to statistics, more than 85% of traders who prefer aggressive trading suffer losses. The rush and desire to make a profit immediately leads them to frequently open orders at random, much like playing in a casino. The bottom line is disappointing: a few trades, possibly, will bring profits and then losses. To understand the dynamics of the market and use it for profit, you need to

When Metatraders trades many currency pairs, it's not easy to see the full information. This indicator is very comfortable and easy to see the current transaction. You can confirm this information and determine the type of order (SELL/BUY) for further transactions. If you use this tool, you probably won't be able to make orders without it. Also, you can easily see the sharp changes in total profits.
This Relative Strength Index version using four different Period. Calculate on Timeframe M1, M5, M15, M30, H1, H4 and D1. Each using median price for valid average calculation.
How to use this indicator, as follows; 1. This indicator design for FOLLOW THE TREND, not using for Overbought or Oversold, but if you want to use it as Reversal trades, is up to you. 2. You can see on pictures attachment, it produce three type of signal, LONG, SHORT and SIDEWAYS. 3. Recommended for trading, Open trad

Working with the Smart Analiz indicator is very simple - you just react to the arrows that the indicator reflects, that is, the arrow is a command for action. The indicator signals are accurate enough and you can trade using this information! The indicator builds a very high-quality channel in which it generates entry signals! Which is the ideal strategy for a trader as the trader is always hesitant when choosing a strategy to work with. That is, this indicator will allow you to solve the dilemm
Arrow indicator of trend reversal with 2-level signaling and multi timeframe. The indicator line consists of 4 colors, indicating the divergence level and possible trend reversals. Light arrows indicate a weak trend, dark arrows indicate a strong one. Sensitivity levels and steps are set in the settings. Signals are output to the mailbox and mobile terminal.
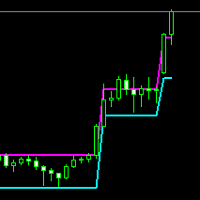
ATRenko Indicator
ATRenko is an indicator and I think it works better on the daily chart. Indicator draws 2 lines; Upper band line and lower band line.
If the price is between two bands, it means that there is no trend or the previous trend is continuing and there is a consolidation process. There are two indicator inputs that can be changed by the user.
1. ATRenko Period
It is 10 by default. It determines in how many bars the calculation will be made in the selected timeframe.
2. Katrenko
Fibonacci Level start form price Open as zero number. then do Fibonacci line offset on above and to below, base last Day High Low Fibonacci Percentage.
With ADR Label for measure maximum and minimum pips running limit. Using ADR 5 days, ADR 10 Days, ADR 20 Days and ADR 50 Days.
On current running price, there plot two line boundaries, are current High line and current Low line, with percentage running pips.
Please see attachment pictures for more information.
Regards

American traders say: “Trend is your friend”, which means “Trend is your friend”. And indeed it is! By trading with the trend, you reduce your risks and gain an advantage, as you increase the mathematical expectation of completed trades and, therefore, earn more profit. Together with the Going straight indicator you will trade with the trend with ease! This is one of the most effective ways to deal with market trends.
Trading strategies using the channel indicator belong to the classic method

This indicator takes input from the ZigZag and ADX indicators, combined with a special trend algorithm. You also get a Moving Average on the chart to determine trend direction. Great for scalping. Perfect for channels. Features alert functions. BulletPeriod. Parameter TrendLinePeriod for the MA line. Change to your preference. Try 200.
How to use: Simply attach to any chart. Sell on red bullets, with red MA line above price. Enter on bullets closest to this line. Buy on blue bullets, with blue
This indicator (translated from the Japanese source) automatically identifies authentic Japanese candlepatterns (Japanese Sakata Gohou rules) and displays with arrows the following Japanese candlestick patterns:
BEARISH AND BULLISH ENGULFING CANDLES (known as Tsutsumi in Japanese) BULLISH THREE WHITE SOLDIERS BEARISH THREE BLACK CROWS BEARISH EVENING STARS BULLISH MORNING STARS THREE LINES THREE INSIDE DOWN (marks with a box) THREE INSIDE UP (marks with a box)
You can switch off or on to hav
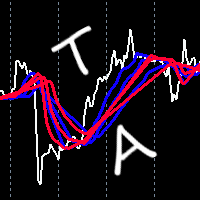
This indicator takes input from the Alligator indicator. Great for scalping. Great for identifying new trends. This indicator can be used on all time frames and pairs. Features alert functions.
Parameters: Alerts JawsPeriod JawsShift TeethPeriod TeethShift LipsPeriod LipsShift
How to use: Simply attach to any chart with default settings. Sell when all 3 red lines cross above white line. Buy when all 3 blue lines cross below white line.
Best results when checking the higher time frames (3 or
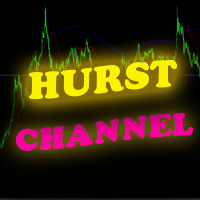
This tool is known as the Hurst Channel or Hurst Bands . At first sight, it might resemble the Bollinger Bands because it consist of three bands, upper, lower and middle band. So how do you trade this? If the asset is in a downtrend , you will see lower highs . If these lower highs retrace up to the upper band, you go with the main trend and take a sell. If you are in an uptrend , you should see higher lows that bounce off of the lower band. Stay concentrated on the highs and lows!
For tar

Description
Money Zones is an indicator that determines accumulation/distribution zones in the market. Green zones make it possible to look for buy entry points or sell exit points. Red zones, on the contrary, define the opportunity for selling or closing buys. The indicator has the ability to define money zones for two timeframes simultaneously on the same chart.
How to use?
Use this indicator to identify market zones as support/resistance zones to determine the best conditions for marke

The Resolved meter generates input signals and output levels with precision.
If the average price is blue, you should look for entry points to open long positions when the market is not overbought, and if the average price is red, you should look for entry points to open short positions when the market is not oversold. The rules can be summarized as follows. Buy during an uptrend, when the price reaches the average or oversold, and sell during a downtrend, when the price reaches the average o
This indicator takes input from Support and Resistance levels, combined with a special trend filter. Easily spot tops and bottoms, and trade with more confidence. Great for scalping or long-term trading. This indicator can be used on all time frames and pairs. Features alert function.
No need to set up the indicator.
How to use: Simply attach to any chart. Red histogram line color = Selling opportunities. Blue histogram line color = Buying opportunities. See pictures below. To spot highs/tops
Volume Zone is a unique indicator that uses special algorithm to determine the volumes traded for the period. There are two features of the indicator, the volumes price and and volumes zone. The volume price give the level at the buyers and sells entered the market. The zones also serve a good support/resistance and also site for demand/supply areas. The indicator was mainly designed to trade GBPUSD but also be applied on other pairs. The indicator can used by both beginners and advance trades.

PROMOTIONAL OFFER. NEXT PRICE WOULD BE 125 USD.
HAWA is pleased to introduce Price Action Setup indicator for all symbols with high success rate. It's advanced algorithm finds the spots for you where smart money is moving in or out of the market. Indicator will produce signals with pre-calculated entry and exit levels keeping money management in place. The system aims to achieve small, steady and consistent profits and reduce losses.
Unique Features: High Probability Success rate. Steady p

The Consequence indicator determines the moments of the trend reversal and the direction of its movements. He will provide you with everything you need to overcome the losses due to human emotions. Consequence is equipped with the most advanced, adaptable and profitable trading algorithms. It's time to stop wandering in the dark and gain a clear vision of goals in intraday trading, for which this indicator was created.
One of the secrets of short-term trading is knowing when to enter a trade.

Wolfe Waves scanner - It scans all the Symbols and identify the movement of price and it gives confidence in trade. It automatically plots fifth wave breaks out of the channel. According to the theory behind the pattern, a line drawn from the point at the beginning of the first wave and passing through the beginning of the fourth wave predicts a target price for the end of the fifth wave. If a trader properly identifies a Wolfe Wave as it forms, the beginning of the fifth wave represents an op

Trend surfer is indicator based on volume calculation in combination with algorithm that recognize trend changes . For aditional filtering, user can choose from 3 different oscillators, or can use their combination. Basic idea of indicator is to give signal when current volume is above value defined as Volume MA period*Volume MA multiplier, and trend change algorithm detects start of new trend wave. When all conditions are met and new trend wave is detected, indicator plot arrow on chart. Arrows

2 Copies left.. Royal Trend Indicator will close for public from 01 September 2022.
Royal Trend Indicator This is a Trend Indicator for MT4 Providing Signal To Enter The Position At The Best Time
It can be applied to any financial assets: F orex, Cryptocurrencies, Metals, Stocks, Indices . Benefits of the Royal Trend Indicator Entry Signals At The Best Possible Level The indicator algorithms allow you to find the ideal moments to enter a deal (buy or sell an asset), which increa
Indicator function As shown in the figure, choosing to buy or sell at the dotted line of the indicator, and following the trend with the Angle of the channel up and down, are equally effective in bands and trends It is best to use 1H for testing About update questions In order to be more suitable for market fluctuations, the company regularly updates the indicators Product cycle and trading time applicable to indicators Applicable mainstream currency pair EUR/USD GBP/USD NZD/USD AUD/US
Indicator function When the color of the indicator changes, it will send you a long short notice
It is best to use 1H for testing About update questions In order to be more suitable for market fluctuations, the company regularly updates the indicators Product cycle and trading time applicable to indicators Applicable mainstream currency pair EUR/USD GBP/USD NZD/USD AUD/USD USD/JPY USD/CAD USD/CHF Applicable mainstream cross currency pair EUR/JPY EUR/GBP EUR/CHF EUR/CAD EUR/NZD AUD/CAD A
Indicator function Choose to buy or sell at the critical point of indicator zero It is best to use 1H for testing About update questions In order to be more suitable for market fluctuations, the company regularly updates the indicators Product cycle and trading time applicable to indicators Applicable mainstream currency pair EUR/USD GBP/USD NZD/USD AUD/USD USD/JPY USD/CAD USD/CHF Applicable mainstream cross currency pair EUR/JPY EUR/GBP EUR/CHF EUR/CAD EUR/NZD AUD/CAD AUD/NZD AUD/CHF AUD

This is the new version of the Algorithmic signals featuring a new algorithm. It is a blend of technical and candlestick analysis. Candlestick analysis are often ignored while creating technical strategies but this version has a feature to include that and make confirmations more strong. Usage:- Traders can use the signals for buying and selling assets or even blend their own favorite indicators with it.

Indicator function This index buys and sells according to the color, using time is one hour,Please run the test on a 30-minute cycle It is best to use 1H for testing About update questions In order to be more suitable for market fluctuations, the company regularly updates the indicators Product cycle and trading time applicable to indicators Applicable mainstream currency pair EUR/USD GBP/USD NZD/USD AUD/USD USD/JPY USD/CAD USD/CHF Applicable mainstream cross currency pair EUR/JPY EUR/GBP E
MetaTrader市场是 出售自动交易和技术指标的最好地方。
您只需要以一个有吸引力的设计和良好的描述为MetaTrader平台开发应用程序。我们将为您解释如何在市场发布您的产品将它提供给数以百万计的MetaTrader用户。
您错过了交易机会:
- 免费交易应用程序
- 8,000+信号可供复制
- 探索金融市场的经济新闻
注册
登录