 MetaTrader 5
 专家
 指标
 程序库
 实用工具
 窗口小部件
 规则
适用于MetaTrader 4的免费EA交易和指标 - 54
 EA交易自动执行市场交易,而指标可使您更准确地分析报价并预测价格行为。
通过这些应用程序,您将能够更明智地在MetaTrader 4执行交易,抓住更多的交易机会。
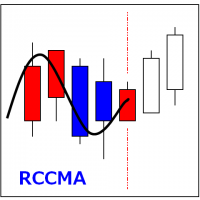
RCCMA is a general moving average indicator that works with ReviewCandleChart. Original is "Custom Moving Average" provided by MetaQuotes Software Corp. Based on that source code, I corresponded to ReviewCandleChart .
Advantages When ReviewCandleChart is ON, no line will be displayed on the right side from the vertical reference line. When ReviewCandleChart is ON and you press a key such as "Z" or "X" Following that, the MA is drawn. When ReviewCandleChart is OFF, the same drawing as the origin
FREE
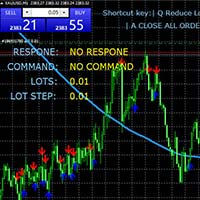
键盘交易 使用键盘快捷键进行交易,适用于剥头皮等快速快捷交易 可以自定义动态变更每次开仓头寸数量,且可以设定开仓订单止盈止损位置 使用说明 Q 减少手数 E 增加手数 W 买入 S 卖出 A 关闭所有订单 D 变更每次更改手数的数量 参数说明 open_lots 设定开仓手数 input_lots_step 设定 每次更改手数的数量步长 take profit in pips 设定止盈点数 Stop Loss in pips 设定止损点数 Slippage 设定开仓接受的滑点数 text_font 图表字体样式 introductory display 快捷键提示显示开关 text Size 文字大小 X distance for text 图表字体X轴位置 Y distance for text 图表字体Y轴位置 Text corner 图表字体展示位置
FREE
这个趋势顾问在任何意义上都是保守的。 它类似于 E79U EA,但有重要的区别。
首先,它的算法选择信号更灵活,更严格。 这允许您增加交易的手数。
其次,作者的设置最初是保守的。
最重要的是,这个EA不接受小的止损。 信号不经常和非常有选择地打开。 他不会profit钱,如果他失去了停止。 我没有完全消除止损,但我不想用这个参数开玩笑,我将它与风险参数相关联。 当止损减少时,风险会增加。 注意这一点。 最重要的是,只是不要改变止损。
这个专家顾问在D1图表上进行交易,自信地承受亏损并获得大额利润。
屏幕截图显示设置的两个选项。 两者都进行了3.5个月的测试。 在这两种情况下,初始存款为$100,风险为10,初始手数为1.14。 在第一个变体中,这些订单的数量是2,在第二个变体中,它同时承受18个订单,以显示几乎最大的回撤而不会排出存款。
EA是为usdzar货币对设计的。 如果您仍然决定使用其他对,请确保正确更改前三名的参数。
FREE

1.每月,每周和每日枢轴计算每个时期的开始和结束数据。
这在图表上提供了一条简单的线,用于识别枢轴的位置并减少计算误差。
3.即使您不了解如何计算枢轴,该指示器也将帮助非常快速地定义仪器的主要枢轴。
4.您还可以比较每周和每日的支点,以便您更好地了解价格的位置。
5该指标将帮助您更有效地交易,更接近阻力或支撑。
1. Měi yuè, měi zhōu hé měi rì shū zhóu jìsuàn měi gè shíqí de kāishǐ hé jiéshù shùjù.
Zhè zài túbiǎo shàng tígōngle yītiáo jiǎndān de xiàn, yòng yú shìbié shū zhóu de wèizhì bìng jiǎnshǎo jìsuàn wùchā.
3. Jíshǐ nín bù liǎojiě rúhé jìsuàn shū zhóu, gāi zhǐshì qì yě jiāng bāngzhù fēicháng kuàisù de dìngyì yíqì de zhǔyào shū zhóu.
4. N
FREE
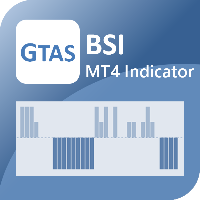
The GTAS BSI is an indicator designed to provide the trend direction and buy/sell signals, using combination of momentum indicators. This indicator was created by Bernard Prats Desclaux, proprietary trader and ex-hedge fund manager, founder of E-Winvest.
Description The BSI indicator is represented as a histogram under the price chart. +100 (green) value indicates a bullish trend. -100 (red) value indicates a bearish trend. When the BSI turns to +100 (green), it gives a potential buy signal. Wh
FREE
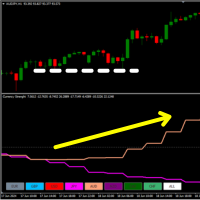
28 market in a Single Indicator! You have 8 Lines and each represents a currency { EUR - USD - GBP - JPY - AUD - NZD - CAD - CHF } .
What It Does? It calculates a custom oscillator on all 28 Forex Pairs and draws you the Strength of each currency. This way you can analyze the Trend and the Volatility on a Multicurrency Rate. Also by Clicking on two different currencies instantly changes the market.
How To Use It? You can use this indicator to find true market contractions when two currencie
FREE

3 strategies with RSI! Alerts! Signal freshness check! The indicator is based on the classic RSI. I recommend watching my advisor - Night Zen EA It includes 3 strategies: Entry of the RSI indicator into the overbought zone (for buy trades) / oversold (for sell trades) Exit of the RSI indicator from the overbought zone (for sell trades) / oversold (for buy trades) Touching the overbought limit (for sell trades) / oversold (for buy trades) The indicator provides alerts. To enable them in the s
FREE

iRSI in iMA is indicator to change color in iMA if iRSI crosses level up (up trend) or crosses level down (down trend). It is a useful tool to track when the upside and the downside iRSI on iMA.
You can to get source code from here.
Parameters MA_Periods — Period for iMA. MA_Method — Method for iMA. RSI_Periods — Period for iRSI. RSI_ApliedPrice — Price used for iRSI. RSI_LevelsUp — Level iRSI for up trend. RSI_LevelsDN — Level iRSI for down trend. BarsCount — How many bars will show the line
FREE

This Dashboard is free to download but is dependent on you owning the Flag Trend Pro MT4 indicator. Down load the indicator: Flag Trend Pro
The Dashboard will show you on a single chart all the timeframes (M1 to Monthly) with their own status for the indicator: Gold Pro MT4
all time frame and all symbol: smart algorithm detects the trend, filters out market noise and gives entry signals!!!
How to understand the status: symbol - Fill All the Pair what you want. M1, M5, M15,M3
FREE
The Bollinger Fading EA is a fully automated Expert Advisor that trades based on Bollinger Band and RSI entry signals. The EA trades using market orders and uses averaging to safely turn otherwise negative trades positive. This EA works best on EURUSD using the H1 timeframe. A VPS is advisable when trading this system. Check the comments for back test results and optimized settings. Please note: I have made the decision to give this EA away and many more for free with limited support so that I c
FREE

Hello everyone,
Today I want to share with you a strategy who is designed especially on EURUSD timeframe M1 .
Chevre miel is not spread sensitive . Chevre miel is very easy to use . Chevre miel does not use any dangerous strategy .
The expert is free because it doesn't trade often.
Settings : Autolotsize : can be true or false . if it's true the expert will trade with a percent of you balance that you can choose. if it's false the expert will trade with the lot that
FREE

The DJ_15_811543657_S_BB_CF_SQX is an algorithmic trading strategy for MetaTrader, tested on DJ using the M15 timeframe from December 7, 2017, to June 2, 2023. There is no need to set up parameters, all settings are already optimized and fine-tuned.
Recommended broker RoboForex because of EET timezone.
You can find the strategy source code for StrategyQuant at the link: https://quantmonitor.net/dow-jones-bollinger-breaker/
Key details are:
MagicNumber: 811543657
Main Chart: Current s
FREE

Free Version. This expert advisor is optimized for the USD/JPY forex value,It can be used for any forex currency by setting the values listed below. Its operation is based on a multi time frame moving average strategy, so it can be classified as a trend expert. When the trend has consolidated on one direction the algorithm buys or sells the currency pair. In the event of a trend inversion, there is a fixed stop loss, while the take profit is variable with the trailing stop function. For this
FREE

RSI indicator with signal lines, at the intersection of which a corresponding notification will be issued, which can be in the form of a normal alert, or in the form of a user sound file.
The indicator also has the function of sending push-notifications and email notifications at the intersection of these levels.
The values of the levels can be set independently in the indicator settings, and, if desired, they can be changed and configured directly in the indicator window. This product is a
FREE

The indicator displays the size of the spread for the current instrument on the chart. Very flexible in settings. It is possible to set the maximum value of the spread, upon exceeding which, the color of the spread label will change, and a signal will sound (if enabled in the settings). The indicator will be very convenient for people who trade on the news. You will never enter a trade with a large spread, as the indicator will notify you of this both visually and soundly. Input parameters: Aler
FREE

MT4 VERSION:
Este robô foi desenvolvido especificamente para EURUSD , um dos pares mais líquidos do mercado, e opera em timeframes maiores (H4, D1) . Sua estratégia é baseada na tendência do mercado , utilizando indicadores como Médias Móveis, ATR e Momentum para determinar os momentos certos de entrada e saída. O Robot Factory EURUSD H4 evita operações desnecessárias e ruído do mercado , focando apenas em trades de alta probabilidade . Ele combina análise técnica com volatilidade controlada ,
FREE

Signals and Alerts for Accelerator/Decelerator indicator based on these MQL5 posts: Accelerator Oscillator and Signals of the Indicator Accelerator Oscillator . Note : this tool is based on the code of Accelerator indicator developed by MetaQuotes Software Corp.
Features The signals are triggered at closing of last bar/opening of a new bar; Any kind of alerts can be enabled: Dialog Box, Email message, SMS notifications for smartphones and tablets, and Sound alerts; Customizable arrows. By d
FREE

The e-FastCHF EA is developed for GBPCHF. The EA has no trading limitations only on GBPCHF. 16.01.2015. The Swiss National Bank decided not to support the EUR/CHF course on the level of (1.20). Now it is pegged not to EUR but to USD. Our strategy is based on this fact. Tests have been performed from 02.01.2015. Timeframe – М15 Currency pair – GBPCHF No Martingale Calculation of lot basing on the balance (risk per trade). Supporting ECN accounts. This option operates as follows: first a position
FREE

T I P T O P
Tiptop is a trend following Expert Advisor that runs its own proprietary analysis and algorithm. No indicator is used to analyze the entry point. It based it only with each price bar movement and closing price. Same logic with "Volatility Watcher". For the exit plan, it uses the proprietary Sequence Method and implement the cut-losses-and-let-the-profit-run strategy. You will be surprised that at the closing of all trades, almost most of them are having a positive p
FREE
What is a tool ? This indicator use for forecast direction of the 28 pairs, Calculates from multiple pairs and timeframes and present by percentage as 70-79% , 80-89% , 90-100% is a little, medium and strong trend. How to use Place the indicator on any pair and any timeframe. Pair : Any Timeframe : Any Input Parameter No Visit my products Target Profit Magic Target Profit All The Profit Tracker Currency Scoring Pair Direction
FREE

Velociraptor is an Expert Advisor that exploits acceleration of volatility of the market. It goes into action when there is an explosion of volatility, for example during the news or special events. It is an evolution of the Volatility Accellerator EA with new features and the new algorithm for price acceleration calculation. The best new feature is an equity filter that disables the real trading if the EA is not more profitable. In agreement with filter settings, in this period, the EA will ope
FREE

MT-Radar — 用手机免费监控 MetaTrader 终端
想知道您的智能交易系统是否在运行、终端是否保持连接,又不想每次都通过 RDP 登录 VPS?
MT-Radar 在一个安全的网页面板中显示您所有 MT4/MT5 终端的状态。在手机、平板或任何电脑上打开它,几秒钟内即可确认一切运行正常。
MT-Radar 显示的内容: 账户和终端 — 账户信息和终端基本信息 日志 — 实时查看终端日志和专家日志 市场报价 — 您市场报价窗口中交易品种的报价 图表和智能交易系统 — 打开图表,查看在其上运行的 EA 的状态 所有终端集中在一个面板 — 不同电脑和 VPS 上的 MT4 和 MT5 隐私与安全
端到端加密 — 数据在本地 MTAgent-Radar 与网页面板之间的整个传输路径上都经过加密。中继服务器只转发加密流量,无法读取其内容。
密钥只属于您 — 加密密钥由您的个人密码生成,绝不会发送到任何服务器或第三方。
无入站端口 — MTAgent-Radar 以普通用户权限运行,不开放任何入站端口。
代码干净 — EA 不使用外部 DLL,不发送网络请求,也不执行任何交易
FREE
It is a demo version of Advanced Arrow indicator It works only on GBPJPY but the full version works on all currency pairs.
Features Simply it gives you entry point ,SL line and 4 TP lines or less. Once SL-TP lines are shown with the arrow, they remains as they are until signal change. It is historical indicator. No Repaint.
Indicator parameters Indicator Version : choose V5 or V6. TP 1 Line color : TP1 color. TP 2 Line color : TP2 color. TP 3 Line color : TP3 color. TP 4 Line color : TP4 colo
FREE

Convenient tool for measuring the number of points between the prices directly on the chart. Displays in the measurement between points in percentage, points (financial) and time (bars ). Compatible with all graphical timeframes. When fixed on the chart is displayed in all timeframes. Press Ctrl, click the first point, move the mouse and will now display the measurement. Click again and fix. Very fast tool that does not occupy much space. Input Parameters Line Color Line Style Text Color Text S
FREE

Follow the trail of the comet to know the development of the trend. This indicator helps you to determine the evolution of the price depending on how these astronomical objects are shown in the chart. When the comet seems to stop, it opens its tails considerably and warns us of a possible change in trend. On the contrary, when it seems to get speed (looks thin because lines of tail are grouped) demonstrates safety and continuity in trend. The head or comet nucleus will show red or green accordin
FREE
Indicator "Time to Bar End" (TimeToBarEnd)
This technical indicator is designed to accurately track the time remaining until the current candle closes on the chart. It displays a countdown in minutes:seconds format, which is particularly useful for intraday traders and scalpers who need to know the exact closing time of the current candle. The indicator updates in real-time and offers flexible customization of its appearance. The settings include: choice of position from four chart corners, adj
FREE

这是一个标准的布林带指标。 我为它在左下角增加了一个快捷的控制面板,在同时开启多个不同参数的该指标时,控制面板可以快捷开关不同参数的指标,以便于同时结合多个指标观察。 比如可以结合Period为20,Period为30的同时快速切换观察。 参数说明: Indicator ID: 指标的唯一ID。当启动多个实例的时候该ID必须唯一不能重复。 Control Panel Pos X: 指标控制面板的X位置。 Control Panel Pos Y: 指标控制面板的Y位置。 Control Panel Dislpay Name: 指标控制面板显示的文字内容。 Period: 计算布林带中线的平均周期。 Shift: 指标线按图表时间偏移量。 Deviations: 与主线的标准差数 。
FREE

EA scans trades by magic numbers from trading robots in mt4 terminals.
Then it passes the data on trades to EA`S HOLDER which filters the entry and exit signals by applying its own filters for opening and closing orders. Thus EA`S HOLDER conducts its trading based on the signals of running robots. Opening your own orders. Your trading robots transmit signals to this scanner. The scanner transmits signals to the senior EA and you have a lot of opportunities. Such as:
- Maintain
FREE

VisualOrders and InfoAccount - an indicator for analyzing your own trading or analyzing someone else's account.
Additionally, there is a possibility to quickly obtain information on the account and the terminal. Information is placed both on the chart and in the Experts tab.
All displayed information is disabled in the settings, allowing the trader to leave only the necessary information.
FREE
This indicator will mirror the assets in use in another metatrader, being able to choose the timeframe and a template. This is the Metatrader 4 Client, it needs the Metatrader 4 or 5 Server versions: Metatrader 4 Mirror Chart Server: https://www.mql5.com/en/market/product/88644
Metatrader 5 Mirror Chart Server: https://www.mql5.com/en/market/product/88652 Details of how it works in the video.
FREE

Arlene Sessions Background is an indicator that draws colored vertical background on the chart depending on your session. You can see the version 1 here: https://www.mql5.com/en/market/product/68822 You can see more of my publications here: https://www.mql5.com/en/users/joaquinmetayer/seller If you only want to paint a session on your chart, you must set the color "none" to deactivate it.
FREE

Lossy Mt4 trading expert advisor is rich of parameters that can help you to trade and hit targets it has excellent prediction strategy and many options that serve tp and sl in different shapes like in pips and in money also chart will be shown by arrows and lines and control panel as shown in screenshots you can use for any pair it is multi currency and high quality trend EA
FREE

The indicator summarizes all open positions. Settings: HeaderTextColor = Yellow; // Header text color FooterTextColor = Yellow; // Text color in totals ProfitColorPositive = Lime; // Color for gain values ProfitColorNegative = Red; // Color for loss values SeparatorColor = Gray; // Color for separators FontSize = 12; // Text size LineSpacing = 15; // Line spacing FontName = "Courier New"; // Font name TableCorner = 0; // 0: Top
FREE

This is a very simple multiple moving average indicator.
It can display 12 moving averages. The time axis of the moving averages can be changed in the input field of the indicator. The process is faster than the 12 moving averages included with MT4.
We also have a buffer set up so you can access it from an Expert Advisor. *For advanced users.
If you have any questions or requests, please message me.
Thank you. MT5 Version: https://www.mql5.com/en/market/product/124997
FREE
Do you want tidy and attractive charts? Let Hogvid Chart Scale help you! Chart Scale automatically scales the height of the chart to a configurable percentage of the total window height.
This creates space at the top and bottom of the window for additional visual elements and increases clarity without having to manually adjust the vertical scaling which can be annoying, especially if you change the chart symbol frequently.
The function can be activated and deactivated at any time with a simple
FREE

Indicator for the 4th strategy of the Pipsurfer EA. This indicator will allow the user to visually see the points of entry for strategy 4 of Pipsurfer. In the settings you will be able to adjust the parameters to mix and match to your trading style and find the settings that you want to either trade manually or tune the EA to do. Strategy 4 uses a market structure trend continuation approach to trading and looks for confirmed highs in downtrends and confirmed lows in uptrends to find great trend
FREE

This indicator is a histogram showing the trend based on 3 different moving averages. When all averages are set in ascending order, the indicator is green, and when in descending order, it is red. If the averages do not show a trend, the color is yellow. Additionally, each average can have different settings, such as Mode MA and Price MA. You can also set an alert and receive notifications on your phone.
To enable the alert and push notification, you need to activate them first in the MT4 settin
FREE

Just a panel for drawing levels. Minimal but very useful thing. This is a reimagining of Color Levels Pro. ---- 4 types of customized levels. support for rectangle and line levels. The indicator parameters are very simple and are divided into blocks. For any update idea please contact me here. ---- don't suffer don't suffer ---- Enjoy your work!!!!!!!! ----
FREE

基于股票软件黄金线指标改编。可根据需要调整参数值。具体使用规则请参考相关股票软件说明。 ////////////////////////////////////////////////////////////////////////////////////////// //股票公式源码如下:
VAR1:=(HIGH+LOW+OPEN+CLOSE)/4;
黄金线:EMA(3*VAR1-2*SMA(VAR1,2,1),13); //////////////////////////////////////////////////////////////////////////////////////////
声明 1 指标计算均基于价格变化而来, 不保证使用此指标的盈利性,作者不对使用此指标的任何损益负责。 2 本指标免费使用。
FREE

I like a simple Robot and I will share with you. I can provide some information about using Simple Moving Average (SMA) as a trading strategy in Forex. SMA is a commonly used technical analysis tool in Forex trading. It calculates the average price of a currency pair over a specified period of time, and the resulting line can be used to identify trends in the market. Traders often use the crossover of different time period SMAs (e.g. 50-day and 200-day) to identify potential buy or sell signals.
FREE

In physics, "Jerk" is the third time-derivative of position, with acceleration being the second derivative and velocity the first derivative. In technical analysis, the first derivative of price is the price momentum, with the second derivative,acceleration, being seldom used and the third derivative virtually unknown. The magnitude frequency response of a digital differentiator is a positive-slope straight line passing through zero frequency. Therefore, every instance of a digital signal differ
FREE

================================================================================ The utility is useful when you have to load history data for many symbols and timeframes. It loads the symbol used in the market watch. One symbol is scanned for all timeframes. Then the charts will be closed and the next symbol is scanned. You cannot abort the operation. Wait till it is done. ================================================================================
FREE
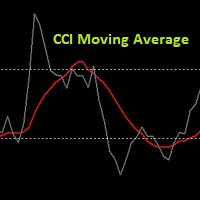
It's a very simple indicator. This is simply the CCI moving average. The CCI Moving Average Indicator allows us to reduce false signals and optimize our trading. The required indicator inputs are: CCI Period, CCI Applied Price, Period of CCI Moving Average and Method of CCI Moving Average. The chart displays the original CCI and its moving average. This is my first indicator that I publish. I hope the indicator will benefit you. The author of this indicator is Tomasz Buliński.
FREE
Update:ver1.53 (2023/08/16) ・ Overview and required environment Generate a duplicate limit order reservation for manual orders or orders from other tools, etc. This is specialized to "simplify the ordering operation". For the analysis to decide ordering, please do your best by yourself, such as fishing for materials, deriving a rule of thumb, using other analysis tools and EA together, etc. Since version 1.28, the function of "automatically re-order after settlement" has been implemented. (This
FREE
红黄绿简明指示趋势与震荡指标升级版。 使用红黄绿三色来标示上升趋势 、震荡、下跌趋势。 红色表示空头趋势(下跌)。 绿色表示多头趋势(上涨)。 黄色表示震荡区域。 从黄色转变为红色时,行情可能从震荡转变为下跌趋势。一段连续的红色,说明下跌趋势很强。 从黄色转变为绿色时,行情可能从震荡转变为上升趋势。一段连续的绿色,说明上升趋势很强。 指标的上半部分区域和下半部分区域若同步为红色,表明下跌趋势已经形成共振,接下来大概率走出一段空头趋势。 同时,红绿黄分为上下两部分:
若上下部分同时为绿色,表明上涨趋势已经形成共振,接下来大概率走出一段多头趋势。 若上下部分同时为红色,表明下跌趋势已经形成共振,接下来大概率走出一段空头趋势。
若上下同时为黄色,表明当前行情为震荡。 升级版2.0: 新增两条快慢线。 当慢线(Blue/Red线)为蓝色时,视为多头行情。当慢线为红色时,视为空头行情。 当快线(DarkGray线)从下方向上穿过慢线时,作为参考做多信号,激进交易者可进场做多。反之亦然。
参数可调。 //+---------------------------------------------
FREE
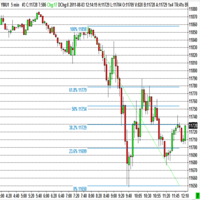
The program automatically draws fibonacci. This will save you a great deal of time in studying the chart. My intention is to facilitate those who carry out a study of the graph manually and use Fibonacci. In the screenshot you can see the result.The script applies to the chart of any currency pair or any stock. It will not open any purchase or sale operation because this program is limited only to drawing fibonacci.
FREE

The VMA is an exponential moving average that adjusts its smoothing constant on the basis of market volatility. Its sensitivity grows as long as the volatility of the data increases. Based on the Chande's Momentum Oscillator, the VMA can automatically adjust its smoothing period as market conditions change, helping you to detect trend reversals and retracements much quicker and more reliable when compared to traditional moving averages.
FREE
TriadStrategiesFx-полностью автоматический эксперт с тремя стратегиями. Каждая стратегия работает отдельно.Для переключения стратегий необходимо изменить параметры советника в окне настроек. По умолчанию TriadStrategiesFx работает по классическому мартингейлу, локированием убыточного ордера.Как правило, закрытие всех ордеров происходит по совокупной прибыли после выхода из флетового коридора, после чего начинается новый цикл.
Вторая стратегия, предусмотренная в эксперте, также является кла
FREE

Harami is a two candle pattern with recent candle formed inside the previous candle's high and low . It represents indecision in the market and is used for breakout price action trading strategy. This indi fires all signals to a dashboard on the chart including pop_up alert, push to phone notification and email. Harami has two types, bullish and bearish pattern. Enter long for bullish Harami and enter short for bearish Harami. Inputs : Currency Symbols: EURUSD,GBPJPY,USDJPY,USDCAD (default) , u
FREE

This reliable, professional trade copier system is without a doubt one of the best on the market, it is able to copy trades at very fast speeds from one master account (sender) to one or multiple slave accounts (receivers). The system works very fast and mimics the master account a full 100%. So changing stop losses, take profits, pending orders on the master account is executed on the slave accounts too, like each other action. It is a 100% full copy (unlike many other copiers who only copy mar
FREE

功能 勾选需要显示的内容,(当前版本包括当前K线倒计时,市场信息)并显示到图表右下角。
显示格式参数 fontsize 字体大小
c 颜色 font 字体类型
自定义显示的内容 参数 Symbol candle time left SPREAD DIGITS STOPLEVEL LOTSIZE LOTSIZE TICKSIZE SWAPLONG SWAPSHORT STARTING EXPIRATION TRADEALLOWED MINLOT LOTSTEP MAXLOT SWAPTYPE PROFITCALCMODE MARGINCALCMODE MARGININIT MARGINMAINTENANCE MARGINHEDGED MARGINREQUIRED FREEZELEVEL CLOSEBY_ALLOWED
FREE
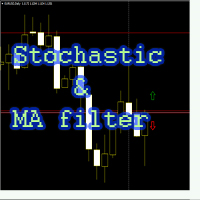
Советник "Stochastic and MA_filter" торгует по индикатору "Stochastic Oscillator", используя фильтр в качестве двух средних скользящих, по желанию Пользователя применяется мартингейл (количество умножения лота при серии убытков ограничивается), безубыток, трейлинг стоп, инвертирование сигнала, возможно настроить, как скальпирующий советник.
Для каждого валютного инструмента необходимо подбирать настройки. Настройки советника: Индикатор Stochastic Oscillator: Kperiod=5; период линии K Dpe
FREE

As we know, МТ4 and МТ5 do not store tick history, which may be necessary to develop trading strategies and market analysis. I have developed a method allowing you to receive tick history very easily. The indicator gathers tick history in real time and writes it to XXXXXX2.hst file, where XXXXXX is a symbol name. This file can be used to create an offline chart or something else. If you use a trading robot, then launch the indicator and control your broker by examining the spread and quotes. All
FREE

The indicator calculates running total of linear weighted returns. It transforms rates into integrated and difference-stationary time series with distinctive buy and sell zones. Buy zones are shown in blue, sell zones in red. Parameters: period - number of bars to use for linear weighted calculation; default value - 96; smoothing - period for EMA; default value - 5; mode - an integer value for choosing calculation mode: 0 - long term trading; 1 - medium term trading; 2 - short term trading; defa
FREE

Ever wondered what is XAU/XAG rate or how Chinese Yuan is traded against Russian Ruble? This indicator gives the answers. It shows a cross rate between current chart symbol and other symbol specified in parameters. Both symbols must have a common currency. For example, in cases of XAUUSD and XAGUSD, or USDRUB and USDCHN, USD is the common currency. The indicator tries to determine the common part from symbols automatically. If it fails, the DefaultBase parameter is used. It is required for non-F
FREE

EA_Agr_Test
This is a free version of EA_Agr_Full , designed to provide the buyer with the opportunity to check the product not in the tester, but on a live account. Here exactly the same trading algorithm is used, but there is no possibility to change the parameters, except for GMToffset .
Orders cannot be more than 0.01 lot and profit is taken very early.
For this reason, it is impossible to achieve high returns. Algorithm verified with broker just2trade
Parameters
GMToffset - differenc
FREE

The LevelsPivotMT4 plots the pivot points and forms the support and resistance levels. The indicator does not repaint.
Default colors Yellow - pivot point. Green - resistance levels R1, R2, R3. Red - support levels S1, S2, S3. Installed similar to any standard indicator.
Analysis rules Trade the rebound from support or resistance lines. Accordingly, the target is the central line (the pivot point, yellow by default).
FREE

The indicator allows you to trade binary options. The recommended time frame is М1 and the expiration time is 1,2,3 minutes. The indicator suitable for auto and manual trading. A possible signal is specified as a arrows above/under a candle. You should wait until the candle closes! Arrows are not re-painted Trade sessions: TOKYO section (Half-end) Currency pairs: USD/JPY Working time frame: M1 Expiration time: 1,2,3 minutes. The indicator also shows good results when using the martingale strateg
FREE
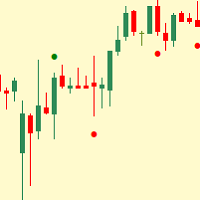
Simple indicator that shows external ( outside ) bars. In certain cases, external bars can be seen as strong trend bars instead of range bars. This can be observed when a with-trend external bar occurs at a reversal from a strong trend. It will help you notice more easily different patterns like - Inside-outside-inside, Inside- Inside -inside, outside - Inside -outside, etc. Works perfectly with my other free indicators Internal bar and Shadows
Inputs: How many history bars to calculate on loa
FREE
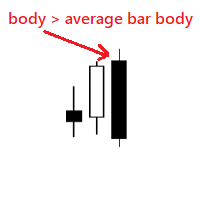
Very simple indicator that shows if body of a new bar is bigger than the average bar body. We can use the indicator to notice bars that are bigger than usual, for example this could mean a new trend. Input params: history bars to display from how many bars to get the average bar body To calculate only bars from the same type distance for the dots bull color bear color dot size
FREE

Active Price Lines
Indicator gives you full custom control over the Bid and Ask price lines, both color and style. Color control is also customizable based on increased or decreased price by the tick.
Options include: Show both the Bid line and the Ask line Set unique color for each Set unique line style for each Set unique color for increased price (by the tick) Show only Bid line Show only Ask line
Rider Capital Group
FREE

MetaTrader indicator that detects WRBs (Wide Range Bodies/Bars) and Hidden Gaps.
WRB Hidden Gap MetaTrader indicator detects WRB and marks it. WRB can be either a Wide Range Bar (a very large bar) or a Wide Range Body (a candlestick that has a very long body). WRB alone do not provide much information so the indicator uses WRB to detect Hidden Gaps. The indicator also displays filled and unfilled Hidden Gaps in a different way, making it easier to view the market situation at a glance
FREE

This indicator displays two important pieces of information on the MT4 chart: Current Spread - Trading cost measured in points, helping traders assess optimal entry timing when spread is low. Time Countdown - Remaining time (minutes:seconds) until the current candle closes and a new candle forms, supporting candle-based trading strategies. Information is displayed as compact text in a chart corner (default top-right), with customizable position, color, and font size. The indicator updates in rea
FREE
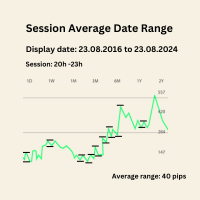
Session Average Date Range: Analyze and average the low - high of specific trading sessions within custom date ranges, offering insights into price movements and market behavior over selected periods. The "Session Average Date Range" tool is an advanced analytical utility designed to empower traders and analysts by allowing them to dissect and evaluate the high and low range of specific trading sessions within a user-defined date range. This tool provides a flexible and precise approach to analy
FREE

Price Trap Test
This is a free version of the Price Trap Full Expert Advisor designed to provide an opportunity for free testing of the algorithm on a live account, and not in the strategy tester. The trading signals algorithm is exactly the same here, the difference is that you cannot change the parameters, with the exception of GMToffset . Full version verified with broker just2trade Parameters
GMToffset - your broker's time difference and GMT.
FREE

This indicator compares the price changes during the specified period for the current symbol and other reference symbol. It allows to analyze the similar movements of highly correlated symbols, such as XAUUSD and XAGUSD, and find their occasional convergences and divergences for trading opportunities. The indicator displays the following buffers: light-green thick line - price changes of the current symbol for TimeGap bars; light-blue thin line - price changes of the reference symbol ( LeadSymbo
FREE
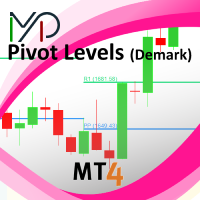
This indicator is stand alone version from MP Pivot Levels (All in one) containing Demark's Pivots.
Calculations: PP = X / 4 R1 = X / 2 - LOWprev S1 = X / 2 - HIGHprev Uses: When the pair currency price may change the direction of movement. Possible constraints of support and resistance that creates plateaus for the currency pair prices. Tendency identification by comparing the present prices according to current day's pivot point and also the prior day's pivot points. ____________
FREE

Discret Trader is a rule-based Expert Advisor for MetaTrader 4, built for GBPUSD on the M15 timeframe. How it works The EA evaluates closed bars only and opens one position at a time. Entry: the Commodity Channel Index must cross its level (+140 for buys, -140 for sells) and the Stochastic main line must confirm the direction relative to its signal line. Exit: a fixed Stop Loss and Take Profit, plus an early exit when price crosses back through the Donchian Channel. Default settings Symbol / tim
FREE

Predetermination is an exit manager for trades you open yourself. It does not open positions and it does not send signals. After a manual buy or sell, it gives that trade a stop and up to six exit stages based on volatility. Three stages come from Average True Range, each with its own timeframe. Three come from completed range: daily (ADR), weekly (AWR), and monthly (AMR). Each stage can be switched on or off. Enabled stages are sorted by distance. Nearer stages trail the stop. The
FREE
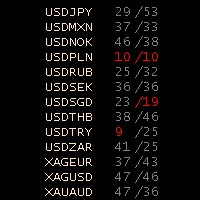
Stochastic Oscillator Panel Introducing the Stochastic Oscillator Panel, a comprehensive representation of the stochastic oscillator for all currencies (up to 75 pairs). This powerful tool operates within the current time frame, utilizing the simple moving average and relying on the Low/High prices. The panel consists of three columns: Name of the currency MODE_MAIN (main line) MODE_SIGNAL (signal line) The Stochastic Oscillator Panel provides visual cues through color coding: Green color (overb
FREE
MetaTrader市场是一个简单方便的网站,在这里开发者可以出售自己的交易应用程序。
我们将帮助您发布您的产品,并向您解释如何为市场准备您的产品描述。市场上所有的应用程序都是加密保护并且只能在买家的电脑上运行。非法拷贝是不可能的。
