|
1 yıl
deneyim
|
15
ürünler
|
0
demo sürümleri
|
|
0
işler
|
0
sinyaller
|
0
aboneler
|
Az Speedometer measures price impulse quality — not just candle size, but whether that move is backed by real momentum, volume, and direction. A single glance tells you if the current bar is a meaningful push or just noise. "A green bar alone means nothing. Az Speedometer shows you green bars with high volume, a clean candle body, and three consecutive bullish closes — that's a signal worth taking." How it works: Speed ratio : Candle range vs ATR — how fast is price moving relative
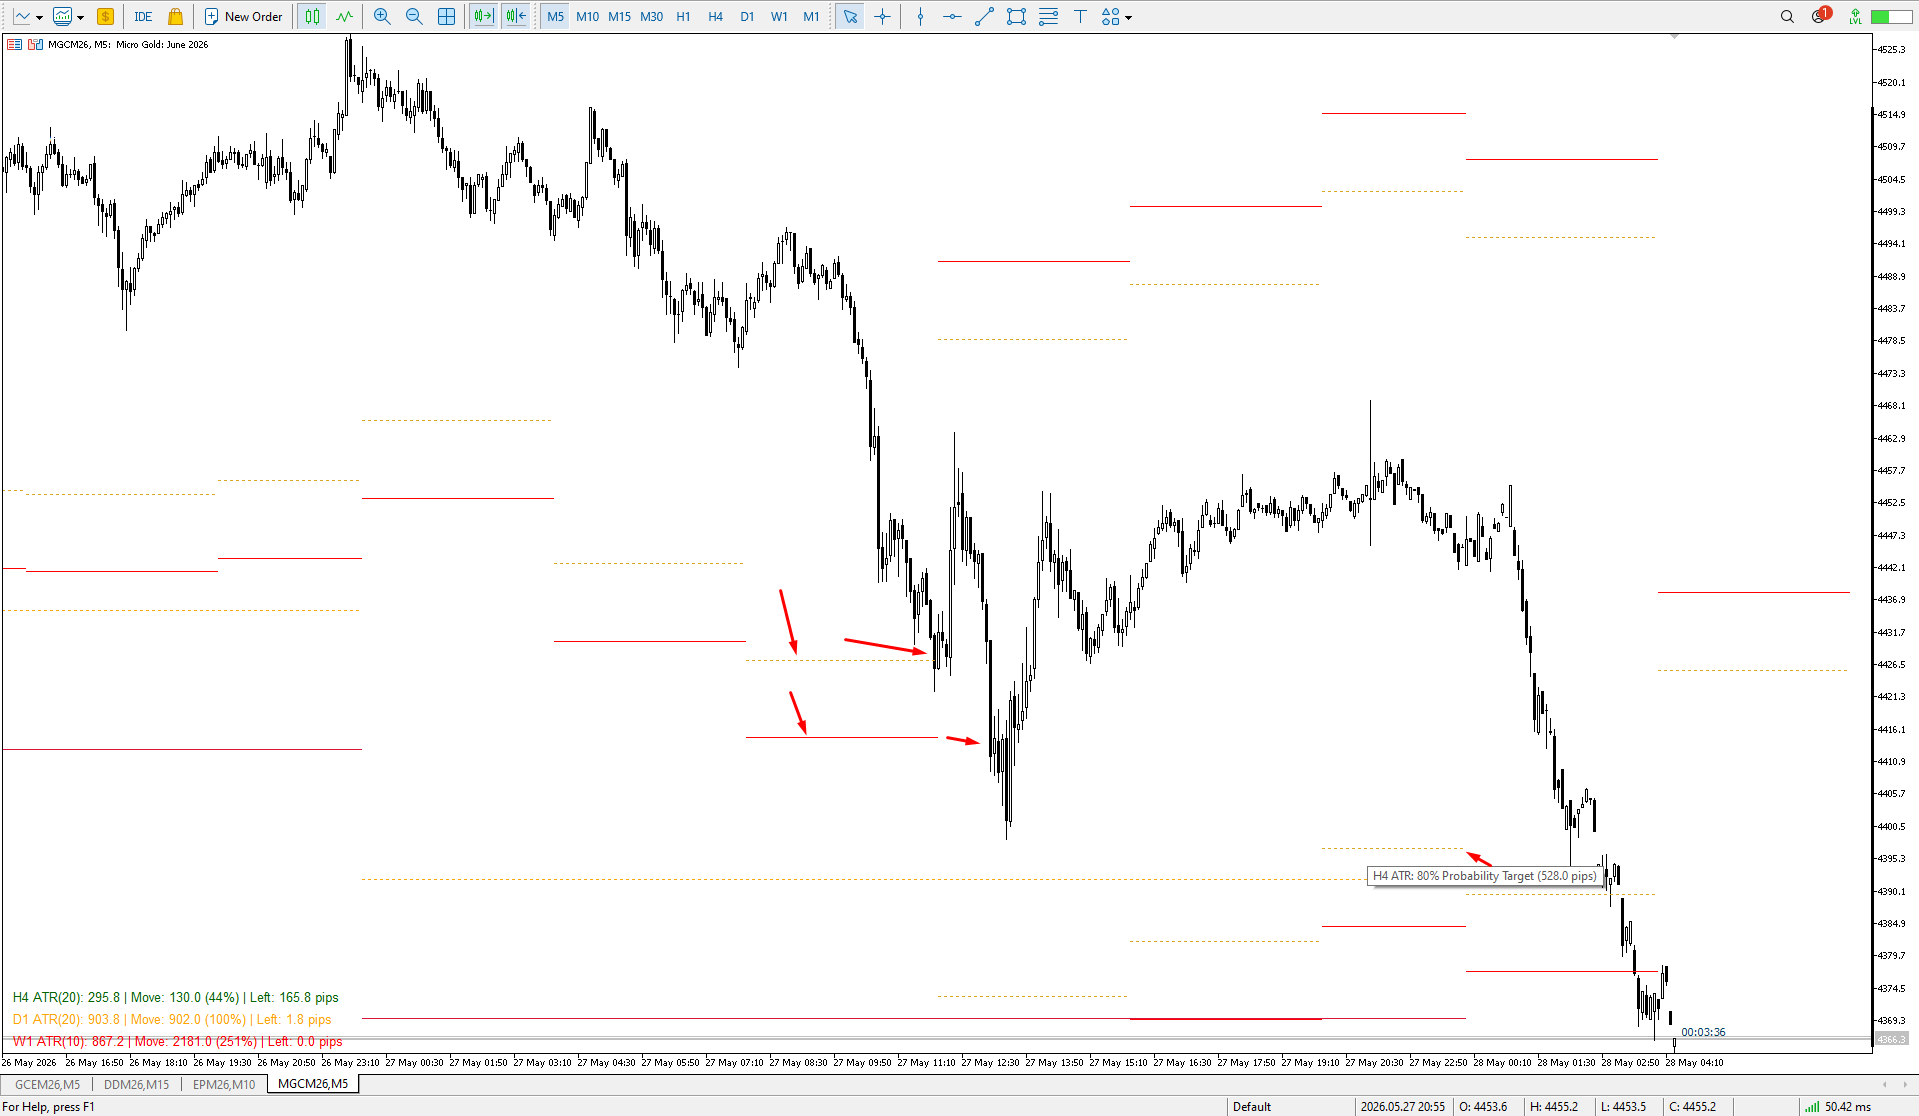
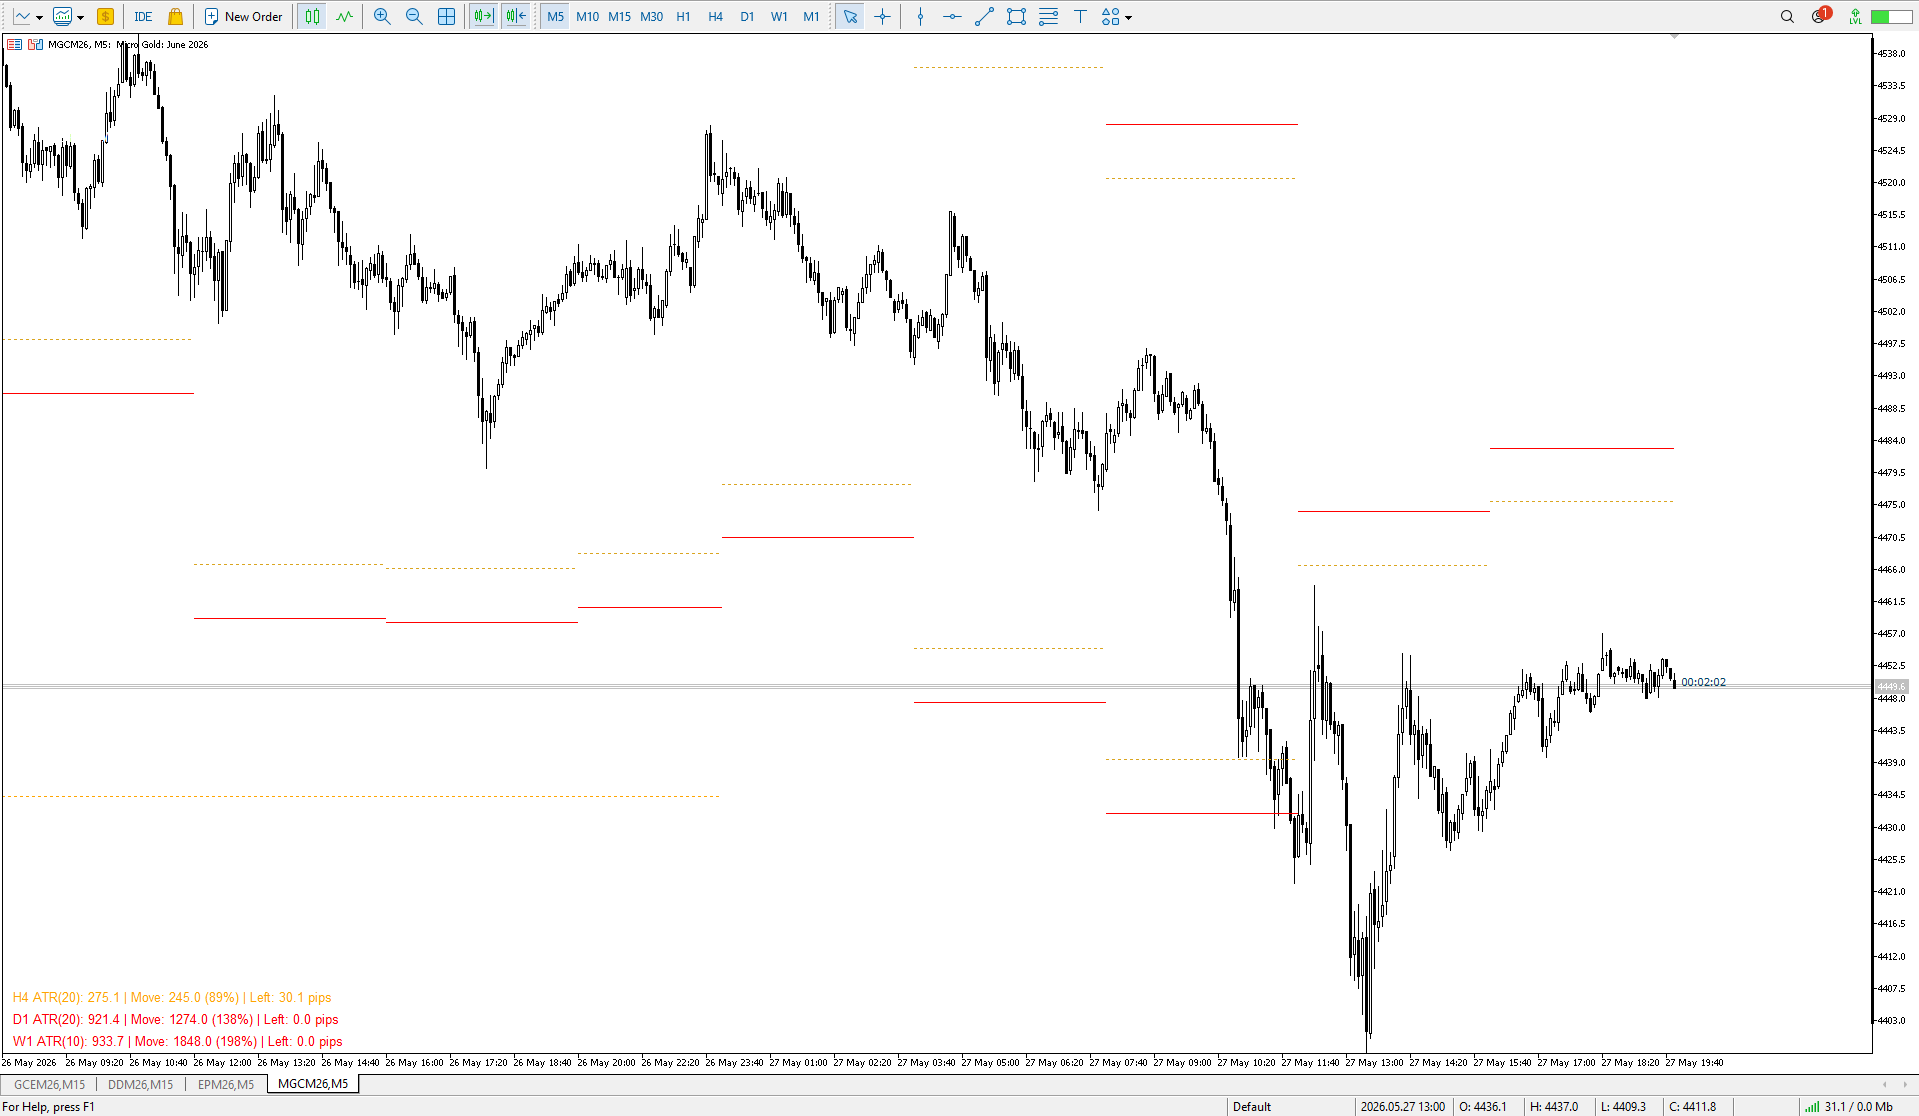
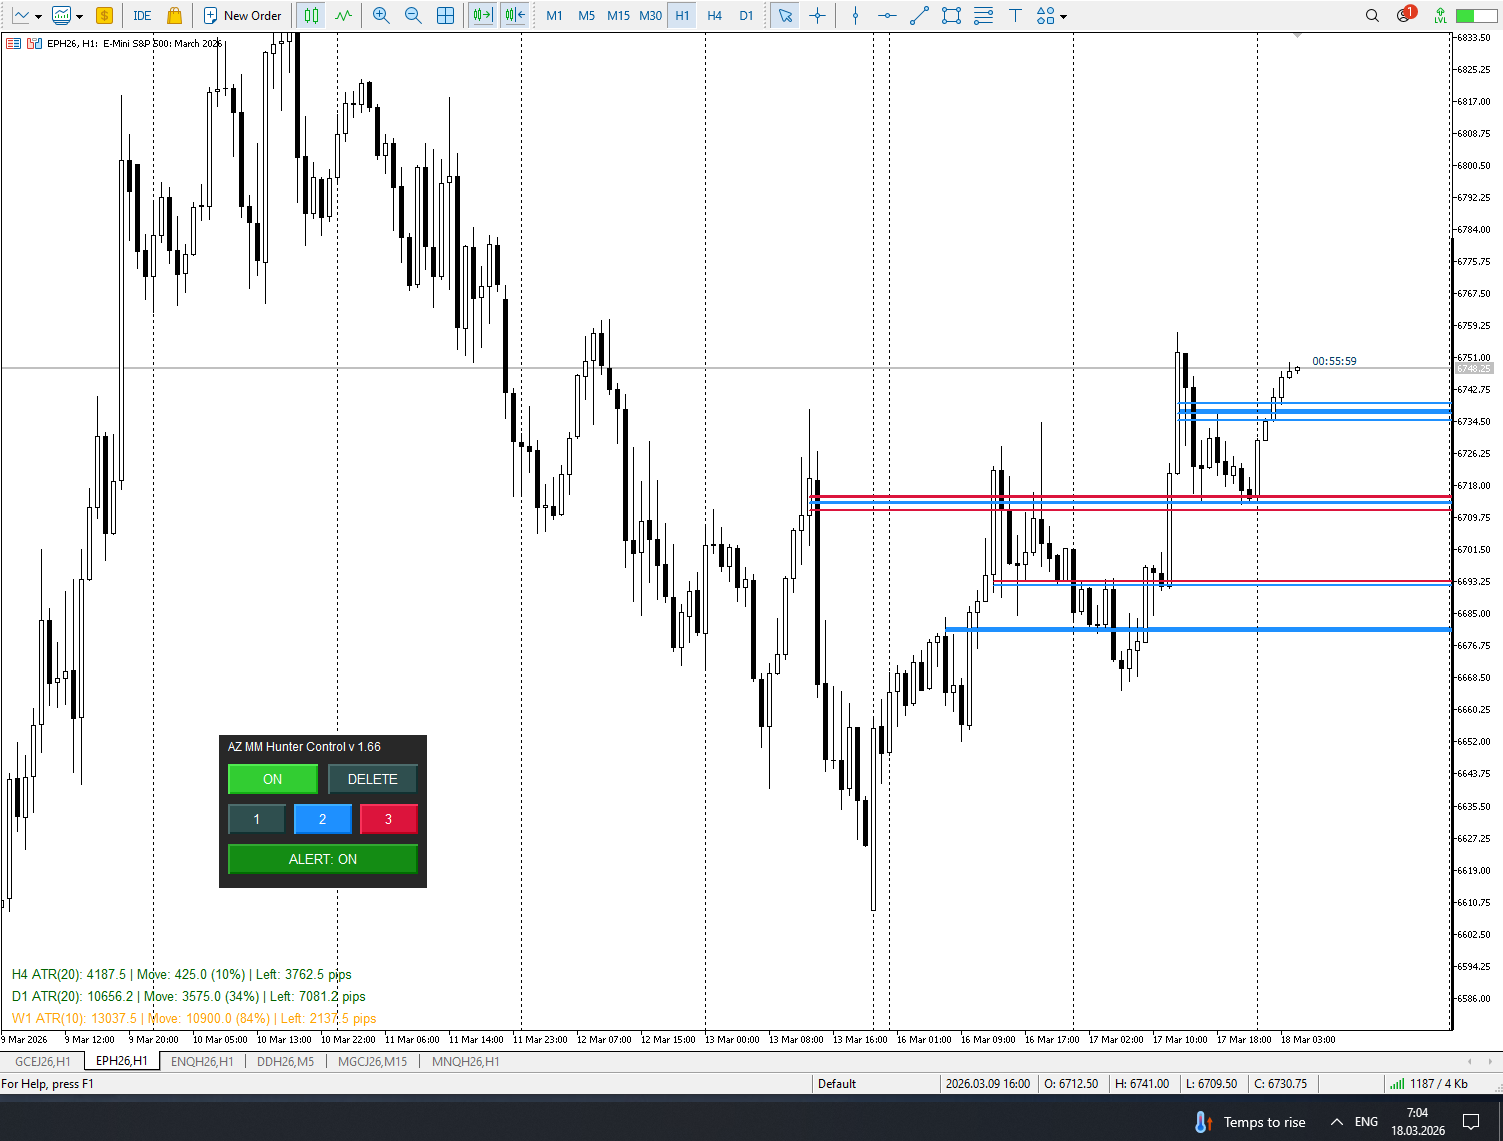
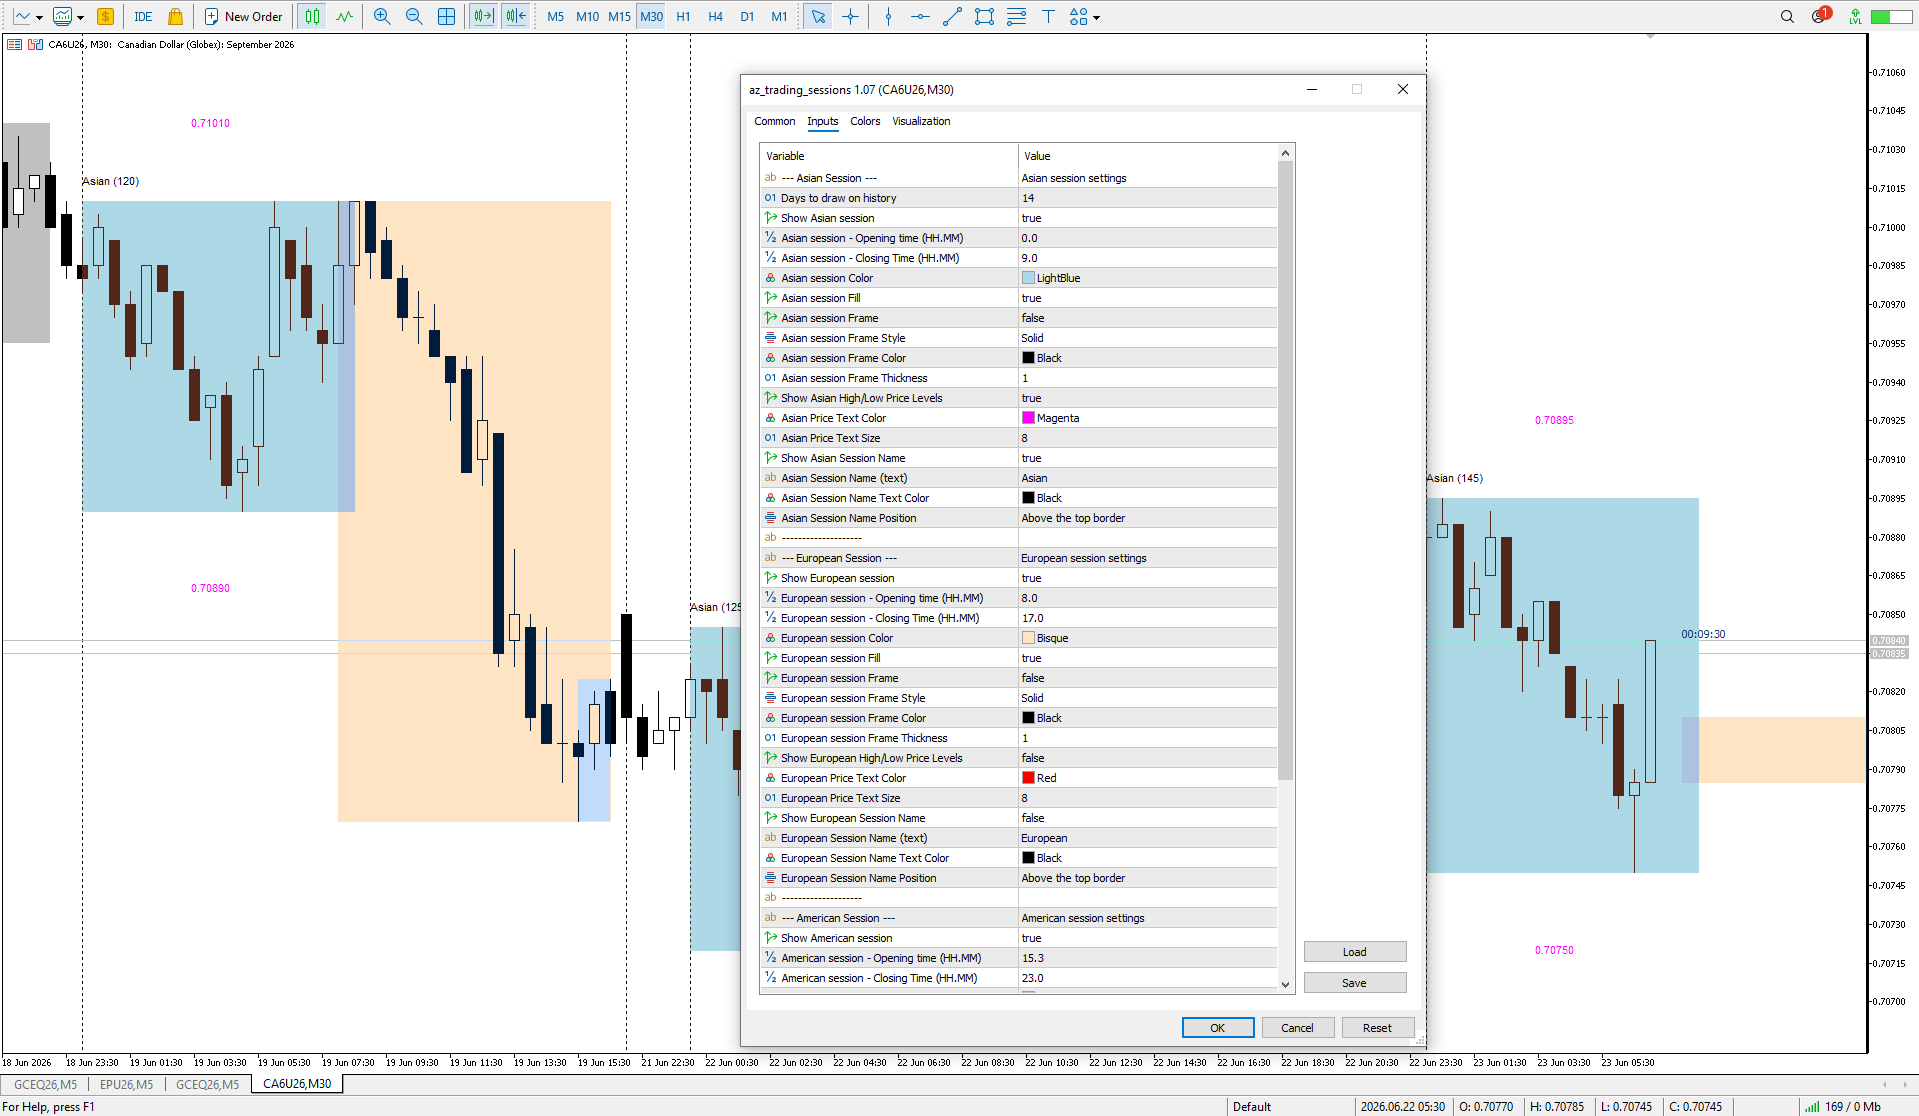
# az_session_atr — Инструкция по настройкам ## Что показывает индикатор Индикатор показывает ATR для каждой сессии по отдельности. Если вы торгуете исключительно Европу - то иногда нет смысла смотреть на обычный дневной ATR Для каждой из трёх торговых сессий (Азия, Европа, Америка) отображается строка вида: ``` Asia ATR(20): 42.3 | Move: 18.7 (44%) | Left: 23.6 ● ``` | Поле | Значение | |---|---| | `ATR(20)` | Медианный ATR за 20 торговых дней | | `Move: 18.7 (44%)` | Сколько пипсов прошла цена
We all know that the start of an H4 candle can be 'shifted' depending on the broker. I wrote an indicator that draws candles "shifted" to the desired value. Plus, it draws H4 candles on smaller timeframes too. Works on timeframes up to H4, allowing for a clear comparison with the broker's results. There's a separate option to customize the candlestick body and outline fill. You can also customize the drawing for a specific period on history