• Genel bakış
  • İncelemeler (3)
  • Yorumlar
  • Yenilikler

Fixed Range Volume Profile MT5

2
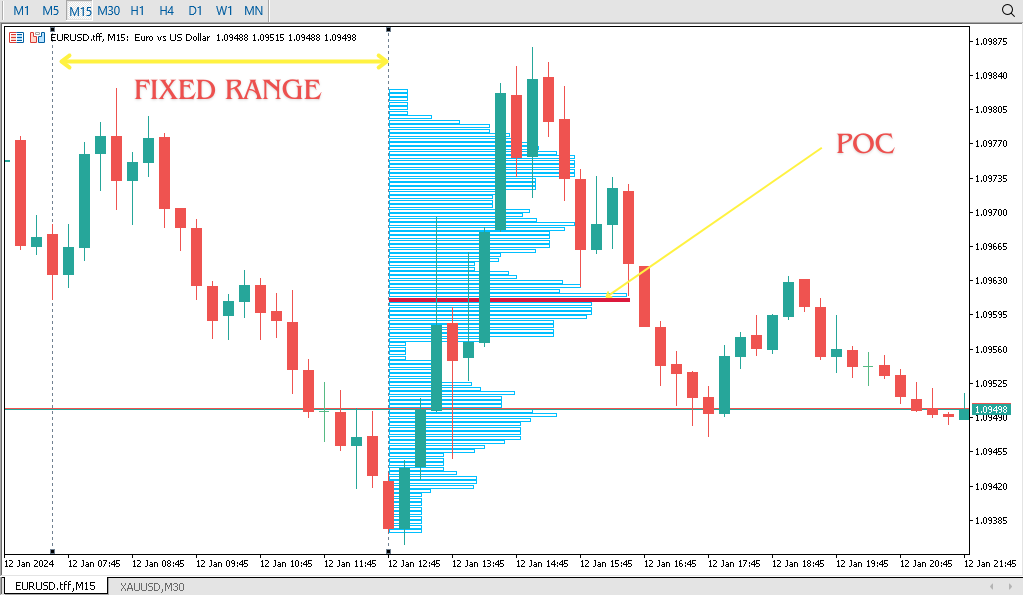
MT5 için uyarılar içeren Otomatik Sabit Aralık Hacim Profili

Bu gösterge, fiyatın nerede daha fazla zaman harcadığını gösterir ve ticarette kullanılabilecek önemli seviyeleri vurgular.

ve belirli bir ticaret seansının en önemli fiyat seviyelerini, değer alanını ve kontrol değerini özetleyerek zaman içindeki fiyat yoğunluğunu gösterebilir. Bu gösterge, M1 ile D1 arasındaki zaman dilimlerine eklenebilir ve günlük, haftalık, aylık ve hatta gün içi oturumlar için Piyasa Profilini gösterir. Daha düşük zaman dilimleri daha yüksek hassasiyet sunar. Daha iyi görünürlük için daha yüksek zaman dilimleri önerilir. Herhangi bir zaman diliminde özel bir piyasa profili oluşturmak için serbest çizim dikdörtgen oturumu kullanmak da mümkündür. Profil bloklarını çizmek için altı farklı renk şeması mevcuttur. Profilleri düz renkli histogram olarak çizmek de mümkündür. Alternatif olarak, profili yükseliş/düşüş çubuklarına göre renklendirmeyi seçebilirsiniz. Bu gösterge, çıplak fiyat hareketine dayalıdır ve herhangi bir standart gösterge kullanmaz.

Değer Alanı yüksek ve düşük, Medyan ve Tek Baskı bölgeleri seviyelerini aşan fiyatlar için bir uyarı sistemi mevcuttur.

Giriş ayarları :

StartFromDate (default = __DATE__) — StartFromCurrentSession yanlışsa gösterge bu tarihten itibaren profil çizmeye başlar. Geçmişe çekiyor. Örneğin, 2018-01-20 olarak ayarlarsanız ve SessionsToCount 2 ise, 2018-01-20 ve 2018-01-19 için profilleri çizecektir.


Oturum (varsayılan = Günlük) — piyasa profili için işlem oturumu: Günlük, Haftalık, Aylık, Gün İçi ve Dikdörtgen. Bir dikdörtgen oturumun hesaplanabilmesi için, grafiğe adı MPR ile başlayan bir dikdörtgen grafik nesnesi eklenmelidir. Klavyede 'r' tuşuna basmak, otomatik olarak uygun şekilde adlandırılmış bir dikdörtgen nesne ekleyecektir.


StartFromCurrentSession (default = true) — true ise, gösterge bugünden, aksi takdirde — StartFromDate'te verilen tarihten itibaren çizime başlar.


SeamlessScrollingMode (default = false) — true ise, StartFromDate ve StartFromCurrentSession parametreleri dikkate alınmaz; oturumlar, geçerli grafik konumunun en sağdaki çubuğundan başlayarak hesaplanır ve görüntülenir. Bu, geçmiş oturumları görüntülemek için zamanda süresiz olarak geri kaydırmaya izin verir.


ValueAreaPercentage (varsayılan = 70) — oturumun TPO'larının Değer Alanına eklenecek yüzde payı.


SessionsToCount (varsayılan = 2) — piyasa profillerini çizmek için kaç işlem seansı için.
EnableDevelopingPOC (varsayılan = yanlış) — doğruysa, Oturum boyunca Kontrol Noktasının nasıl geliştiğini göstermek için birden çok yatay çizgi çizilir.
Önerilen ürünler
VPO Profile MT5
Kyra Nickaline Watson-gordon
5 (2)
Definition : VPO is a Volume Price Opportunity. Instead of using bars or candles with an Open, High, Low, and Close price, each "bar" in a Market Profile is represented by horizontal bars against the price It is called Market Profile terminology. In other words volume-price-opportunity (VPO) profiles are histograms of how many volumes were traded at each price within the span of the profile. By using a VPO chart, you are able to analyze the amount of trading activity, based on volume, for eac
Was: $249  Now: $99   Market Profile defines a number of day types that can help the trader to determine market behaviour. A key feature is the Value Area, representing the range of price action where 70% of trading took place. Understanding the Value Area can give traders valuable insight into market direction and establish the higher odds trade. It is an excellent addition to any system you may be using. Inspired by Jim Dalton’s book “Mind Over Markets”, this indicator is designed to suit the
BoxChart MT5
Evgeny Shevtsov
5 (7)
The market is unfair if only because 10% of participants manage 90% of funds. An ordinary trader has slim changes to stand against these "vultures". This problem can be solved. You just need to be among these 10%, learn to predict their intentions and move with them. Volume is the only preemptive factor that faultlessly works on any timeframe and symbol. First, the volume appears and is accumulated, and only then the price moves. The price moves from one volume to another. Areas of volume accumu
Volume Profile V6
Andrey Kolesnik
4.5 (2)
Market volume profile indicator.  It works on almost all instruments - currency pairs, stocks, futures, on real volumes and on ticks.  It can be set as automatic determination of the range of building a profile, for example, for a week or a month, etc.  and set the range manually by moving the borders (two vertical lines red and blue).  Shown as a bar graph.  The width of the histogram at a given level means, conventionally, the number of trades made on it.  With the "Mode level line color" para
Multicurrency and multitimeframe modification of the Relative Strength Index (RSI) indicator. You can specify any desired currencies and timeframes in the parameters. Also, the panel can send notifications when crossing overbought and oversold levels. By clicking on a cell with a period, this symbol and period will be opened. This is MTF Scanner. The key to hide the dashboard from the chart is "D" by default. Similar to the Currency Strength Meter, the Dashboard can automatically select pairs c
The Volume by Price Indicator for MetaTrader 5 features Volume Profile and Market Profile TPO (Time Price Opportunity). Get valuable insights out of currencies, equities and commodities data. Gain an edge trading financial markets. Volume and TPO histogram bar and line charts. Volume Footprint charts. TPO letter and block marker charts including split structures. Versatile segmentation and compositing methods. Static, dynamic and flexible ranges with relative and/or absolute visualizations. Lay
The   Supply and Demand Zones indicator   is one of the best tools we have ever made. This great tool automatically draws supply and demand zones, the best places for opening and closing positions. It has many advanced features such as multi timeframe zones support, displaying the width of zones, alert notifications for retouched zones, and much more. Because of market fractality, this indicator can be used for any kind of trading. Whether you are a positional, swing, or intraday trader does no
Blahtech Supply Demand MT5
Blahtech Limited
4.57 (14)
Was: $299  Now: $99   Supply Demand uses previous price action to identify potential imbalances between buyers and sellers. The key is to identify the better odds zones, not just the untouched ones. Blahtech Supply Demand indicator delivers functionality previously unavailable on any trading platform. This 4-in-1 indicator not only highlights the higher probability zones using a multi-criteria strength engine, but also combines it with multi-timeframe trend analysis, previously confirmed swings
This indicator is the same as the popular Heiken Ashi Smoothed. The Heikin Ashi indicator for MetaTrader 5 already exists, but it has two disadvantages: It paints the candles not accurate. It's not possible to change the candle width. See also Heikin Ashi in MQL5 Code Base . In this version there are no such disadvantages.
Premium seviye, %80'den fazla doğru tahmin doğruluğuna sahip benzersiz bir göstergedir! Bu gösterge en iyi Ticaret Uzmanları tarafından iki aydan uzun süredir test edilmiştir! Yazarın göstergesini başka hiçbir yerde bulamazsınız! Ekran görüntülerinden bu aracın doğruluğunu kendiniz görebilirsiniz! 1, sona erme süresi 1 mum olan ikili opsiyon ticareti için harikadır. 2 tüm döviz çiftleri, hisse senetleri, emtialar, kripto para birimleri üzerinde çalışır Talimatlar: Kırmızı ok görün
Each bar graph is a brick, take buy a bill now as an example, the brick that is in lowest position at the moment, go to the left, when the brick with the 3rd highest is in existence, take the height of this brick as a benchmark, when the price exceeds the height of this brick, can establish buy a bill, when appear opposite circumstance closes a position, establish empty order at the same time. This is a simple rule, need each friend grope by oneself.
This indicator is a conventional analytical tool for tick volumes changes. It calculates tick volumes for buys and sells separately, and their delta on every bar, and displays volumes by price clusters (cells) within a specified bar (usually the latest one). The algorithm used internally is the same as in the indicator VolumeDeltaMT5 , but results are shown as cumulative volume delta bars (candlesticks). Analogous indicator for MetaTrader 4 exists - CumulativeDeltaBars . This is a limited substi
Otomatik sipariş ve risk yönetimi için yardımcı program. Kârlardan maksimumu almanızı ve kayıplarınızı sınırlandırmanızı sağlar. Tüccarlar için pratik bir tüccar tarafından düzenlendi. Yardımcı programın kullanımı kolaydır, bir tüccar tarafından manuel olarak veya danışmanların yardımıyla açılan herhangi bir piyasa emriyle çalışır. İşlemleri sihirli sayıya göre filtreleyebilir. Yardımcı program aynı anda herhangi bir sayıda siparişle çalışabilir. Aşağıdaki işlevlere sahiptir: 1. Zararı
An ICT fair value gap is a trading concept that identifies market imbalances based on a three-candle sequence. The middle candle has a large body while the adjacent candles have upper and lower wicks that do not overlap with the middle candle. This formation suggests that there is an imbalance where buying and selling powers are not equal. Settings Minimum size of FVG (pips) -> FVGs less than the indicated pips will be not be drawn Show touched FVGs Normal FVG color -> color of FVG that hasn't
FREE
Market profile was developed by Peter Steidlmayer in the second half of last century. This is a very effective tool if you understand the nature and usage. It's not like common tools like EMA, RSI, MACD or Bollinger Bands. It operates independently of price, not based on price but its core is volume. The volume is normal, as the instrument is sung everywhere. But the special thing here is that the Market Profile represents the volume at each price level. 1. Price Histogram The Price Histogram
TradeMirror is a trade copier EA for MT4/MT5 platform. Why TradeMirror We understand the importance of security, stability and privacy for financial software, so we've gone the extra mile to harden these three elements in detail: Provides a user-friendly graphical interface that is easy to operate Focus on privacy and security, suitable for various financial scenarios with privacy requirements for order distribution Precise replication of orders, millisecond distribution Support full platform,
This is a multi timeframe version of the  Supply and Demand indicator . It allows you to analyze a chart using the law of supply and demand on three different timeframes at a time. You will see zones of sales and purchases and determine the most profitable points to open positions. The indicator is based on the principle of market fractality. Supply and demand zones show places where a strong buyer or seller has made the price reverse and change its direction. The indicator has several types of
This indicator allows you to enjoy the two most popular products for analyzing request volumes and market deals at a favorable price: Actual Depth of Market Chart Actual Tick Footprint Volume Chart This product combines the power of both indicators and is provided as a single file. The functionality of Actual COMBO Depth of Market AND Tick Volume Chart is fully identical to the original indicators. You will enjoy the power of these two products combined into the single super-indicator! Below is
Gioteen Volatility Index (GVI) - your ultimate solution to overcoming market unpredictability and maximizing trading opportunities. This revolutionary indicator helps you in lowering your losing trades due to choppy market movements. The GVI is designed to measure market volatility, providing you with valuable insights to identify the most favorable trading prospects. Its intuitive interface consists of a dynamic red line representing the volatility index, accompanied by blue line that indicate
A "Volume Profile" is an advanced charting indicator that displays total volume traded at every price level over a user specified time period. The main components of the volume profile are POC ( Point Of Control - the price level, at which the maximum number of contracts were executed during a selected period), VAH ( Value Area High - the highest price in the Value Area) and VAL ( Value Area Low - the lowest price in the Value Area). When we settled on the original indicator, we spent a lot o
Exp COPYLOT CLIENT for MT5
Vladislav Andruschenko
3.76 (17)
MT5 için ticari kopyalayıcı, МetaТrader 5 platformu için bir ticari kopyalayıcıdır   . arasındaki   forex işlemlerini kopyalar.       COPYLOT MT5 sürümü için   herhangi bir hesap   MT5   -   MT5, MT4   -   MT5 (veya COPYLOT MT4 sürümü için   MT4 -   MT4 MT5   -  MT4) Güvenilir fotokopi makinesi! MT4 sürümü Tam tanım   +DEMO +PDF Nasıl alınır Nasıl kurulur     Günlük Dosyaları nasıl alınır?     Nasıl Test Edilir ve Optimize Edilir     Expforex'in tüm ürünleri Ayrıca МТ4 terminali   (МТ4  
Noize Absorption Index - is the manual trading system that measures the difference of pressure between bears forces and bulls forces. Green line - is a noize free index that showing curent situation. Zero value of index shows totally choppy/flat market.Values above zero level shows how powerfull bullish wave is and values below zero measures bearish forces.Up arrow appears on bearish market when it's ready to reverse, dn arrow appears on weak bullish market, as a result of reverse expectation.
Introduction to Chart Pattern MT Chart Pattern MT is a chart pattern scanner to detect the triangle pattern, falling wedge pattern, rising wedge pattern, channel pattern and so on. Chart Pattern MT uses highly sophisticated chart pattern detection algorithm. However, we have designed it in the easy to use with intuitive user interface. Chart Pattern MT will show all the patterns in your chart in the most efficient format for your trading. You do not have to do tedious manual pattern detection an
Order Book, known also as Market Book, market depth, Level 2, - is a dynamically updated table with current volumes of orders to buy and to sell specific financial instument at price levels near Bid and Ask. MetaTrader 5 provides the means for receiving market book from your broker, but in real time only, without access to its history. The indicator OrderBook Cumulative Indicator accumulates market book data online and visualizes them on the chart. In addition, the indicator can show the market
Wapv Price and volume
Eduardo Da Costa Custodio Santos
MT5 için WAPV Fiyat ve Hacim Göstergesi, (Wyckoff Academy Wave Market) ve (Wyckoff Academy Fiyat ve Hacim) araç setinin bir parçasıdır. MT5 için WAPV Fiyat ve Hacim Göstergesi, grafikteki hacim hareketini sezgisel bir şekilde görselleştirmeyi kolaylaştırmak için oluşturuldu. Bununla, piyasanın profesyonel bir ilgisinin olmadığı en yüksek hacim anlarını ve anları gözlemleyebilirsiniz. Piyasanın "akıllı para" hareketiyle değil, ataletle hareket ettiği anları belirleyin. Kullanıcı tarafından değişt
Trading Utility for Forex Currency Pairs Only not for Gold  Functions Auto Lot Calculation based on Risk Auto stoploss  Auto TakeProfit Breakeven Auto Close Half % Close in percentage with respect to the PIPs Pending Orders BuyLimit Sell Limit with distances BuyStop Sell Stop    with distances Trading Informations Risk in percentage For Multiple trades Combine Takeprofit and Combine Stoplosses
No Demand No Supply MT5
Trade The Volume Waves Single Member P.C.
No Demand No Supply   This indicator identifies   No Demand –No Supply candles  to your chart and plots volume bars colored according to the signal. It can be applied to all timeframes or to a specific one only. It can also be used as regular volume indicator  with exceptional future of WEIGHTED VOLUME. Furthermore is has an alert notification, sound and email when a signals occurs. The indicator does not repaint but the alert will come on two candles back due to the definition of No Demand No S
This indicator provides an original mix of WPR, VSA, and volume delta. It shows ratio of buy/sell volumes scaled on 100% range based on total volume change for a selected period. The convetional VSA (Volume Spread Analysis) studies interconnections of price action and volume change in absolute values, whereas WPR (Williams Percent Range) offers a convenient approach of price moves normalization into the fixed percentage metric: 0 - 100%. Hence overbough and oversold states are easily spotted. N
Bu göstergenin benzersizliği, hacim hesaplama algoritmasında yatmaktadır: birikim, günün başlangıcına bakılmaksızın doğrudan seçilen dönem için gerçekleşir. Son çubuklar hesaplamanın dışında tutulabilir, bu durumda mevcut veriler daha önce oluşturulan önemli seviyeler (hacimler) üzerinde daha az etkiye sahip olacaktır. Daha doğru bir hesaplama için varsayılan olarak M1 grafiğindeki veriler kullanılır. Fiyat hacimlerinin dağıtım adımı düzenlenir. Varsayılan olarak, ekranın sağ sınırı, analiz için
VolumeProfile MT5
Robert Hess
3.75 (8)
Description: The Volume Profile displays detailed informations of historical trading activities at certain price levels (Market Profile). Locate the areas with the best prices in the market and get an advantage over other market participants. Support: The indicator is constantly being developed and improved. Please do not hesitate to contact me via the MQL5 Platform. I am very grateful about any Bug report, so that i can constantly improve the indicator. I appreciate any public review for this
Bu ürünün alıcıları ayrıca şunları da satın alıyor
Öncelikle, bu Ticaret Sistemi'nin Non-Repainting, Non-Redrawing ve Non-Lagging Göstergesi olduğunu vurgulamak önemlidir, bu da hem manuel hem de robot ticareti için ideal hale getirir. "Smart Trend Trading System MT5", yeni ve deneyimli tüccarlar için özelleştirilmiş kapsamlı bir ticaret çözümüdür. 10'dan fazla premium göstergeyi birleştiriyor ve 7'den fazla sağlam ticaret stratejisi sunuyor, bu da çeşitli piyasa koşulları için esnek bir seçim yapar. Trend Takip Stratejisi: Trendleri etkili bir
Öncelikle belirtmek gerekir ki bu Ticaret Göstergesi Yeniden Çizim Yapmaz, Gecikmez ve Gecikme Göstermez, bu da hem manuel hem de robot ticareti için ideal hale getirir. Atom Analisti, Piyasada Daha İyi Bir Avantaj Bulmak İçin Fiyatın Gücünü ve Momentumunu Kullanan PA Fiyat Hareketi Göstergesidir. Gürültüleri ve Yanlış Sinyalleri Kaldırmaya ve Ticaret Potansiyelini Artırmaya Yardımcı Olan Gelişmiş Filtrelerle Donatılmıştır. Birden fazla katmanlı karmaşık göstergeler kullanarak, Atom Analisti
FX Volume MT5
Daniel Stein
4.94 (17)
Sabah Brifingimiz aracılığıyla ayrıntılar ve ekran görüntüleri ile günlük piyasa güncellemenizi alın burada mql5 ve on Telegram ! FX Volume, bir brokerin bakış açısından piyasa duyarlılığı hakkında GERÇEK bir fikir veren İLK ve TEK hacim göstergesidir. COT raporlarından çok daha hızlı bir şekilde, brokerlar gibi kurumsal piyasa katılımcılarının Forex piyasasında nasıl konumlandıklarına dair harika bilgiler sağlar. Bu bilgileri doğrudan grafiğinizde görmek, ticaretiniz için gerçek oyun değiştir
Quantum Trend Sniper
Bogdan Ion Puscasu
5 (37)
Tanıtım       Kuantum Trend Keskin Nişancı Göstergesi   , trend tersine dönmeleri belirleme ve ticaret yapma şeklinizi değiştiren çığır açan MQL5 Göstergesi! 13 yılı aşkın ticaret tecrübesine sahip deneyimli tüccarlardan oluşan bir ekip tarafından geliştirilmiştir.       Kuantum Trend Keskin Nişancı Göstergesi       trend dönüşlerini son derece yüksek doğrulukla belirlemenin yenilikçi yolu ile ticaret yolculuğunuzu yeni zirvelere taşımak için tasarlanmıştır. ***Kuantum Trend Keskin Nişancı Gö
Trend Screener Pro MT5
STE S.S.COMPANY
4.89 (61)
Trend Göstergesi, Trend Alım Satım ve Filtreleme için Çığır Açan Benzersiz Çözüm, Tüm Önemli Trend Özellikleriyle Tek Bir Araç İçinde Yerleştirildi! Forex, emtialar, kripto para birimleri, endeksler ve hisse senetleri gibi tüm sembollerde/araçlarda kullanılabilen %100 yeniden boyamayan çoklu zaman çerçevesi ve Çoklu para birimi göstergesidir. Trend Screener, grafikte noktalarla ok trend sinyalleri sağlayan etkili bir trend trend göstergesidir. Trend analizörü göstergesinde bulunan özellikler: 1.
FX Power MT5 NG
Daniel Stein
5 (4)
Sabah Brifingimiz burada mql5 ve on Telegram! FX Power MT5 NG , uzun zamandır çok popüler olan döviz gücü ölçerimiz FX Power'ın yeni neslidir. Peki bu yeni nesil güç ölçer ne sunuyor? Orijinal FX Power hakkında sevdiğiniz her şey PLUS GOLD/XAU güç analizi Daha da hassas hesaplama sonuçları Ayrı ayrı yapılandırılabilir analiz dönemleri Daha da iyi performans için özelleştirilebilir hesaplama limiti Özel çokluDaha fazlasını görmek isteyenler için örnek ayarlar Her grafikte en sevdiğiniz renkler i
Top indicator for MT5   providing accurate signals to enter a trade without repainting! It can be applied to any financial assets:   forex, cryptocurrencies, metals, stocks, indices .  Watch  the video  (6:22) with an example of processing only one signal that paid off the indicator! MT4 version is here It will provide pretty accurate trading signals and tell you when it's best to open a trade and close it. Most traders improve their trading results during the first trading week with the help of
Öncelikle, bu Ticaret Aracının Non-Repainting, Non-Redrawing ve Non-Lagging Gösterge olduğunu vurgulamakta fayda var, bu da onu profesyonel ticaret için ideal hale getiriyor. Akıllı Fiyat Hareketi Kavramları Göstergesi, hem yeni hem de deneyimli tüccarlar için çok güçlü bir araçtır. İleri ticaret fikirlerini, Inner Circle Trader Analizi ve Smart Money Concepts Ticaret Stratejileri gibi 20'den fazla kullanışlı göstergeyi bir araya getirerek bir araya getirir. Bu gösterge, büyük kurumların tica
RelicusRoad Pro MT5
Relicus LLC
4.82 (22)
Şimdi 147 $ (birkaç güncellemeden sonra 499 $ 'a yükseliyor) - Sınırsız Hesaplar (PC'ler veya Mac'ler) RelicusRoad Kullanım Kılavuzu + Eğitim Videoları + Özel Discord Grubuna Erişim + VIP Durumu PİYASAYA BAKMAK İÇİN YENİ BİR YOL RelicusRoad, forex, vadeli işlemler, kripto para birimleri, hisse senetleri ve endeksler için dünyanın en güçlü ticaret göstergesidir ve yatırımcılara kârlı kalmaları için ihtiyaç duydukları tüm bilgileri ve araçları sağlar. Başlangıç ​​seviyesinden ileri seviyey
Auto Order Block with break of structure based on ICT and Smart Money Concepts Futures Break of Structure ( BoS )             Order block ( OB )            Higher time frame Order block / Point of Interest ( POI )    shown on current chart           Fair value Gap ( FVG ) / Imbalance   ,  MTF      ( Multi Time Frame )    Volume Imbalance     ,  MTF          vIMB Gap’s Equal High / Low’s     ,  MTF             EQH / EQL Liquidity               Current Day High / Low           HOD /
XQ Indicator MetaTrader 5
Marzena Maria Szmit
5 (1)
Step into the realm of Forex trading with confidence and precision using XQ, a cutting-edge Forex indicator designed to elevate your trading game to unprecedented heights. Whether you're a seasoned trader or just stepping into the world of currency exchange, XQ Forex Indicator empowers you with the insights and signals needed to make informed trading decisions. The signal conditions are a combination of three indicators, and XQ Forex Indicator only display  medium and long-term trends . The ind
Advanced Supply Demand MT5
Bernhard Schweigert
4.53 (15)
Herhangi bir Acemi veya Uzman Tüccar için En İyi Çözüm! Bu gösterge benzersiz, yüksek kaliteli ve uygun fiyatlı bir ticaret aracıdır çünkü bir dizi tescilli özelliği ve yeni bir formülü bir araya getirdik. Bu güncelleme ile çift zaman dilimi dilimlerini gösterebileceksiniz. Yalnızca daha yüksek bir TF gösteremeyeceksiniz, aynı zamanda TF grafiğini ve ARTIK daha yüksek TF'yi de gösterebileceksiniz: YUVARLAK BÖLGELERİ GÖSTERMEK. Tüm Arz Talebi tüccarları buna bayılacak. :) Önemli Bilgiler Açıkland
AW Trend Predictor MT5
AW Trading Software Limited
4.76 (54)
Tek bir sistemde trend ve kırılma seviyelerinin kombinasyonu. Gelişmiş bir gösterge algoritması piyasa gürültüsünü filtreler, trendi, giriş noktalarını ve olası çıkış seviyelerini belirler. Gösterge sinyalleri, sinyal geçmişinin etkinliğini gösteren en uygun enstrümanların seçilmesine izin veren bir istatistiksel modüle kaydedilir. Gösterge Kâr Al ve Zararı Durdur işaretlerini hesaplar. Kılavuz ve talimatlar ->   BURAYA   / MT4 versiyonu ->   BURAYA Gösterge ile nasıl ticaret yapılır: Trend Pre
ICT, SMC, SMART MONEY CONCEPTS, SMART MONEY, Smart Money Concept, Support and Resistance, Trend Analysis, Price Action, Market Structure, Order Blocks, BOS/CHoCH,   Breaker Blocks ,  Momentum Shift,   Supply&Demand Zone/Order Blocks , Strong Imbalance,   HH/LL/HL/LH,    Fair Value Gap, FVG,  Premium  &   Discount   Zones, Fibonacci Retracement, OTE, Buy Side Liquidity, Sell Side Liquidity, BSL/SSL Taken, Equal Highs & Lows, MTF Dashboard, Multiple Time Frame, BigBar, HTF OB, HTF Market Structure
TPSpro TRENDPRO  - is a trend indicator that automatically analyzes the market and provides information about the trend and each of its changes, as well as giving signals for entering trades without redrawing! The indicator uses each candle, analyzing them separately. referring to different impulses - up or down impulse. Exact entry points into transactions for currencies, crypto, metals, stocks, indices!  -  Version MT4                  DETAILED DESCRIPTION        /       TRADING SETUPS       
Gann Kare Göstergesi, W.D. Gann tarafından yazılan "Piyasa Tahminleri için Matematiksel Formül" makalesine dayalı güçlü bir piyasa analizi aracıdır. Bu araç, piyasa analizi için matematiksel ve Gann teorilerini kullanarak hassas analizler gerçekleştirir. 144, 90, 52 karelerini ve ayrıca 9 karesini kullanır. Ayrıca, ın 9 karesi ve bu kareyle ilişkili kanallar ve yıldız modelleri için yöntemini içerir. Kullanıcı Kılavuzu ve Uygulama: Bu göstergeleri kullanmadan önce, kullanıcı kılavuzunu okumanız
Fiyat tersine döndükçe ve geri çekildikçe piyasa yapısından elde edilen kâr değişir. Piyasa yapısını tersine çevirme uyarısı göstergesi, bir trendin veya fiyat hareketinin ne zaman tükenmeye yaklaştığını ve tersine dönmeye hazır olduğunu tanımlar. Genellikle bir geri dönüş veya büyük bir geri çekilme meydana gelmek üzereyken meydana gelen piyasa yapısındaki değişiklikler konusunda sizi uyarır. Gösterge, olası bir tükenme noktasının yakınında her yeni yüksek veya düşük oluştuğunda, başlangıçta
Grafiğinizde otomatik olarak destek ve direnç seviyeleri PLUS itici mum boşlukları çizin, böylece fiyatın nereye gidebileceğini ve / veya potansiyel olarak tersine dönebileceğini görebilirsiniz. Bu gösterge, web sitemde (The Market Structure Trader) öğretilen pozisyon ticareti metodolojisinin bir parçası olarak kullanılmak üzere tasarlanmıştır ve hedefleme ve potansiyel girişler için temel bilgileri görüntüler. MT4 Version:  https://www.mql5.com/en/market/product/97246/ Göstergede 2 TEMEL öze
A key element in trading is zones or levels from which decisions to buy or sell a trading instrument are made. Despite attempts by major players to conceal their presence in the market, they inevitably leave traces. Our task was to learn how to identify these traces and interpret them correctly. Reversal First Impulse levels (RFI)   -  Version MT4                  INSTRUCTIONS                 RUS                 ENG                         R ecommended to use with an indicator   -  TREND PRO  
Tanıtım       Quantum Breakout PRO   , Breakout Bölgeleri ile ticaret yapma şeklinizi değiştiren çığır açan MQL5 Göstergesi! 13 yılı aşkın ticaret tecrübesine sahip deneyimli tüccarlardan oluşan bir ekip tarafından geliştirilmiştir.       Kuantum Breakout PRO       yenilikçi ve dinamik koparma bölgesi stratejisiyle ticaret yolculuğunuzu yeni zirvelere taşımak için tasarlanmıştır. Kuantum Breakout Göstergesi, size 5 kar hedefi bölgesi ile kırılma bölgelerinde sinyal okları ve kırılma kutusuna
Owl Smart Levels MT5
Sergey Ermolov
4.47 (36)
MT4 versiyonu  |  FAQ Owl Smart Levels Indicator , Bill Williams'ın gelişmiş fraktalları , piyasanın doğru dalga yapısını oluşturan Valable ZigZag ve kesin giriş seviyelerini gösteren Fibonacci seviyeleri gibi popüler piyasa analiz araçlarını içeren tek gösterge içinde eksiksiz bir ticaret sistemidir. pazara ve kar elde edilecek yerlere. Stratejinin ayrıntılı açıklaması Gösterge ile çalışma talimatı Baykuş Yardımcısı ticaretinde Danışman Yardımcısı Kullanıcıların özel sohbeti -> Satın aldıktan
TrendLine PRO MT5
Evgenii Aksenov
4.78 (49)
The Trend Line PRO indicator is an independent trading strategy. It shows the trend change, the entry point to the transaction, as well as automatically calculates three levels of Take Profit and Stop Loss protection Trend Line PRO is perfect for all Meta Trader symbols: currencies, metals, cryptocurrencies, stocks and indices Advantages of Trend Line PRO Never redraws its signals The possibility of using it as an independent strategy It has three automatic levels Take Profit and Stop Loss lev
Gartley Hunter Multi
Siarhei Vashchylka
5 (5)
Gartley Hunter Multi - An indicator for searching for harmonic patterns simultaneously on dozens of trading instruments and on all classic timeframes: (m1, m5, m15, m30, H1, H4, D1, Wk, Mn). Manual (Be sure to read before purchasing) | Version for MT4 Advantages 1. Patterns: Gartley, Butterfly, Shark, Crab. Bat, Alternate Bat, Deep Crab, Cypher 2. Simultaneous search for patterns on dozens of trading instruments and on all classic timeframes 3. Search for patterns of all possible sizes. Fr
Trend Line Map Pro MT5
STE S.S.COMPANY
4.67 (9)
Trend Line Map indicator is an addons for   Trend Screener Indicator . It's working as a scanner for all signals generated by Trend screener ( Trend Line Signals ) . It's a Trend Line Scanner based on Trend Screener Indicator.  If you don't have Trend Screener Pro Indicator,   the Trend Line Map Pro will not work.     LIMITED TIME OFFER : Trend Line Map Indicator is available for only 50 $ and lifetime. ( Original price 125$ ) By accessing to our MQL5 Blog,  you can find all our premium indica
TrendDecoder Premium MT5
Christophe, Pa Trouillas
5 (1)
Aralıkları ve bir sonraki olası hamleleri belirleyin     |    Trendlerin en erken sinyallerini ve gücünü alın     |    Geri dönüşten önce net çıkışlar alın     |    Fiyatın test edeceği Fibo seviyelerini tespit edin   |  Gecikmesiz, takip edilmeyen gösterge - manuel ve otomatik ticaret için ideal - tüm varlıklar ve tüm zaman birimleri için uygun 50 İNDİRİM   - lansman için sonra tekrar   >>   149 $ Satın aldıktan sonra, kişiselleştirilmiş ayarlar için   bu kanaldan benimle iletişime geçin . MT4
MetaBands M5
Vahidreza Heidar Gholami
4.67 (3)
MetaBands uses powerful and unique algorithms to draw channels and detect trends so that it can provide traders with potential points for entering and exiting trades. It’s a channel indicator plus a powerful trend indicator. It includes different types of channels which can be merged to create new channels simply by using the input parameters. MetaBands uses all types of alerts to notify users about market events. Features Supports most of the channel algorithms Powerful trend detection algorith
TPA True Price Action indicator reveals the true price action of the market makers through 100% non-repainting signals strictly at the close of a candle! TPA shows entries and re-entries, every time the bulls are definitely stronger than the bears and vice versa. Not to confuse with red/green candles. The shift of power gets confirmed at the earliest stage and is ONE exit strategy of several. There are available now two free parts of the TPA User Guide for our customers. The first "The Basics"
IX Power MT5
Daniel Stein
5 (2)
IX Power   nihayet FX Power'ın rakipsiz hassasiyetini Forex dışı sembollere getiriyor. En sevdiğiniz endeksler, hisse senetleri, emtialar, ETF'ler ve hatta kripto para birimlerindeki kısa, orta ve uzun vadeli eğilimlerin yoğunluğunu doğru bir şekilde belirler. Terminalinizin sunduğu   her şeyi analiz   edebilirsiniz. Deneyin ve işlem yaparken   zamanlamanızın   nasıl   önemli ölçüde iyileştiğini   deneyimleyin. IX Power Temel Özellikler 100 hassas, yeniden boyanmayan hesaplama sonuçları -
Golden Gate Algo MT5
James David Lane
4 (6)
CHRISTMAS İÇİN %40 İNDİRİM! 1 OCAK'TA FİYATI $250'YE YÜKSELECEK! GoldenGate Entries Tanıtımı: Keskin Kenarlı Bir Ticaret Çözümü! GoldenGate Entries (GGE) ile ticarette devrim niteliğinde bir yaklaşım keşfedin. GGE, ticaret deneyiminizi yükseltmek amacıyla tasarlanmış gelişmiş bir gösterge olup kullanıcılara ticaret kararlarında hassasiyet ve güven sağlamak için kapsamlı bir özellik seti sunar. Çiftler: Herhangi biri (FX - Emtia - Hisse Senetleri - Hisse Senetleri - Kripto) Zaman Çerçeve
ICT Silver Bullet MT5
Haidar, Lionel Haj Ali
5 (19)
ICT Silver Bullet If you are searching for a reliable indicator to trade the ICT Silver Bullet concept, or ICT concepts, Smart Money Concepts, or SMC, this indicator will respond to your need!  Before version 2.2, this indicator was focused only on ICT Silver Bullet, but moving forward, we will include the different elements for smart money concept trading. This indicator will help you identify the following: FVG - fair value gaps Market structure: BOS and CHOCH. It is based on ZIGZAG as it is
Yazarın diğer ürünleri
Volume Profile For MT5
Abdelkhabir Yassine Alaoui
Volume Profile is a very useful indicator . it allows you to spot the price levels where important price action took place. It is similar to support and resistance levels but with a different logic. One of the first thing that traders mark up when analyzing a chart is support and resistance. Volume Profile can be used for doing that too. The indicator scans the defined number of previous bars and calculates the volume of activity at each price level. You can set the indicator to display t
FREE
Support And Resistance indicator that can display round levels and zones . It shows them directly on the chart, providing an easy help when you want to set stop-loss or take-profit level, or when you want to see the next market target.   If an asset price is moving down and bounces back up, the level is called support (think: price floor). If an asset price is moving upward and hits a level where it reverses downward, this is called resistance (think: price ceiling).
FREE
Spread Actual
Abdelkhabir Yassine Alaoui
5 (2)
This indicator Displays current spread in the main window of the chart. You can modify the font parameters, indicator's position and the normalization of the spread value. The spread is redrawn after each tick, ensuring the most current and active spread value. This can be useful for brokers with variable spreads or with spreads that are widened often. You can also enable a spread label to be shown near the current Bid line. you can also set  alert : Email, and push notifications.
FREE
DXY Correlation
Abdelkhabir Yassine Alaoui
4 (1)
Indicator  can be used for dxy correlation trading. it calculates the dollar index (USDX or DXY) using the EUR/USD, USD/JPY, GBP/USD, USD/CAD, USD/CHF and USD/SEK currency pairs. In order to trade them, you need to find a confirmed technical analysis pattern on the DXY chart and look for a correlated currency pair that has the same picture on its price chart. The formula used for calculation is the following: USDX = 50.14348112 × EURUSD -0.576   × USDJPY 0.136   × GBPUSD -0.119   × USDCAD 0.09
FREE
Basing Candles
Abdelkhabir Yassine Alaoui
Basing Candles indicator is an automatic indicator that detects and marks basing candles on the chart. A basing candle is a candle with body length less than 50% of its high-low range. A basing candle or basing candlestick is a trading indicator whose body length is less than half of its range between the highs and lows. That's less than 50% of its range. The indicator highlights the basing candles using custom candles directly in the main chart of the platform. The percentage criterion can be
FREE
Usdjpy Hunter
Abdelkhabir Yassine Alaoui
This is a classic trading strategy based on two Moving Averages crossover. customized for usdjpy with a Good risk management strategy RR 1/2 . (    Long when fast MA crosses slow MA from below and Short when fast MA crosses slow MA from above ) TF : 5MIN MAX Lot size to use : 2% e.g : Balance =100 => lot size = 0.02 Balance =1000 => lot size = 0.20 Balance =10000 => lot size = 2 ------
FREE
Seconds Timeframes Chart MT5
Abdelkhabir Yassine Alaoui
Seconds Chart For MetaTrader 5 The Indicators allows you to create charts in the MetaTrader 5 terminal with a timeframe in seconds. The timeframe on such a chart is set in seconds, not in minutes or hours. Thus, you can create charts with a timeframe less than M1. For example, S15 is a timeframe with a period of 15 seconds. You can apply indicators, Expert Advisors and scripts to the resulting chart. You get a fully functional chart on which you can work just as well as on a regular chart. The t
FREE
Best Pivot Point Indicator  display   pivot points   and   support and resistance   lines for the intraday trading. It calculates them using its own formula based on the previous trading session The indicator can display the following levels in addition to plain pivot points: Previous session's High and Low, today's Open. Sweet spots. Fibonacci levels. Camarilla pivots. Midpoint pivots.
Filtrele:
Anton du
23
Anton du 2024.03.27 18:52 
 

it xdoes not work and there is no contact

Abdelkhabir Yassine Alaoui
2149
Geliştiriciden yanıt Abdelkhabir Yassine Alaoui 2024.04.01 13:54
it work , you just you don't know how to use it ( Certain brokers don't provide volume data . this indicator won't work if there no volume data provided from the broker server )
fred6531
14
fred6531 2023.04.27 11:18 
 

Kullanıcı incelemeye herhangi bir yorum bırakmadı

Sarah
25
Sarah 2023.04.27 10:33 
 

Kullanıcı incelemeye herhangi bir yorum bırakmadı

İncelemeye yanıt
Sürüm 1.2 2024.04.01
Fixed Range Selection Tool