Heikin Ashi Dashboard
- Göstergeler
- Taras Slobodyanik
- Sürüm: 2.40
- Güncellendi: 14 Mart 2024
- Etkinleştirmeler: 10
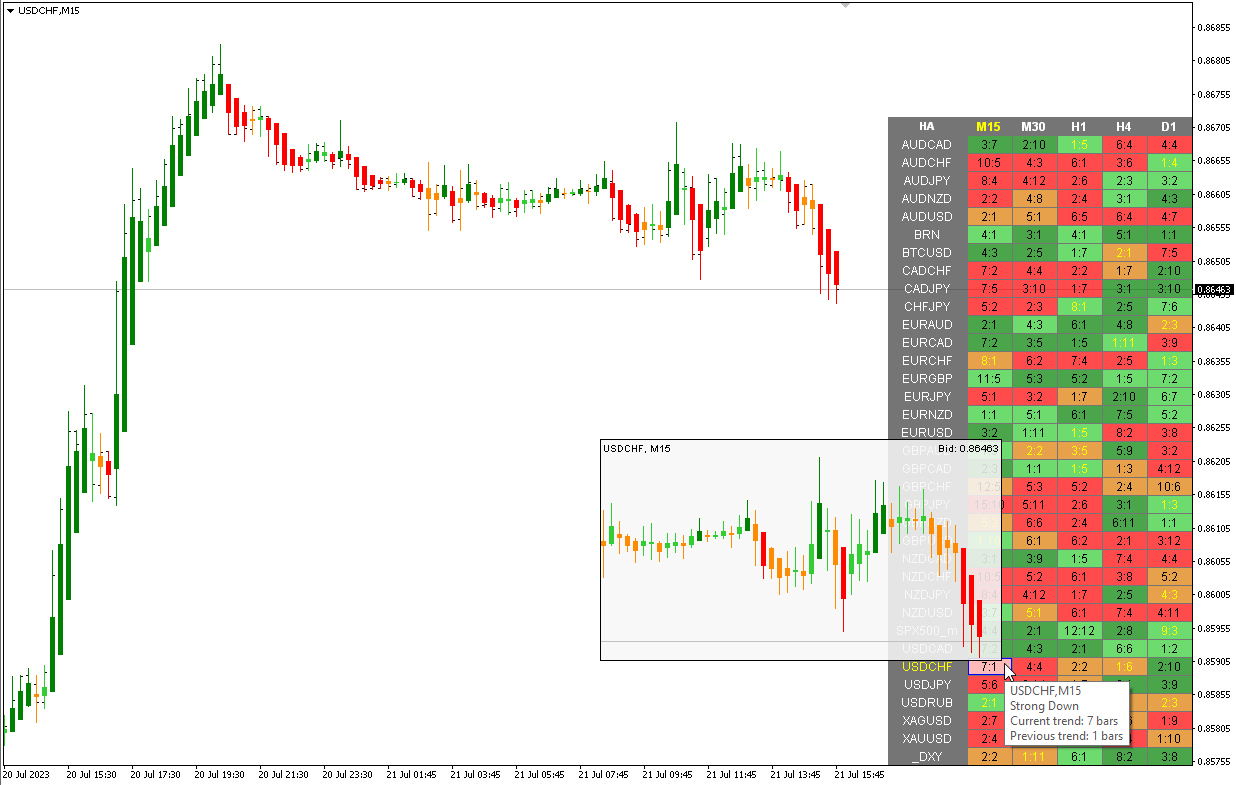
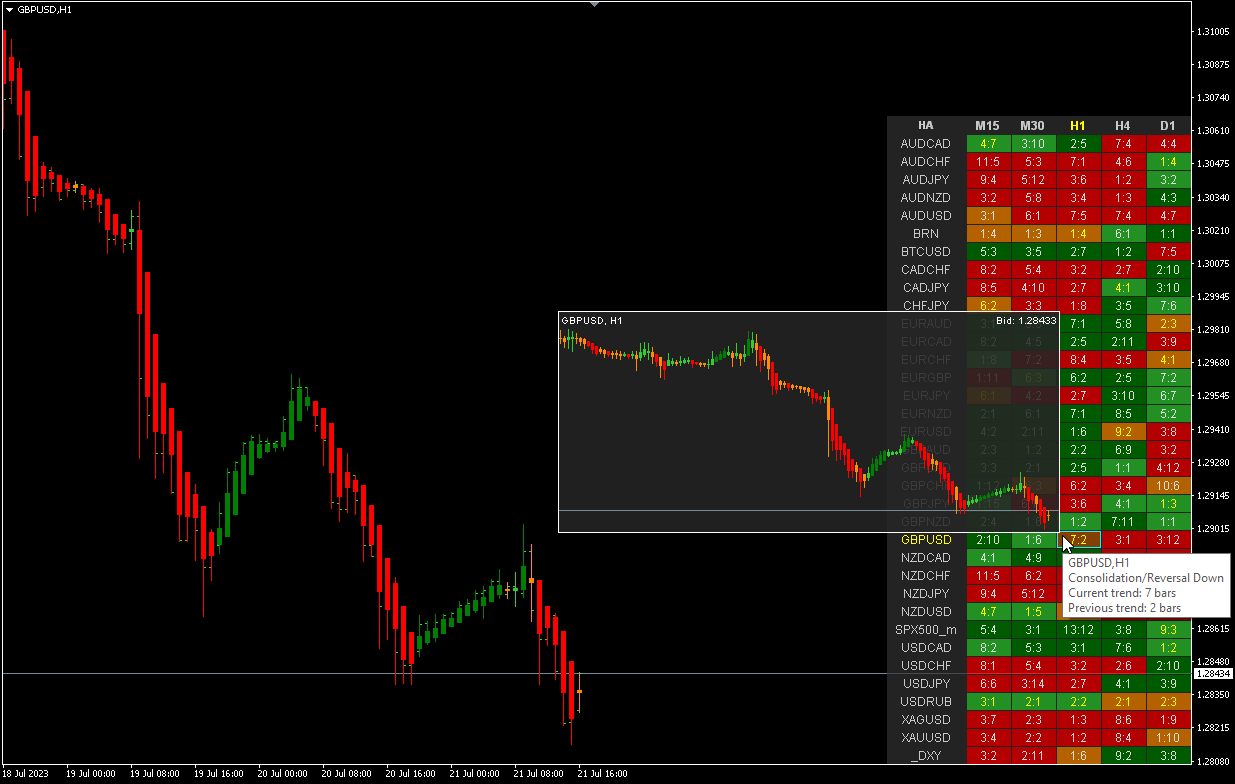
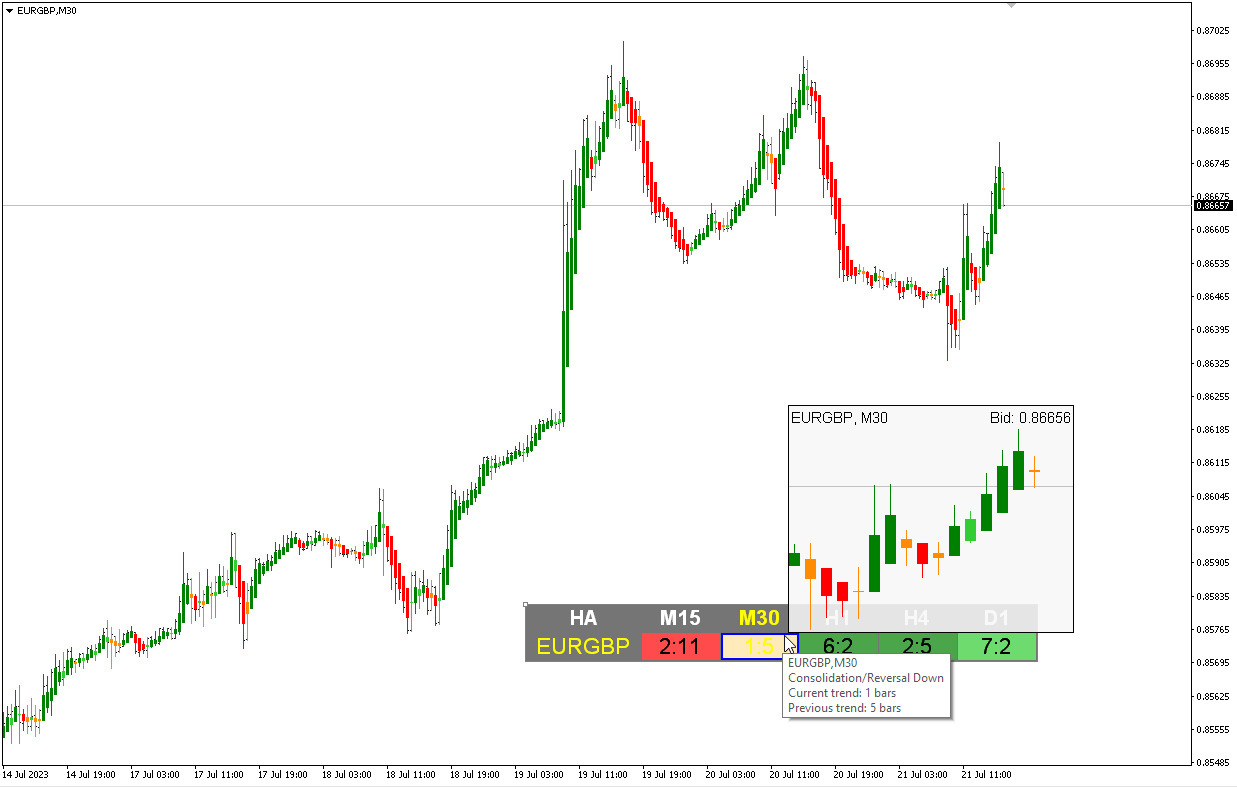
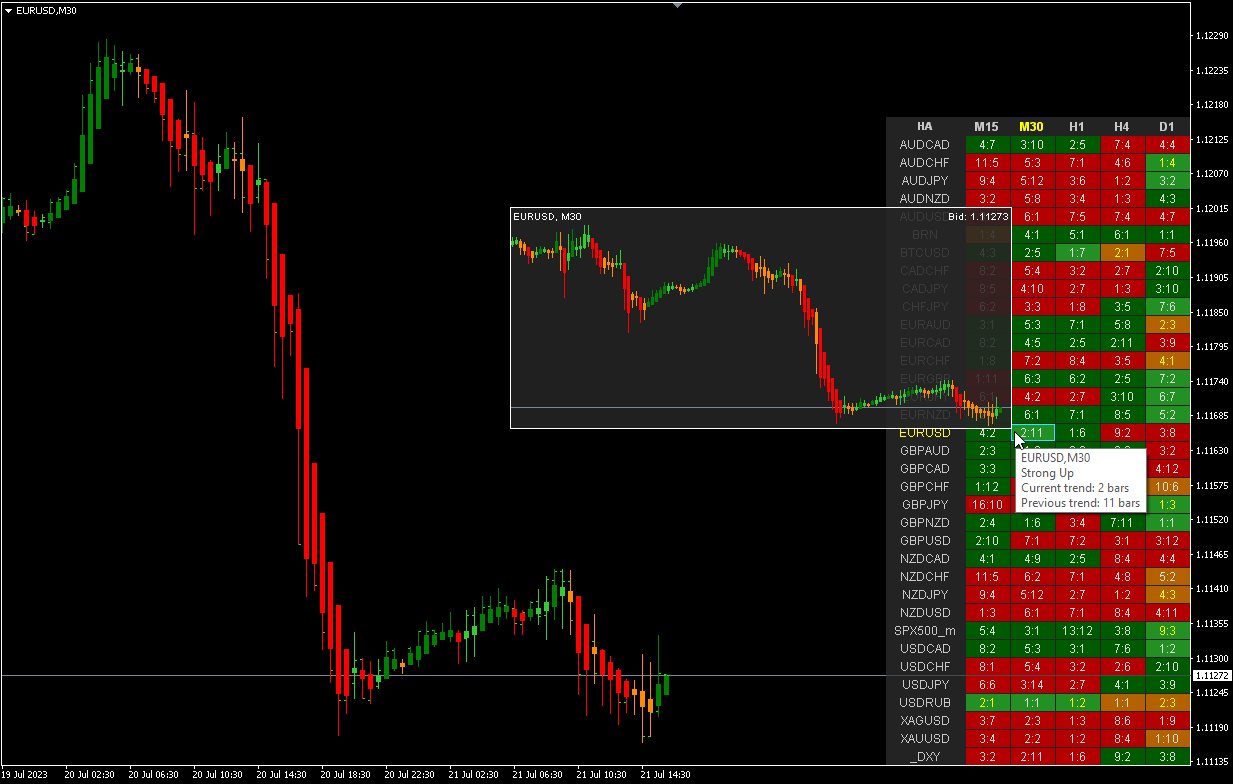
Çoklu para birimi ve çoklu zaman çerçeveli Heikin Ashi göstergesi. Piyasanın mevcut durumunu gösterir. Tarayıcı panelinde mevcut trendin yönünü, gücünü ve çubuk sayısını görebilirsiniz. Konsolidasyon/Tersine Dönme mumları da renk kullanılarak gösterilir. Parametrelerde istediğiniz para birimini ve periyodu belirtebilirsiniz. Ayrıca gösterge, trend değiştiğinde veya tersine dönüş ve konsolidasyon mumları (dojiler) göründüğünde bildirim gönderebilir. Bir hücreye tıkladığınızda bu simge ve nokta açılacaktır. Bu MTF Tarayıcıdır.
Heikin-Ashi, "ortalama hız" anlamına gelen bir Japon ticaret göstergesi ve finansal tablosudur. Heikin-Ashi grafikleri mum grafiklerine benzer ancak mum çubuklarında olduğu gibi her fiyat hareketini takip etmek yerine çeşitli fiyat hareketlerini takip ettikleri için daha düzgün bir görünüme sahiptirler. Heikin-Ashi, 1700'lü yıllarda mum grafiğini de yaratan Munehisa Homma tarafından yaratıldı. Bu grafikler tüccarlar ve yatırımcılar tarafından fiyat hareketlerini belirlemeye ve tahmin etmeye yardımcı olmak için kullanılır.
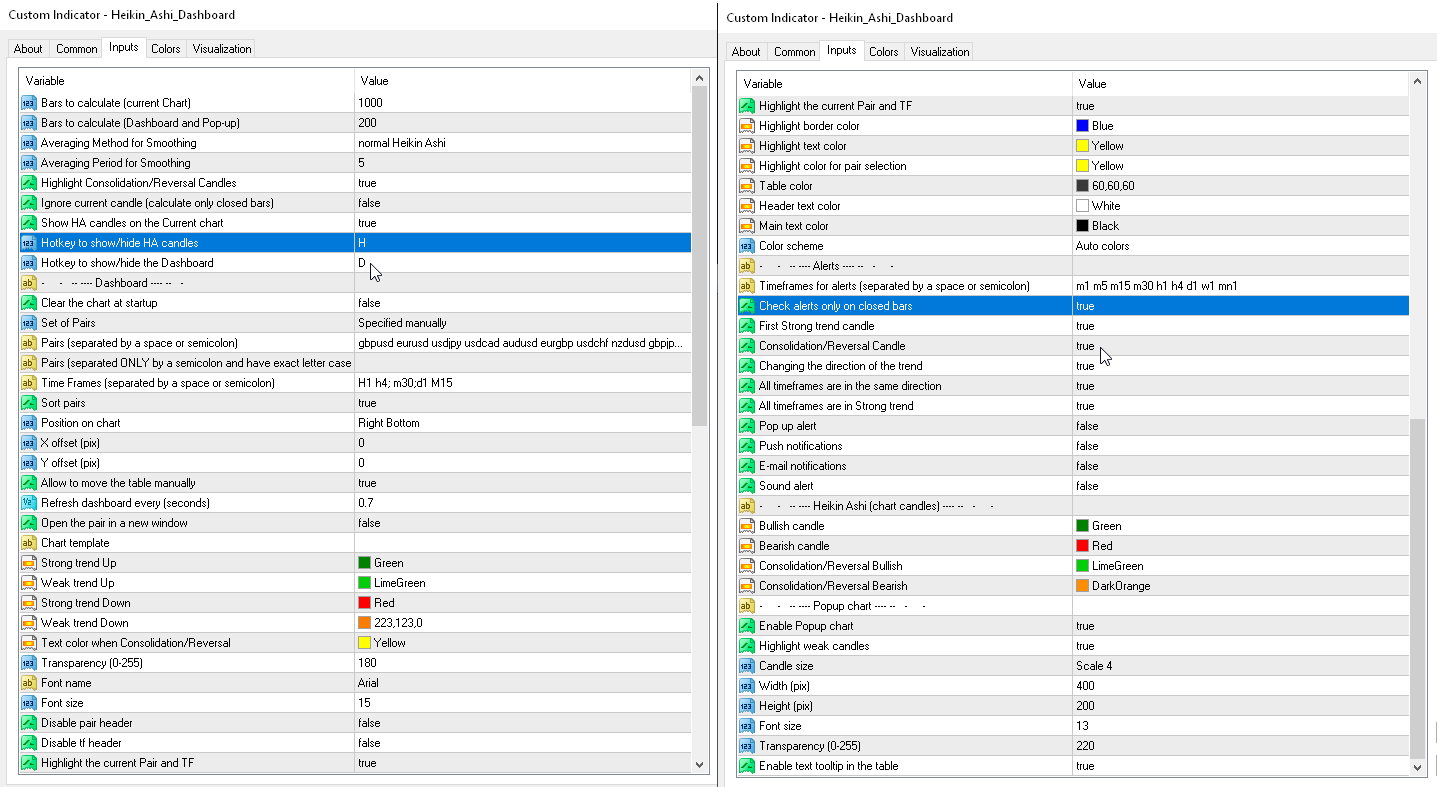
Parametreler
- Averaging Method for Smoothing — mum fiyatlarını yumuşatmak için bir yöntemin seçimi.
— Simple MA — Basit MA
— Exponential MA — Üstel MA
— Smoothed MA — Düzleştirilmiş MA
— Linear weighted MA — Doğrusal ağırlıklı MA
— normal Heikin Ashi — normal Heikin Ashi
- Averaging Period for Smoothing — yumuşatma süresinin seçimi.
- Ignore current candle (calculate only closed bars) — mevcut (kapalı olmayan) mumun görüntülenmesini devre dışı bırakın.
- Show HA candles on the current chart — Heiken Ashi mumları mevcut grafikte çizilecek.
- Show Consolidation/Reversal Candles (Doji) — Konsolidasyon/Tersine Dönme Mumlarını (Doji) gösterin.
- Doji. Body length to the Candle length ratio, % (body<=%) — parametre, mum gövdesinin boyutunu tüm mumun boyutuna göre yüzde olarak ayarlar. Vücut bu yüzdeye göre <= olmalıdır.
- Doji. Wick length to the Candle length ratio, % (each wick>=%) — parametre, tüm mumun boyutuna göre üst ve alt fitillerin boyutunu yüzde olarak ayarlar. Her fitilin bu yüzdeye göre >= olması gerekir.
- Hotkey to show/hide HA candles — HA mumlarını göstermek/gizlemek için kısayol tuşu.
- Hotkey to show/hide the Dashboard — Kontrol Panelini göstermek/gizlemek için kısayol tuşu.
Gösterge Paneli
Clear the chart at startup — başlangıçta grafiği temizleyin.
Set of Pairs — semboller kümesi
— Market Watch — "Piyasa İzlemesi"nden eşlemeler.— Specified manually — "Çiftler" parametrelerinde manüel olarak belirtilen çiftler.— Current pair — yalnızca geçerli çifti gösterir.
Pairs (separated by a space or semicolon) — boşluk veya noktalı virgülle ayrılmış sembollerin listesi. Para birimi adları, büyük/küçük harf ve önek/sonek korunarak tam olarak komisyoncununki gibi yazılmalıdır.
Time Frames (separated by a space or semicolon) — boşluk veya noktalı virgülle ayrılmış zaman dilimlerinin listesi (çoklu zaman dilimi).
Sort pairs — çiftlerin listesini sıralama.
Position on chart — panelin grafikte görüntüleneceği köşe.
X offset (pix) — paneli X ekseni boyunca kaydırın;
Y offset (pix) — paneli Y ekseni boyunca kaydırın;
Refresh dashboard every (seconds) — tüm çiftler ve zaman dilimleri için güncelleme süresi.
Open the pair in a new window — tıklayarak yeni bir grafik penceresinde bir sembol açın.
Chart template — grafik yeni bir pencerede açılırsa, grafiğin şablonunun adı.
Strong trend Up — Güçlü bir yükseliş trendinin rengi.
Weak trend Up — zayıf bir yükseliş trendinin rengi.
Strong trend Down — güçlü bir düşüş trendinin rengi.
Weak trend Down — zayıf bir düşüş trendinin rengi.
Text color when Consolidation/Reversal — konsolidasyon/geri dönüş çubukları için rengi (ve grafikteki mumları) vurgulayın.
Transparency (0-255) — Şeffaflık (0-255).
Font name — Yazı tipi adı.
Font size — Yazı Boyutu.
Uyarılar
Timeframes for alerts (separated by a space or semicolon) — Uyarılara ilişkin zaman dilimleri (boşluk veya noktalı virgülle ayrılmış).
Check alerts only when the candle is closed — Uyarıları yalnızca mum kapalıyken kontrol edin.
First Strong trend candle — ilk güçlü trend mumu için uyarı.
Consolidation/Reversal Candle — bir konsolidasyon/geri dönüş mumu göründüğünde uyarı verir.
Changing the direction of the trend — trendin yönü değiştiğinde verilen bir uyarı.
All timeframes are in Strong trend — Bu uyarılar, kontrol panelindeki minimum zaman aralığına göre çubuk başına bir kez gönderilir. "Uyarıların zaman dilimleri" parametresine bakmazlar.
All timeframes are in the same direction — Bu uyarılar, kontrol panelindeki minimum zaman dilimine göre çubuk başına bir kez gönderilir. "Uyarıların zaman dilimleri" parametresine bakmazlar.
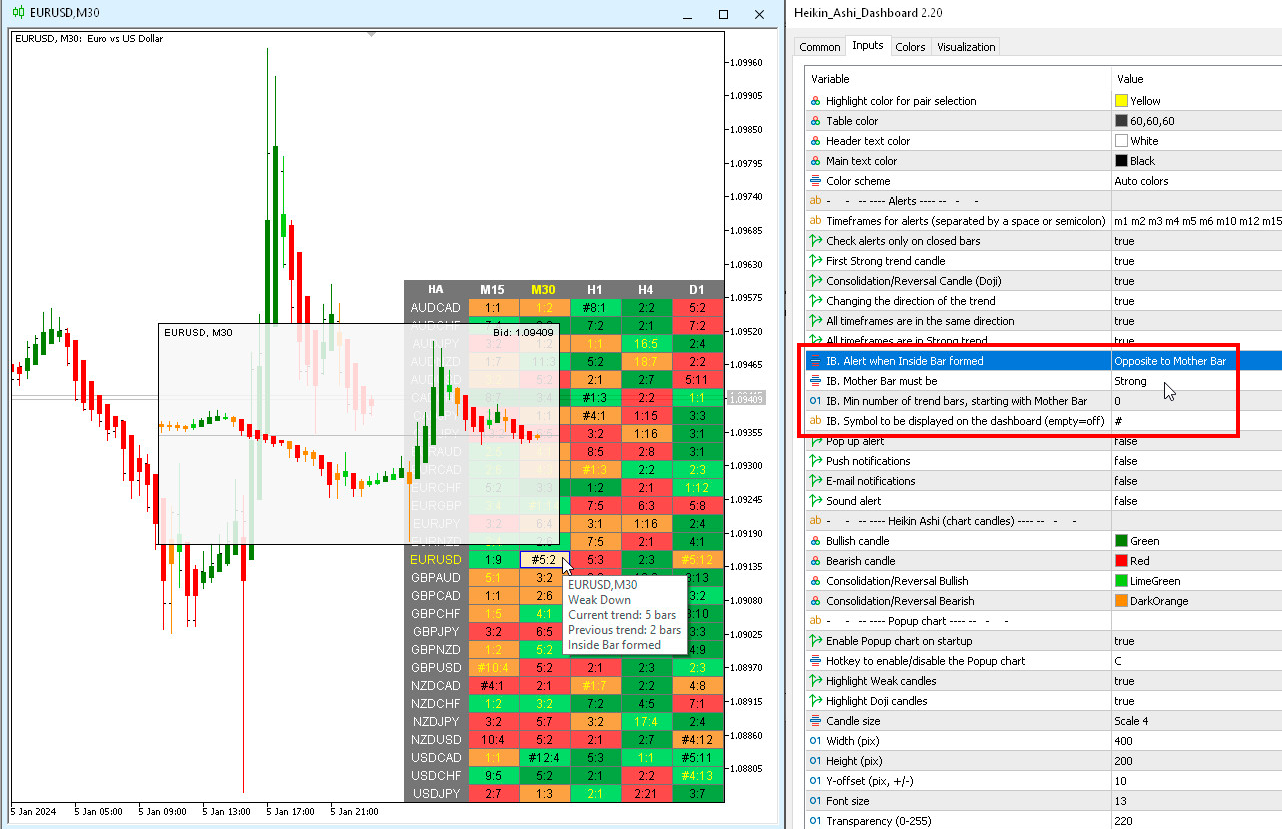
IB. Alert when Inside Bar formed — IB. Inside Bar oluştuğunda uyarı verin.
IB. Mother Bar must be — IB. Mother Bar olmalı.
IB. Min number of trend bars, starting with Mother Bar — IB. Mother Bar'dan başlayarak minimum sayıda trend çubuğu.
IB. Symbol to be displayed on the dashboard (empty=off) — IB. Kontrol panelinde görüntülenecek sembol (boş=kapalı).


Ich habe den Dashboard am Mittwoch gekauft und Nachmittag wenn die Amis eröffnen auspropiert, muss schon sagen alle Achtung ,habs auf dem Demokonto 2 Tage getestet , hat sehr gute Ergebnisse. Am Freitag Morgen bin ich dann auf dem Realkonto mit 3Trades jeweils im Tageschart eingestiegen und alle 3waren im Gewinn. Super ich bin beeindruckt.