• Genel bakış
  • İncelemeler (2)
  • Yorumlar
  • Yenilikler

Real Spinning Top Candlestick

5
Gerçek Dönen Top Göstergesi

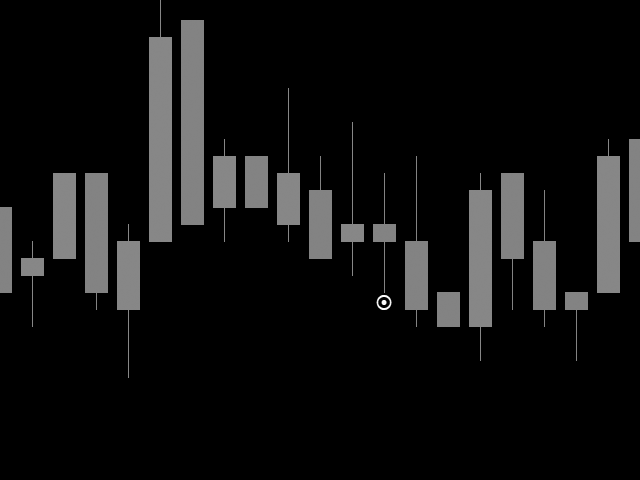
Dönen topaçın gerçek anlamı olan dengeli gövde ve fitil yükseklik oranı ile grafik üzerinde doğru topacı algılar ve onu Hammers and Doji veya Null Candlestick'ten ayırır.

Bu gösterge, grafikte bulunan topaç sayısına bir kanat simgesi çizer.

Ayarlar şunları içerir:

Çubuk Sayısı : Aramayı çubuk sayısına göre ayarlamak için

Simgenin Rengi: simgenin rengini değiştir

Simge kodu: simge için kanatların kodunu değiştirin
İncelemeler 2
Passakon Ekaburudkul
254
Passakon Ekaburudkul 2024.01.08 11:44 
 

I really like it when use in H1 or over.

Peter Pedro
68
Peter Pedro 2023.04.08 14:50 
 

super

Önerilen ürünler
True Volatility
Cristian Eriksson
5 (1)
ATR is an excellent indicator to visualize if volatility is increasing or decreasing. But what if you want to compare the volatility to another pair or instrument? Since each pair with different quote currency has different pip value, the output of the ATR doesn't really say that much. Comparing pairs to other instruments is even harder.  What you as a trader care about is how much the pair has moved up or down in percentage, therefore normalizing ATR to percent would make things much easier.  T
FREE
Value Chart Candlesticks
Flavio Javier Jarabeck
4.67 (9)
The idea of a Value Chart indicator was presented in the very good book I read back in 2020 , " Dynamic Trading Indicators: Winning with Value Charts and Price Action Profile ", from the authors Mark Helweg and David Stendahl. The idea is simple and the result is pure genius: Present candlestick Price analysis in a detrended way! HOW TO READ THIS INDICATOR Look for Overbought and Oversold levels. Of course, you will need to test the settings a lot to find the "correct" one for your approach.
FREE
SSACD - Singular Spectrum Average Convergence/Divergence This is an analogue of the MACD indicator based on the Caterpillar-SSA ( Singular Spectrum Analysis ) method. Limited version of the SSACD Forecast indicator. Limitations include the set of parameters and their range. Specificity of the method The Caterpillar-SSA is an effective method to handle non-stationary time series with unknown internal structure. The method allows to find the previously unknown periodicities of the series and mak
FREE
A professional tool for trading - the divergence indicator between the  Stochastic and the price, which allows you to receive a signal about a trend reversal in a timely manner or catch price pullback movements (depending on the settings). The indicator settings allow you to adjust the strength of the divergence due to the angle of the  Stochastic peaks and the percentage change in price, which makes it possible to fine-tune the signal strength. The indicator code is optimized and is tested ver
FREE
Zona de Consolidacao
Edilson Domingos
5 (1)
It makes it easier to see where there have been consolidation zones for previous prices and allows you to highlight the histogram where there is the biggest consolidation zone. Input parameters Intervalo de preço Is the price between the histograms Periodo Number of candle sticks to be analyzed Porcentagem Highlights the histogram where there is minimal consolidation in relation to the analyzed period
FREE
Multi-timeframe trend indicator, based on the ADX / ADXWilder indicator The indicator shows trend areas using ADX or ADXWilder indicator data from multiple timeframes. The impulse mode of the indicator allows you to catch the beginning of a trend, and several "Screens" with different timeframes allow you to filter out market noise. How the indicator works: if PDI is greater than NDI, then it`s bullish movement; if PDI is less than NDI, then it`s bearish movement; to determine any trend, it
FREE
VWAP Indicator
LUC JACOBUS A VERHEECKE
4.19 (21)
Volume Weighted Average Price (VWAP) The volume weighted average price (VWAP) is a   trading   benchmark   used by traders that gives the average price a security has traded at throughout the day, based on both volume and price. It is important because it provides traders with insight into both the trend and value of a security. This indicator VWAP V2 is free and is the manual version of the extended Easy VWAP indicator (30 Euro), where the date and time properties are automatically entered. Wit
FREE
Weis Waves
Flavio Javier Jarabeck
3.15 (26)
The original author is David Weis, an expert in the Wyckoff Method. The Weis Wave is a modern adaptation of the 1930's Wyckoff Method, another expert in Tape Reading techniques and Chart Analysis. Weis Waves takes market volume and stacks it into waves according to price conditions giving the trader valuable insights about the market conditions. If you want to learn more about this subject you can find tons of videos in YouTube. Just look for "The Wickoff Method", "Weis Wave" and "Volume Spread
FREE
White Weis Volume Ticks
Ricardo Almeida Branco
5 (3)
White Weis Volume This indicator shows the sum of the volume in each wave, bulish or bearish, as idealized by David Weis , but it brings an important addition , which is the marking of the bar with the highest volume of the wave (White Bar)! In coding the indicator, it was sought to optimize the code to require minimal processing during use and not to overload mt5. The indicator can be used for pre-trading analysis and study, where the trader analyzes possible points of support and resi
Follow The Line MT5
Oliver Gideon Amofa Appiah
4.4 (30)
This indicator obeys the popular maxim that: "THE TREND IS YOUR FRIEND" It paints a GREEN line for BUY and also paints a RED line for SELL. (you can change the colors). It gives alarms and alerts of all kinds. IT DOES NOT REPAINT and can be used for all currency pairs and timeframes. Yes, as easy and simple as that. Even a newbie can use it to make great and reliable trades. NB: For best results, get my other premium indicators for more powerful and reliable signals. Get them here: https://www.m
FREE
Supports And Resistances Lines
Francisco Gomes Da Silva
4.78 (40)
Destek ve Direnç bölgeleri Göstergesi MT5 bu gösterge, tepeleri ve dipleri otomatik olarak nasıl belirleyeceğini bilir. Bu destek ve direnç göstergesi, üst ve alt noktalara göre destek çizgileri ve direnç çizgileri oluşturur. destek ve direnç çizgileri nasıl yapılır? Bu, otomatik destek ve direnç çizgileri oluşturmanın bir göstergesidir. gösterge ile destek seviyesi nasıl bulunur? bu gösterge, tepeleri ve dipleri otomatik olarak bulur. Gösterge, "ZigZag" otomatik olarak bir dip oluşturduğunda ve
FREE
A professional tool for trading - the divergence indicator between the  MACD and the price, which allows you to receive a signal about a trend reversal in a timely manner or catch price pullback movements (depending on the settings). The indicator settings allow you to adjust the strength of the divergence due to the angle of the  MACD peaks and the percentage change in price, which makes it possible to fine-tune the signal strength. The indicator code is optimized and is tested very quickly as
FREE
Donchian Clouds
Samuel Manoel De Souza
The Indicator indicator draws 2 clouds based on Donchian Channels indicator values. The upper cloud is formed by the upper lines values and the lower cloud by the lowers lines values. The indicator allows to change the Channels parameters and the clouds colors the period of the base line and the multiplier of each Donchian Channels instance. The indicator holds 5 buffer index as follow: [0] - Outer values of the upper cloud [1]  - Inner values of the upper cloud [2]  - Base/Center line values [3
FREE
Bollinger Bands B
Flavio Javier Jarabeck
5 (3)
John Bollinger created this indicator in 2010 as a way to read the original indicator (Bollinger Bands) in a more "technical" way, shown as an oscillator. The typical range of the Bollinger Bands %B is 0 - 0.5 - 1.0, where "0" represents the lower band, the "0.5" the middle band, and "1" the upper band. The line on the indicator represents the Closing prices. As simple as that. SETTINGS Bollinger Bands period of analysis Standard Deviation multiplier Shift Price type to be analyzed If you
FREE
Spike Catch Pro 22:03 release updates Advanced engine for searching trade entries in all Boom and Crash pairs (300,500 and 1000) Programmed strategies improvements Mx_Spikes (to combine Mxd,Mxc and Mxe), Tx_Spikes,   RegularSpikes,   Litho_System,   Dx_System,   Md_System,   MaCross,   Omx_Entry(OP),  Atx1_Spikes(OP),   Oxc_Retracement (AT),M_PullBack(AT) we have added an arrow on strategy identification, this will help also in the visual manual backtesting of the included strategies and see h
FREE
Free automatic Fibonacci is an indicator that automatically plots a Fibonacci retracement based on the number of bars you select on the BarsToScan setting in the indicator. The Fibonacci is automatically updated in real time as new highest and lowest values appears amongst the selected bars. You can select which level values to be displayed in the indicator settings. You can also select the color of the levels thus enabling the trader to be able to attach the indicator several times with differe
FREE
Bar Color Trend
Germano Chagas
4.5 (10)
Combining the best of Price Action , Directional Movement , and Divergence/Convergence analysis, Candle Color Trend is a easy and reliable way to identify trend direction. The indicator automatically paints the candles according to the assumption that an uptrend is defined by prices that form a series of higher highs and higher lows. In contrast, a downtrend is defined by prices that form a series of lower highs and lower lows. Additionally, ADX Wilder indicator is used to measure trend weakness
FREE
This is  RSI with alarm and push notification  -is a indicator based on the popular Relative Strength Index (RSI) indicator with Moving Average and you can use it in Forex, Crypto, Traditional, Indices, Commodities. You can change colors to see how it fits you. Back test it, and find what works best for you. This product is an oscillator with dynamic overbought and oversold levels, while in the standard RSI, these levels are static and do not change. This allows  RSI with alarm and push notific
FREE
Are you tired of drawing trendlines every time you're analyzing charts? Or perhaps you would like more consistency in your technical analysis. Then this is for you. This indicator will draw trend lines automatically when dropped on a chart. How it works Works similar to standard deviation channel found on mt4 and mt5. It has 2 parameters: 1. Starting Bar 2. Number of bars for calculation The   starting bar   is the bar which drawing of the trend lines will begin, while the   number of bars for c
FREE
VWAP and MVWAP
Flavio Javier Jarabeck
4.17 (6)
Volume Weighted Average Price (VWAP) is a trading benchmark commonly used by Big Players that gives the average price a Symbol has traded throughout the day. It is based on both Volume and price. Additionally we put in this indicator the MVWAP (Moving Volume Weighted Average Price). For those who do not know the usage and the importance od this indicator I recommend a great article about this subject at Investopedia ( https://www.investopedia.com/articles/trading/11/trading-with-vwap-mvwap.asp )
FREE
Mitimom
Danil Poletavkin
The indicator is based on Robert Miner's methodology described in his book "High probability trading strategies" and displays signals along with momentum of 2 timeframes. A Stochastic oscillator is used as a momentum indicator. The settings speak for themselves period_1 is the current timeframe, 'current' period_2 is indicated - the senior timeframe is 4 or 5 times larger than the current one. For example, if the current one is 5 minutes, then the older one will be 20 minutes The rest of the
FREE
Money Flow Index EA Friendly
Flavio Javier Jarabeck
4.25 (4)
The traditional Money Flow Index indicator, this time, EA friendly . There are 3 buffers exposed that can be used by EAs to automatically analyze the Overbought and Oversold conditions of the quote. Just use the traditional iCustom() function to get these signals. This Money Flow Index calculation is based on the traditional Metaquote's MFI indicator. SETTINGS MFI Period Volume type to analyze (Real Volume or Ticks) Starting Overbought region Starting Oversold region USING WITH EAs Buffer
FREE
Donchian Pro
Paulo Henrique Faquineli Garcia
5 (2)
The Donchian Channel Channels are among the most popular tools of technical analysis, as they visually convey to the analyst the limits within which most price movement tends to occur. Channel users know that valuable information can be obtained at any time, whether prices are in the central region of a band or close to one of the border lines. One of the best known techniques to explore these concepts is Bollinger Bands. However, John Bollinger was not the only one to research the applicatio
FREE
Cybertrade Keltner Channels - MT5 Created by Chester Keltner, this is a volatility indicator used by technical analysis. It is possible to follow the trend of financial asset prices and generate support and resistance patterns. In addition, envelopes are a way of tracking volatility in order to identify opportunities to buy and sell these assets. It works on periods longer than the period visible on the chart. All values ​​are available in the form of buffers to simplify possible automations.
FREE
The Moving Average Convergence Divergence (MACD) işlem stratejisi, momentum ve trend yönündeki değişiklikleri belirlemek için kullanılan popüler bir teknik analiz aracıdır. MACD, 26 periyotlu üssel hareketli ortalamanın (EMA) 12 periyotlu EMA'dan çıkarılmasıyla hesaplanır. Ardından, "sinyal çizgisi" olarak adlandırılan 9 periyotlu EMA MACD'nin üzerine çizilir ve alım satım sinyalleri için bir tetikleyici olarak görev yapar. MACD, MACD hattı sinyal çizgisinin üzerindeyken boğa bölgesinde ve altın
FREE
Multi-timeframe trend indicator based on the ADX / ADXWilder indicator with Fibonacci levels The indicator shows trend areas using ADX or ADXWilder indicator data from multiple timeframes. The impulse mode of the indicator allows you to catch the beginning of a trend, and several "Screens" with different timeframes allow you to filter out market noise. Fibonacci levels are added to the price chart, which have flexible settings. How the indicator works: if PDI is greater than NDI, then   it`
FREE
An analogue of the Stochastic oscillator based on algorithms of singular spectrum analysis (SSA) SSA is an effective method to handle non-stationary time series with unknown internal structure. It is used for determining the main components (trend, seasonal and wave fluctuations), smoothing and noise reduction. The method allows finding previously unknown series periods and make forecasts on the basis of the detected periodic patterns. Indicator signals are identical to signals of the original i
FREE
This indicator sums up the difference between the sells aggression and the buys aggression that occurred in each Candle, graphically plotting the waves of accumulation of the aggression volumes.   Through these waves an exponential average is calculated that indicates the direction of the business flow. Note: This indicator DOES NOT WORK for Brokers and/or Markets WITHOUT the type of aggression (BUY or SELL).   Be sure to try our Professional version with configurable features and alerts:  Agr
FREE
Tushar Chande Aroon
Flavio Javier Jarabeck
3.75 (4)
The name Aroon means “ Dawn's Early Light ” in Sanskrit. His creator Tushar Chande chose this name because the indicator is designed to catch the beginning of a new trend. At first sight it seems a little confusing all those jagged lines but after you understand the basics of it, you will find this indicator pretty cool and use it in a variety of ways, i.e.: Trigger, Trend Filtering System, and so on. The Aroon indicator was created in 1995 so it is a "modern" indicator compared to the Jurassic
FREE
SDivergence
Mobin Zarekar
1 (1)
SDivergence Göstergesi, MACD ve Stokastik (şimdilik) için düzenli sapmaları ve gizli sapmaları hesaplar ve gösterir. Bu göstergenin yararı, çoklu giriş değişkenleridir. Bu girişleri kullanarak, stratejinize daha uyarlanabilir RD ve HD'ler elde etmek için değişiklik yapabilirsiniz. Rehber : 1- Önce istediğiniz osilatörü (MACD veya Stokastik veya Her İkisi) grafiğe koyun. 2- SDivergence göstergesini çalıştırın ve SDivergence giriş penceresine daha önce koyduğunuz osilatörün karşılık gelen a
FREE
Bu ürünün alıcıları ayrıca şunları da satın alıyor
Öncelikle, bu Ticaret Sistemi'nin Non-Repainting, Non-Redrawing ve Non-Lagging Göstergesi olduğunu vurgulamak önemlidir, bu da hem manuel hem de robot ticareti için ideal hale getirir. "Smart Trend Trading System MT5", yeni ve deneyimli tüccarlar için özelleştirilmiş kapsamlı bir ticaret çözümüdür. 10'dan fazla premium göstergeyi birleştiriyor ve 7'den fazla sağlam ticaret stratejisi sunuyor, bu da çeşitli piyasa koşulları için esnek bir seçim yapar. Trend Takip Stratejisi: Trendleri etkili bir
Öncelikle belirtmek gerekir ki bu Ticaret Göstergesi Yeniden Çizim Yapmaz, Gecikmez ve Gecikme Göstermez, bu da hem manuel hem de robot ticareti için ideal hale getirir. Atom Analisti, Piyasada Daha İyi Bir Avantaj Bulmak İçin Fiyatın Gücünü ve Momentumunu Kullanan PA Fiyat Hareketi Göstergesidir. Gürültüleri ve Yanlış Sinyalleri Kaldırmaya ve Ticaret Potansiyelini Artırmaya Yardımcı Olan Gelişmiş Filtrelerle Donatılmıştır. Birden fazla katmanlı karmaşık göstergeler kullanarak, Atom Analisti
FX Volume MT5
Daniel Stein
4.94 (17)
Sabah Brifingimiz aracılığıyla ayrıntılar ve ekran görüntüleri ile günlük piyasa güncellemenizi alın burada mql5 ve on Telegram ! FX Volume, bir brokerin bakış açısından piyasa duyarlılığı hakkında GERÇEK bir fikir veren İLK ve TEK hacim göstergesidir. COT raporlarından çok daha hızlı bir şekilde, brokerlar gibi kurumsal piyasa katılımcılarının Forex piyasasında nasıl konumlandıklarına dair harika bilgiler sağlar. Bu bilgileri doğrudan grafiğinizde görmek, ticaretiniz için gerçek oyun değiştir
Quantum Trend Sniper
Bogdan Ion Puscasu
5 (37)
Tanıtım       Kuantum Trend Keskin Nişancı Göstergesi   , trend tersine dönmeleri belirleme ve ticaret yapma şeklinizi değiştiren çığır açan MQL5 Göstergesi! 13 yılı aşkın ticaret tecrübesine sahip deneyimli tüccarlardan oluşan bir ekip tarafından geliştirilmiştir.       Kuantum Trend Keskin Nişancı Göstergesi       trend dönüşlerini son derece yüksek doğrulukla belirlemenin yenilikçi yolu ile ticaret yolculuğunuzu yeni zirvelere taşımak için tasarlanmıştır. ***Kuantum Trend Keskin Nişancı Gö
Gold Stuff mt5
Vasiliy Strukov
4.89 (166)
Gold Stuff mt5, özellikle altın için tasarlanmış bir trend göstergesidir ve herhangi bir finansal enstrümanda da kullanılabilir. Gösterge yeniden çizilmez ve gecikmez. Önerilen zaman dilimi H1. Ayarları ve kişisel bir bonusu almak için satın alma işleminden hemen sonra benimle iletişime geçin!   AYARLAR Ok Çiz - açık kapalı. grafik üzerinde oklar çizmek. Uyarılar - sesli uyarılar kapalı. E-posta bildirimi - açık kapalı. E-posta Bildirimleri. Puch bildirimi - açık kapalı. Push bildirimleri
Trend Screener Pro MT5
STE S.S.COMPANY
4.89 (61)
Trend Göstergesi, Trend Alım Satım ve Filtreleme için Çığır Açan Benzersiz Çözüm, Tüm Önemli Trend Özellikleriyle Tek Bir Araç İçinde Yerleştirildi! Forex, emtialar, kripto para birimleri, endeksler ve hisse senetleri gibi tüm sembollerde/araçlarda kullanılabilen %100 yeniden boyamayan çoklu zaman çerçevesi ve Çoklu para birimi göstergesidir. Trend Screener, grafikte noktalarla ok trend sinyalleri sağlayan etkili bir trend trend göstergesidir. Trend analizörü göstergesinde bulunan özellikler: 1.
FX Power MT5 NG
Daniel Stein
5 (4)
Sabah Brifingimiz burada mql5 ve on Telegram! FX Power MT5 NG , uzun zamandır çok popüler olan döviz gücü ölçerimiz FX Power'ın yeni neslidir. Peki bu yeni nesil güç ölçer ne sunuyor? Orijinal FX Power hakkında sevdiğiniz her şey PLUS GOLD/XAU güç analizi Daha da hassas hesaplama sonuçları Ayrı ayrı yapılandırılabilir analiz dönemleri Daha da iyi performans için özelleştirilebilir hesaplama limiti Özel çokluDaha fazlasını görmek isteyenler için örnek ayarlar Her grafikte en sevdiğiniz renkler i
Top indicator for MT5   providing accurate signals to enter a trade without repainting! It can be applied to any financial assets:   forex, cryptocurrencies, metals, stocks, indices .  Watch  the video  (6:22) with an example of processing only one signal that paid off the indicator! MT4 version is here It will provide pretty accurate trading signals and tell you when it's best to open a trade and close it. Most traders improve their trading results during the first trading week with the help of
Öncelikle, bu Ticaret Aracının Non-Repainting, Non-Redrawing ve Non-Lagging Gösterge olduğunu vurgulamakta fayda var, bu da onu profesyonel ticaret için ideal hale getiriyor. Akıllı Fiyat Hareketi Kavramları Göstergesi, hem yeni hem de deneyimli tüccarlar için çok güçlü bir araçtır. İleri ticaret fikirlerini, Inner Circle Trader Analizi ve Smart Money Concepts Ticaret Stratejileri gibi 20'den fazla kullanışlı göstergeyi bir araya getirerek bir araya getirir. Bu gösterge, büyük kurumların tica
RelicusRoad Pro MT5
Relicus LLC
4.82 (22)
Şimdi 147 $ (birkaç güncellemeden sonra 499 $ 'a yükseliyor) - Sınırsız Hesaplar (PC'ler veya Mac'ler) RelicusRoad Kullanım Kılavuzu + Eğitim Videoları + Özel Discord Grubuna Erişim + VIP Durumu PİYASAYA BAKMAK İÇİN YENİ BİR YOL RelicusRoad, forex, vadeli işlemler, kripto para birimleri, hisse senetleri ve endeksler için dünyanın en güçlü ticaret göstergesidir ve yatırımcılara kârlı kalmaları için ihtiyaç duydukları tüm bilgileri ve araçları sağlar. Başlangıç ​​seviyesinden ileri seviyey
Auto Order Block with break of structure based on ICT and Smart Money Concepts Futures Break of Structure ( BoS )             Order block ( OB )            Higher time frame Order block / Point of Interest ( POI )    shown on current chart           Fair value Gap ( FVG ) / Imbalance   ,  MTF      ( Multi Time Frame )    Volume Imbalance     ,  MTF          vIMB Gap’s Equal High / Low’s     ,  MTF             EQH / EQL Liquidity               Current Day High / Low           HOD /
XQ Indicator MetaTrader 5
Marzena Maria Szmit
5 (1)
Step into the realm of Forex trading with confidence and precision using XQ, a cutting-edge Forex indicator designed to elevate your trading game to unprecedented heights. Whether you're a seasoned trader or just stepping into the world of currency exchange, XQ Forex Indicator empowers you with the insights and signals needed to make informed trading decisions. The signal conditions are a combination of three indicators, and XQ Forex Indicator only display  medium and long-term trends . The ind
Blahtech Supply Demand MT5
Blahtech Limited
4.57 (14)
Was: $299  Now: $99   Supply Demand uses previous price action to identify potential imbalances between buyers and sellers. The key is to identify the better odds zones, not just the untouched ones. Blahtech Supply Demand indicator delivers functionality previously unavailable on any trading platform. This 4-in-1 indicator not only highlights the higher probability zones using a multi-criteria strength engine, but also combines it with multi-timeframe trend analysis, previously confirmed swings
Advanced Supply Demand MT5
Bernhard Schweigert
4.53 (15)
Herhangi bir Acemi veya Uzman Tüccar için En İyi Çözüm! Bu gösterge benzersiz, yüksek kaliteli ve uygun fiyatlı bir ticaret aracıdır çünkü bir dizi tescilli özelliği ve yeni bir formülü bir araya getirdik. Bu güncelleme ile çift zaman dilimi dilimlerini gösterebileceksiniz. Yalnızca daha yüksek bir TF gösteremeyeceksiniz, aynı zamanda TF grafiğini ve ARTIK daha yüksek TF'yi de gösterebileceksiniz: YUVARLAK BÖLGELERİ GÖSTERMEK. Tüm Arz Talebi tüccarları buna bayılacak. :) Önemli Bilgiler Açıkland
AW Trend Predictor MT5
AW Trading Software Limited
4.76 (54)
Tek bir sistemde trend ve kırılma seviyelerinin kombinasyonu. Gelişmiş bir gösterge algoritması piyasa gürültüsünü filtreler, trendi, giriş noktalarını ve olası çıkış seviyelerini belirler. Gösterge sinyalleri, sinyal geçmişinin etkinliğini gösteren en uygun enstrümanların seçilmesine izin veren bir istatistiksel modüle kaydedilir. Gösterge Kâr Al ve Zararı Durdur işaretlerini hesaplar. Kılavuz ve talimatlar ->   BURAYA   / MT4 versiyonu ->   BURAYA Gösterge ile nasıl ticaret yapılır: Trend Pre
ICT, SMC, SMART MONEY CONCEPTS, SMART MONEY, Smart Money Concept, Support and Resistance, Trend Analysis, Price Action, Market Structure, Order Blocks, BOS/CHoCH,   Breaker Blocks ,  Momentum Shift,   Supply&Demand Zone/Order Blocks , Strong Imbalance,   HH/LL/HL/LH,    Fair Value Gap, FVG,  Premium  &   Discount   Zones, Fibonacci Retracement, OTE, Buy Side Liquidity, Sell Side Liquidity, BSL/SSL Taken, Equal Highs & Lows, MTF Dashboard, Multiple Time Frame, BigBar, HTF OB, HTF Market Structure
TPSpro TRENDPRO  - is a trend indicator that automatically analyzes the market and provides information about the trend and each of its changes, as well as giving signals for entering trades without redrawing! The indicator uses each candle, analyzing them separately. referring to different impulses - up or down impulse. Exact entry points into transactions for currencies, crypto, metals, stocks, indices!  -  Version MT4                  DETAILED DESCRIPTION        /       TRADING SETUPS       
Gann Kare Göstergesi, W.D. Gann tarafından yazılan "Piyasa Tahminleri için Matematiksel Formül" makalesine dayalı güçlü bir piyasa analizi aracıdır. Bu araç, piyasa analizi için matematiksel ve Gann teorilerini kullanarak hassas analizler gerçekleştirir. 144, 90, 52 karelerini ve ayrıca 9 karesini kullanır. Ayrıca, ın 9 karesi ve bu kareyle ilişkili kanallar ve yıldız modelleri için yöntemini içerir. Kullanıcı Kılavuzu ve Uygulama: Bu göstergeleri kullanmadan önce, kullanıcı kılavuzunu okumanız
Fiyat tersine döndükçe ve geri çekildikçe piyasa yapısından elde edilen kâr değişir. Piyasa yapısını tersine çevirme uyarısı göstergesi, bir trendin veya fiyat hareketinin ne zaman tükenmeye yaklaştığını ve tersine dönmeye hazır olduğunu tanımlar. Genellikle bir geri dönüş veya büyük bir geri çekilme meydana gelmek üzereyken meydana gelen piyasa yapısındaki değişiklikler konusunda sizi uyarır. Gösterge, olası bir tükenme noktasının yakınında her yeni yüksek veya düşük oluştuğunda, başlangıçta
Grafiğinizde otomatik olarak destek ve direnç seviyeleri PLUS itici mum boşlukları çizin, böylece fiyatın nereye gidebileceğini ve / veya potansiyel olarak tersine dönebileceğini görebilirsiniz. Bu gösterge, web sitemde (The Market Structure Trader) öğretilen pozisyon ticareti metodolojisinin bir parçası olarak kullanılmak üzere tasarlanmıştır ve hedefleme ve potansiyel girişler için temel bilgileri görüntüler. MT4 Version:  https://www.mql5.com/en/market/product/97246/ Göstergede 2 TEMEL öze
A key element in trading is zones or levels from which decisions to buy or sell a trading instrument are made. Despite attempts by major players to conceal their presence in the market, they inevitably leave traces. Our task was to learn how to identify these traces and interpret them correctly. Reversal First Impulse levels (RFI)   -  Version MT4                  INSTRUCTIONS                 RUS                 ENG                         R ecommended to use with an indicator   -  TREND PRO  
Tanıtım       Quantum Breakout PRO   , Breakout Bölgeleri ile ticaret yapma şeklinizi değiştiren çığır açan MQL5 Göstergesi! 13 yılı aşkın ticaret tecrübesine sahip deneyimli tüccarlardan oluşan bir ekip tarafından geliştirilmiştir.       Kuantum Breakout PRO       yenilikçi ve dinamik koparma bölgesi stratejisiyle ticaret yolculuğunuzu yeni zirvelere taşımak için tasarlanmıştır. Kuantum Breakout Göstergesi, size 5 kar hedefi bölgesi ile kırılma bölgelerinde sinyal okları ve kırılma kutusuna
The Volume by Price Indicator for MetaTrader 5 features Volume Profile and Market Profile TPO (Time Price Opportunity). Get valuable insights out of currencies, equities and commodities data. Gain an edge trading financial markets. Volume and TPO histogram bar and line charts. Volume Footprint charts. TPO letter and block marker charts including split structures. Versatile segmentation and compositing methods. Static, dynamic and flexible ranges with relative and/or absolute visualizations. Lay
Owl Smart Levels MT5
Sergey Ermolov
4.47 (36)
MT4 versiyonu  |  FAQ Owl Smart Levels Indicator , Bill Williams'ın gelişmiş fraktalları , piyasanın doğru dalga yapısını oluşturan Valable ZigZag ve kesin giriş seviyelerini gösteren Fibonacci seviyeleri gibi popüler piyasa analiz araçlarını içeren tek gösterge içinde eksiksiz bir ticaret sistemidir. pazara ve kar elde edilecek yerlere. Stratejinin ayrıntılı açıklaması Gösterge ile çalışma talimatı Baykuş Yardımcısı ticaretinde Danışman Yardımcısı Kullanıcıların özel sohbeti -> Satın aldıktan
TrendLine PRO MT5
Evgenii Aksenov
4.78 (49)
The Trend Line PRO indicator is an independent trading strategy. It shows the trend change, the entry point to the transaction, as well as automatically calculates three levels of Take Profit and Stop Loss protection Trend Line PRO is perfect for all Meta Trader symbols: currencies, metals, cryptocurrencies, stocks and indices Advantages of Trend Line PRO Never redraws its signals The possibility of using it as an independent strategy It has three automatic levels Take Profit and Stop Loss lev
Gartley Hunter Multi
Siarhei Vashchylka
5 (5)
Gartley Hunter Multi - An indicator for searching for harmonic patterns simultaneously on dozens of trading instruments and on all classic timeframes: (m1, m5, m15, m30, H1, H4, D1, Wk, Mn). Manual (Be sure to read before purchasing) | Version for MT4 Advantages 1. Patterns: Gartley, Butterfly, Shark, Crab. Bat, Alternate Bat, Deep Crab, Cypher 2. Simultaneous search for patterns on dozens of trading instruments and on all classic timeframes 3. Search for patterns of all possible sizes. Fr
Trend Line Map Pro MT5
STE S.S.COMPANY
4.67 (9)
Trend Line Map indicator is an addons for   Trend Screener Indicator . It's working as a scanner for all signals generated by Trend screener ( Trend Line Signals ) . It's a Trend Line Scanner based on Trend Screener Indicator.  If you don't have Trend Screener Pro Indicator,   the Trend Line Map Pro will not work.     LIMITED TIME OFFER : Trend Line Map Indicator is available for only 50 $ and lifetime. ( Original price 125$ ) By accessing to our MQL5 Blog,  you can find all our premium indica
TrendDecoder Premium MT5
Christophe, Pa Trouillas
5 (1)
Aralıkları ve bir sonraki olası hamleleri belirleyin     |    Trendlerin en erken sinyallerini ve gücünü alın     |    Geri dönüşten önce net çıkışlar alın     |    Fiyatın test edeceği Fibo seviyelerini tespit edin   |  Gecikmesiz, takip edilmeyen gösterge - manuel ve otomatik ticaret için ideal - tüm varlıklar ve tüm zaman birimleri için uygun 50 İNDİRİM   - lansman için sonra tekrar   >>   149 $ Satın aldıktan sonra, kişiselleştirilmiş ayarlar için   bu kanaldan benimle iletişime geçin . MT4
MetaBands M5
Vahidreza Heidar Gholami
4.67 (3)
MetaBands uses powerful and unique algorithms to draw channels and detect trends so that it can provide traders with potential points for entering and exiting trades. It’s a channel indicator plus a powerful trend indicator. It includes different types of channels which can be merged to create new channels simply by using the input parameters. MetaBands uses all types of alerts to notify users about market events. Features Supports most of the channel algorithms Powerful trend detection algorith
Was: $249  Now: $99   Market Profile defines a number of day types that can help the trader to determine market behaviour. A key feature is the Value Area, representing the range of price action where 70% of trading took place. Understanding the Value Area can give traders valuable insight into market direction and establish the higher odds trade. It is an excellent addition to any system you may be using. Inspired by Jim Dalton’s book “Mind Over Markets”, this indicator is designed to suit the
Yazarın diğer ürünleri
Bu kütüphane, herhangi bir EA'nızı kullanarak işlemleri yönetmenize izin verecektir ve açıklamalarda belirtilen komut dosyası koduyla ve ayrıca tüm süreci gösteren videodaki demo örnekleriyle kendi başınıza yapabileceğiniz herhangi bir EA'ya entegrasyonu çok kolaydır. - Limit Ver, SL Limit Ver ve Kar Al Limit Emirleri - Market, SL-Market, TP-Market siparişlerini verin - Limit emrini değiştirin - Siparişi iptal et - Siparişleri Sorgula - Kaldıraç, marjı değiştir - Pozisyon bi
MT5 için Kripto Para Tabloları. Özellikler : 1. Websocket (wss) aracılığıyla canlı OHLC Grafiği 2. API'den Barların Geçmişini Güncelleyin 3. Çubuklarda eksik veri olmadığından ve yerel grafik gibi her zaman güncel tutulduğundan emin olmak için MT5 yeniden başlatıldığında grafiklerde Otomatik Güncelleme geçmişi 4. API'den Zamanlanmış Geçmiş Güncellemesi : Bir milisaniye süreyle internet bağlantısının kesilmesi durumunda, websocket akış protokolü olduğundan bar ohlc değeri hatalı ol
Çoklu Para Birimi Önceki Mum veya Önceki Çubuk Tarayıcı, gösterge ayarlarından seçtiğiniz herhangi bir özel zaman diliminde çoklu sembol grafiklerini taramanıza yardımcı olur. Ürün bazında: https://www.mql5.com/en/market/product/110229 Önceki Günün en yüksek en düşük, Önceki haftanın en yüksek en düşük, Önceki ayın En yüksek en düşük veya herhangi bir özel zaman dilimi için çoklu sembolleri taramak için kullanılabilir; Önceki 4 saatlik grafik yüksek düşük Gürültüyü filtreler ve fiyat Y
Perfect Seconds grafik göstergesi, dakika mumlarını saniyelere dönüştürmenize olanak tanır 1. Bir çubuğu doğru zamanla %100 kapatmak için istediğiniz sayıda saniyeyi seçin. 2. Bu oranlara dayalı bir veridir, işaretler mevcut olmasa bile çalışır. 3. Harici DLL gerekmez, VPS'de sorunsuz çalışır 4. Hızlı ve optimize edilmiş kod 5. BInance, Kucoin gibi Kripto Çiftlerini ve Vadeli İşlem grafiğinin kolayca saniyelere dönüştürülebildiği diğer tüm borsaları destekler. 6. Altın ve Forex
Bu kütüphane, herhangi bir EA'nızı kullanarak işlemleri yönetmenize olanak tanır ve açıklamada belirtilen komut dosyası koduyla ve ayrıca tüm süreci gösteren videodaki demo örnekleriyle kendi başınıza yapabileceğiniz herhangi bir EA'ya entegrasyonu çok kolaydır. Bu ürün, API aracılığıyla alım satım işlemlerine izin verir ve grafikler içermez. Kullanıcılar, Crypto grafikleri sağlayan ve Binance'e emir gönderen brokerlerin grafiklerini kullanabilir - Tek Yönlü ve Hedge Modunu destekler - Lim
This indicator finds Double Top and Double bottom Example : What is Double Top When price establishes a new high and then falls, then reverse to the same candle area of High then its considered a valid double top and vice versa for double bottom. 1. It plots and high and low on visible chart if ChartChange is set to true else it searches on new bar opening 2. If there is double top and double bottom found in visible chart window then it plots a line 3. It has options to customize text color, te
FREE
Bu göstergeyi grafiğe ekleyin ve ZigZag'ın ExtDepth Ayarını ayarlayın Fiyat trend çizgisi Üst, Alt veya Orta kanala dokunduğunda anında uyarı verir Özellikler : -Üst, alt veya orta satırda uyarıları etkinleştirin / devre dışı bırakın - Saniyeler içinde bir uyarıdan sonra duraklama ekleyin - Grafikteki düğme ile Trend kanalını Duraklat veya Duraklattan Kaldır - Giriş alanına puan ekleyerek erken uyarılar ekleyin, örneğin ETH fiyatı 2900.25 burada 25 rakamı "nokta", yani giriş alanına puan
EA için Kripto Para Birimi Canlı Tick Verileri Teklif ve Talep ve Rezervasyon Derinliği Mevcut Değişim: 1. Binance Spot (Aktif grafik penceresinde Emir Defteri Derinliğini destekler) ve Vadeli İşlemler (Birden fazla Emir Defteri Derinliğini destekler) 2. Kucoin Spot ve Vadeli İşlemler, Aktif grafik penceresinde Sipariş Defteri derinliğini destekler 3. Bybit Vadeli İşlemler ve Ters Vadeli İşlemler Verileri İşaretle Teklif Al Son Yaklaşan Borsa: OKX, MEXC ve daha fazlası.. Özelli
Çoklu Sembol Fiyat uyarısı ayarlamak ve Terminal Uyarısı veya Push Bildiriminden bildirim almak için grafikte herhangi bir yere Çift Tıklayın 1. EA Yardımcı Programını tabloya ekleyin 2. <- sol veya -> sağ ok tuşlarıyla çizelgeye göz atın 3. Grafikte herhangi bir yere çift tıklayın ve bir satır ekleyecektir, istediğiniz fiyatı ayarlamak için bu satırı sürükleyin ve işte, uyarı ayarlandı! Fiyat hatta ulaştığında, yardımcı programın ayarlarına göre terminal veya push bildirimi ile sizi bi
MT5 için Binance Ticaret Aracı 1. Bu ürün websocket'ten canlı grafik, tarihsel grafik, Binance'te sorunsuz bir şekilde işlem yapmanızı sağlayan sıfır manuel müdahale ile sorunsuz çalışmasını sağlamak için mt5 terminali yeniden başlatıldığında otomatik güncellemeler. Spot ve Vadeli İşlemler için Ticaret, Canlı Grafik ve Geçmiş Veriler Mevcuttur Nasıl kullanılır : 1. API anahtarınızı ve sırrınızı bu yardımcı programın Giriş alanına eklemeniz gerekir. API'nizi oluşturduğunuzda Vadeli İ
Cobra Levels
Rajesh Kumar Nait
Kobra Seviyeleri Bunlar, forex, kripto, emtia, şık ve banknifty dahil olmak üzere evrensel piyasada çalışan iki frekans moduna sahip 6 seviye setidir. Finansal araçlara ilişkin en iyi araştırmalardan sonra yayınlanırlar. Üst seviyeler U1 ila U5, alt seviyeler ise D1 ila D5 olarak adlandırılır. Piyasa, normal durumda U3 veya D3'e kadar iç kanallardan veya değişken durumda U4'ten U5'e veya D4'ten D5'e kadar dış kanallardan hareket edebilir. Fiyat U3 U4 U5 veya D3 D4 D5'e ulaştığında, geri d
Bu gösterge, tüccarın ihtiyacına göre grafiği daha temiz hale getirmek için etkinleştirilebilen / devre dışı bırakılabilen 6 seviyeye kadar çizer Bu 6 seviye 2 set halindedir: Yüksek ve Düşük Her set için farklı zaman aralığı seçilebilir Fiyatın Günlük, Haftalık veya Aylık En Düşük seviyeye ulaştığında genellikle 5dk gibi daha küçük bir zaman diliminde reddedildiği düşünüldüğünden, Önceki Yüksek Düşük tersine çevirme stratejisine dayanır. Özellikler : - Tek bir grafikte 6 Zaman Çerçev
Crypto.com'dan MT5'e Crypto.com websocket'ten Metatrader 5'e Canlı Şamdan Akışı OHCLV (Açık Yüksek Düşük Yakın Gerçek Hacim) Canlı Oran Verisi  tüccarlar, eğer bir dakikalık grafikte OHLC verileri doğru değilse, teknik tablo çalışmasında yanlış analiz verebilir, Bu ürün, manuel analizde yardımcı olabilecek gerçek zamanlı olarak doğru veriler verdiğini garanti eder diğer kripto ürünüme profilimden bakabilirsin https://www.mql5.com/en/users/rajeshnait/seller 1. OHLCV Verileri 2. Çoklu
Piyasa yapıları, daha yüksek bir zaman diliminde kırıldığında, bir tüccar için bir eğilimi temizlemeye yardımcı olabilecek yapılardır. 1. Bu gösterge ZigZag'ı yalnızca son 2 yapıya çekecektir (önceki ZigZag'ın en yüksek ve en düşük seviyesi) ve yeni bir ZigZag çubuğu yalnızca yapı kırılması gerçekleştiğinde oluşacaktır 2. Yapının bozulması durumunda Terminal ve Push bildirimi verir. 3. Salınımı ayarlamak için [ ve ] tuşlarından ZigZag Derinliğini Artırın ve Azaltın 4. Line AB BC ve C
Cobra Pivot Noktaları, DEMO'yu indirerek kendinizi test edebileceğiniz en iyi optimize edilmiş pivot noktalarını çizmeye yönelik bir göstergedir. 1. En İyi İki Pivot Modunu Seçin: Cobra Pivots veya Camrilla Pivots 2. D1 ile sınırlı olmamak üzere istediğiniz zaman dilimini kullanabilirsiniz. 3. Shift parametresi ile Önceki gün Yüksek Düşük Kapanış değeri ile oynayabilirsiniz. 1 = Önceki Çubuk, 2 = Önceki çubuktan önceki Çubuk vb.. Bu parametreler pivotlar üzerinde araştırma ve geliştirme
Pivot Noktaları Çoklu Sembol Tarayıcısı, Marketwatch'ta bulunan tüm sembolleri Floor, Woodie, Camarilla, Demark veya Fibonacci Pivot Noktaları için tarar. Pivot noktalarını hesaplamak için herhangi bir zaman dilimini seçebilir ve fiyat bu destek ve direnç seviyelerine dokunduğunda uyarı alabilirsiniz. Görsel Pivot Noktaları için Bu ürün ilginizi çekebilir: https://www.mql5.com/en/market/product/110231 Çeşitli uyarı türlerini seçme seçenekleri vardır Tarama sıklığını milisaniye cinsi
Simetrik üçgen, asimetrik üçgen veya dik açılı üçgen gibi Üçgen modeli için Model Gezgini, Yükselen kama veya Düşen kama gibi Kama modeli, Genişleme modeli ve Trend Kanalı Bu gösterge, mevcut kalıpların yanı sıra geçmiş kalıpları da araştırır, Trend çizgisini veya üçgeni manuel olarak çizerek zamandan tasarruf etmeye çalışanlar ve bunu grafikte en iyi kalıpları çizmenin otomatik analizi için kullanmak isteyenler için en iyi göstergedir. Özellikler : - En iyi deseni ayarlamak ve bulmak içi
Bu gösterge, tüccarın ihtiyacına göre grafiği daha temiz hale getirmek için etkinleştirilebilen / devre dışı bırakılabilen 6 seviyeye kadar çizer Bu 6 seviye 2 set halindedir: Yüksek ve Düşük Her set için farklı zaman aralığı seçilebilir Fiyatın Günlük, Haftalık veya Aylık En Düşük seviyeye ulaştığında genellikle 5dk gibi daha küçük bir zaman diliminde reddedildiği düşünüldüğünden, Önceki Yüksek Düşük tersine çevirme stratejisine dayanır. Özellikler : - Tek bir grafikte 6 Zaman Çerçev
Kraken Crypto Exchange Vadeli İşlemler Geçmişi Güncelleme Paneli Özellikler : 1. Sembol için Kraken API'sinden temin edilebilen ayar ve güncelleme geçmişine dayalı olarak sembol oluşturacaktır. Bu panel Kraken Vadeli İşlem sembollerindeki geçmişi Açık Yüksek Düşük Kapat verileriyle günceller, Ayrıca Geçmiş Güncellemesi tamamlandığında mesajı yazdırır. Lütfen bunun CANLI Veri olmadığını unutmayın.   3. Araçlar > Seçenekler > URL'den Webrequest'e İzin Ver sekmesinde belirtildiği gibi Krak
5 EMA Scalping Strategy Multi Symbol Scanner This EA utility will scan all symbols which are selected in marketwatch and alert when such condition is formed in chart when Candle low is above EMA 5 for Sell alert and Candle high is lower from EMA5 so you can be ready before selling or buying for scalping purpose on 5min chart For more details watch attached video Logic : When a candle closes above 5 EMA in 5 mins chart, Wait for its low to break and Sell when low is broken by wick, Your SL sh
Çoklu Sembol ZigZag Breakout Tarayıcı, marketwatch'da seçilen tüm sembolleri tarar. Fiyat bu seviyelere ulaşmak üzereyken çift tepe, çift dip veya herhangi bir fibonacci uzantı seviyesini kolayca bulmanıza yardımcı olacaktır. Zaman Çerçevesini ve Zigzag'ın birden fazla Genişletme Derinliğini (3'e kadar) seçebilirsiniz. Önerilen ZigZag, her türlü Zigzag ve filtre gürültüsünü kapsayan 21,34 ve 55'tir. Terminal uyarısı veya push bildirimi veya her ikisini birden alacak şekilde ayarlayabili
Fibo Musang FMBCR CB1 koparma tarayıcı MT5 Fibo Musang CB1 veya Candle Break 1, Gold XAUUSD ve diğer forex sembollerinde çok iyi çalışan bir stratejidir. Bu tarayıcı, çoklu sembol para birimlerini çok hızlı bir şekilde taramanıza ve FMCBR CB1 çıkışı hakkında uyarılar almanıza yardımcı olacaktır. Lütfen tüccarın tercihine göre tamamen özelleştirilebilen daha fazla ayrıntı için videoyu izleyin: 1. Zaman dilimini ve Bar Geçmişini seçebilirsiniz. 2. Tercih ettiğiniz ZigZag ayarını deği
Çoklu Sembol Fiyat uyarısı ayarlamak ve Terminal Uyarısı veya Push Bildiriminden bildirim almak için grafikte herhangi bir yere Çift Tıklayın 1. EA Yardımcı Programını tabloya ekleyin 2. <- sol veya -> sağ ok tuşlarıyla çizelgeye göz atın 3. Grafikte herhangi bir yere çift tıklayın ve bir satır ekleyecektir, istediğiniz fiyatı ayarlamak için bu satırı sürükleyin ve işte, uyarı ayarlandı! Fiyat hatta ulaştığında, yardımcı programın ayarlarına göre terminal veya push bildirimi ile sizi bi
Control Candle is the candlestick which holds multiple inside bars and are in control until its high low range is broken by close of any candlestick. When control candle is broken, price may act on these control candle as support and resistance. This indicator create rectangles on chart which will help you find control candles fast. Control candle indicator box is customizable by color, style, width and other options in indicator settings.
Bu gösterge fibonacci düzeyleri etiketlerini büyük yazı tipi boyutunda göstermenize olanak tanır . 25'ye kadar fibonacci seviyesini destekler - Fibonacci'yi çizdiğiniz anda giriş parametresi olarak eklediğiniz seviyeleri seçtiğiniz renk ve yazı tipiyle büyük yazı boyutunda gösterir. Özelleştirilebilir seçenekler: 1. Fibo Metin Yazı Tipi 2. Fibo Metin Boyutu 3. Fibo Metin Rengi 3. Her seviyeye açıklama ekleyin 4. Çapalar ve Dereceler gibi diğer seçenekler
Bu gösterge, aynı grafikte izlemek istediğiniz diğer zaman dilimi mum çubuklarını verimli bir şekilde izler 1. Aynı grafikteki çubukları yüklemek için daha yüksek bir zaman dilimini seçin 2. Şamdanların renklerini ve stilini özelleştirin 3. Şamdanları çizmek için çubuk sayısını seçin 4. Daha yüksek zaman dilimindeki komple mumları fitil ve gövdeyle birlikte takip edin 5. Grafiği değiştirmek istemeyenler için kolay ve kullanışlı.
Cobra Pivot Noktaları, DEMO'yu indirerek kendinizi test edebileceğiniz en iyi optimize edilmiş pivot noktalarını çizmeye yönelik bir göstergedir. 1. En İyi İki Pivot Modunu Seçin: Cobra Pivots veya Camrilla Pivots 2. D1 ile sınırlı olmamak üzere istediğiniz zaman dilimini kullanabilirsiniz. 3. Shift parametresi ile Önceki gün Yüksek Düşük Kapanış değeri ile oynayabilirsiniz. 1 = Önceki Çubuk, 2 = Önceki çubuktan önceki Çubuk vb.. Bu parametreler pivotlar üzerinde araştırma ve geliştirme
Çoklu Para Birimi Önceki Mum veya Önceki Çubuk Tarayıcı, gösterge ayarlarından seçtiğiniz herhangi bir özel zaman diliminde çoklu sembol grafiklerini taramanıza yardımcı olur. Ürün bazında: https://www.mql5.com/en/market/product/78657 Önceki Günün en yüksek en düşük, Önceki haftanın en yüksek en düşük, Önceki ayın En yüksek en düşük veya herhangi bir özel zaman dilimi için çoklu sembolleri taramak için kullanılabilir; Önceki 4 saatlik grafik yüksek düşük Gürültüyü filtreler ve fiyat Yü
Pivot Noktaları Çoklu Sembol Tarayıcısı, Marketwatch'ta bulunan tüm sembolleri Floor, Woodie, Camarilla, Demark veya Fibonacci Pivot Noktaları için tarar. Pivot noktalarını hesaplamak için herhangi bir zaman dilimini seçebilir ve fiyat bu destek ve direnç seviyelerine dokunduğunda uyarı alabilirsiniz. Görsel Pivot Noktaları için Bu ürün ilginizi çekebilir: https://www.mql5.com/en/market/product/110072 Çeşitli uyarı türlerini seçme seçenekleri vardır Tarama sıklığını milisaniye cinsi
Filtrele:
Passakon Ekaburudkul
254
Passakon Ekaburudkul 2024.01.08 11:44 
 

I really like it when use in H1 or over.

Peter Pedro
68
Peter Pedro 2023.04.08 14:50 
 

super

İncelemeye yanıt
Sürüm 1.1 2024.01.08
added new logic in input to customize spinning top