UR TrendExhaustion MT5
- Göstergeler
- Krzysztof Jan Debski
- Sürüm: 2.0
- Güncellendi: 22 Temmuz 2022
- Etkinleştirmeler: 5
UR TrendTükenme
UR TrendExhaustion, parametre değerleri veya diğer kurulumlarla uğraşmak istemeyen tüccarlar için en iyi çözümdür - herkes için hem kolay hem de görsel olarak anlaşılırdır.
UR TrendExhaustion kullanmanın avantajları:
parametre yok
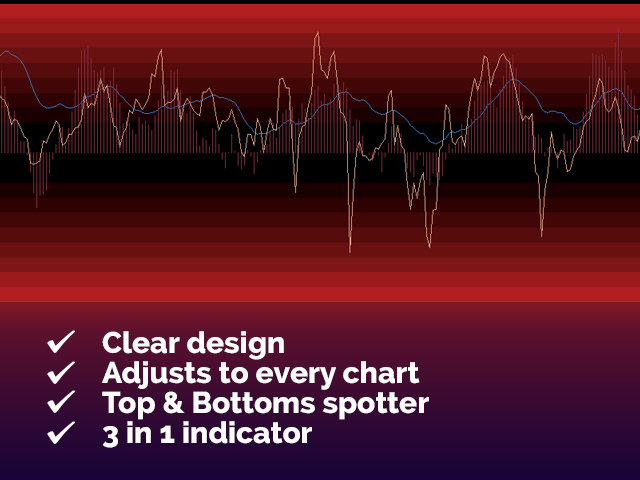
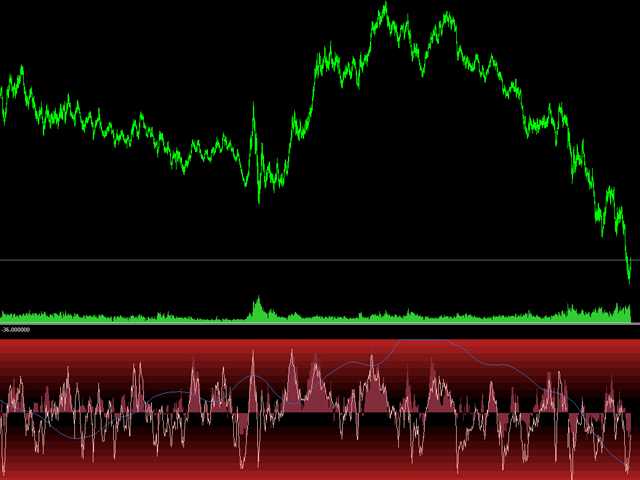
Grafikte neler olup bittiğini en iyi açıklayan 3 satırınız var: Trend Tükenme Hattı, Balina Para Hattı ve Perakende Para Hattı.
Arayüz, her iki uçta da (kırmızı alanlar) herhangi bir satırın tükenmesini gösterir.
En iyi avantaj: Kolay ve tüm varlıklara uyarlanmış.
Araç güncellemelerinden haberdar olabileceğiniz ve eksik bir şey olduğunu düşünüyorsanız istek gönderebileceğiniz özel bir telgraf sohbeti var!
Neden UR TrendExhaustion?
Kariyerim boyunca birçok türde göstergeyi kodladım ve grafikte başka herhangi bir araca ihtiyaç duymadan ticaret yapmak için bu basit ama en iyi (imo) aracı kodlamak için tüm bilgilerimi topladığım bir noktaya geldim. Anlaşılması kolay, Kurulumu kolay. Strateji, Piyasa Yapıcılarının buna karşı ticaret yapması gerçekten zor olacak şekilde yapılır - MM'leri mat edin!
UR TrendExhaustion ile kullandığınız herhangi bir ek araç, alım satımınıza katkıda bulunacaktır, ancak ben onu tek başıma kullanıyorum ve harika sonuçlar alıyorum. İyi şanlar!
UR TrendExhaustion nasıl kullanılır?
YT'de grafik panelin nasıl kullanılacağını gösteren bir video var, ancak daha aşina olmak için aşağıdaki açıklamaya da bakın:
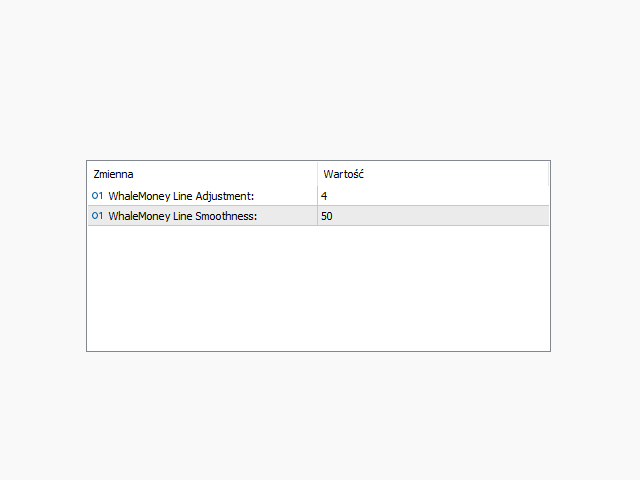
AYARLAR
Hiçbiri
GÖRÜNTÜLEMEK
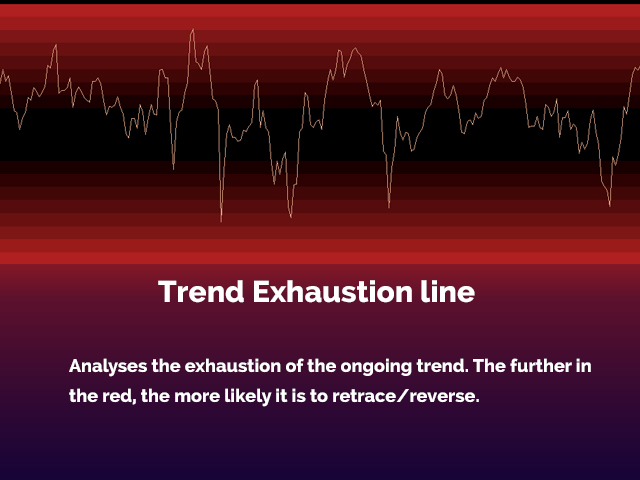
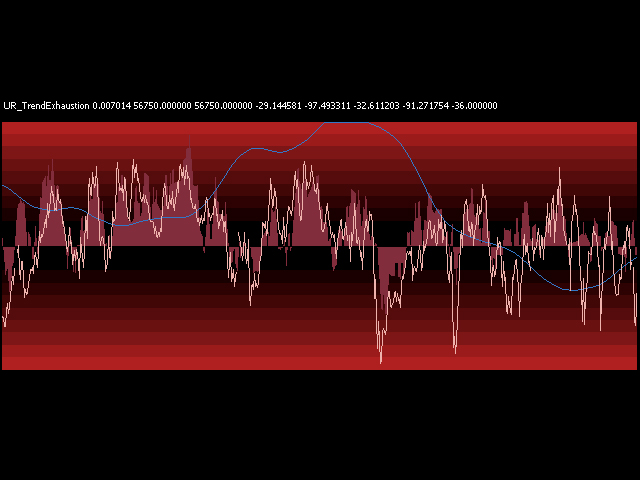
Trend Tükenmesi Ana Satır: Trend tükenmesini gösterir. Kırmızıda ne kadar çok olursa, tersine çevirme şansı o kadar yüksek olur.
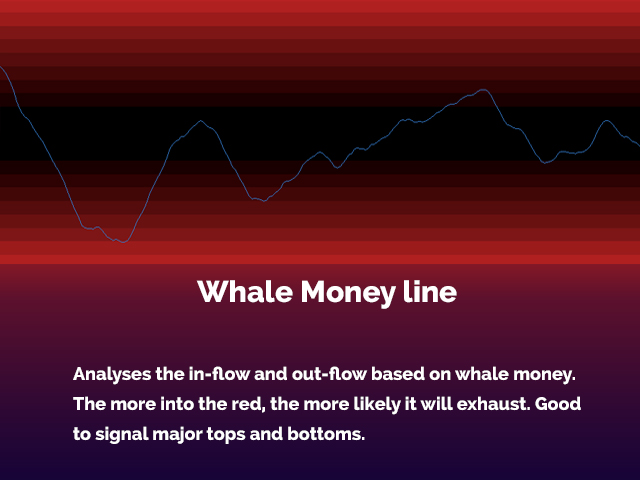
Balina Para Hattı (mavi): Balina para girişini gösterir - Ne kadar yüksekse, balinaların mola verme olasılığı o kadar yüksektir.
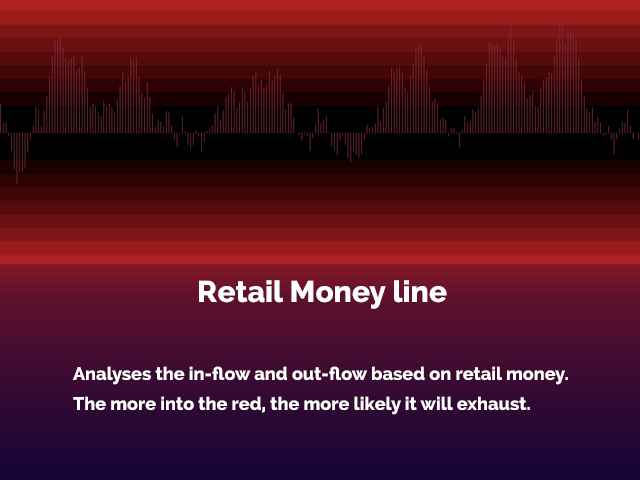
Perakende Para Histogramı: Perakende para girişini gösterir - Ne kadar yüksekse, perakende satış o kadar kuru olur.
EK
Tüm aletlerim monte edildiğinde en iyi şekilde çalışıyor. Yani, UR DivergenceSpotter, UR VolumeTrend veya/veya UR HighsAndLows ile kullanıldığında giriş noktalarının doğruluğu çok daha iyidir.