• Genel bakış
  • İncelemeler
  • Yorumlar
  • Yenilikler

UR DivergenceSpotter MT5

UR Sapma Gözlemcisi
 

UR DivergenceSpotter, uzun yıllara dayanan deneyimin sonucudur ve bazen en kolay yollar en iyisidir. Birkaç gösterge arasında iyi bir korelasyon vardır, ancak bunlar uyumsuz olduğunda - fiyat "yeniden ayarlamaya" çalışır - ve işte o anda UR DivergenceSpotter ile bir sinyal alırız.

UR Divergence Spotter kullanmanın avantajları:

parametre yok
Mum oluşturulduktan sonra yeniden boyanmaz
Sinyal artık geçerli olmadığında sinyal verir (bu, işleminizi daha uzun süre tutabileceğiniz, Zararı Durdur'u BE olarak ayarlayabileceğiniz ve devam etmesine izin verebileceğiniz, kısmi kar alabileceğiniz veya tamamen kapatabileceğiniz anlamına gelir!).
Bu gösterge, uzun yıllara dayanan deneyim ve gözlemin bir sonucudur. Sağlam ve test edilmiştir.
Daha iyi sonuçlar ve daha güvenli sinyaller için daha yüksek zaman dilimlerinde (h1/h4) kullanılması en iyisidir.

Ek olarak, daha iyi sinyal doğruluğu için UR TrendExhaustion veya UR VolumeTrend gibi diğer göstergelerle kullanmak olacaktır.
Araç güncellemelerinden haberdar olabileceğiniz ve eksik bir şey olduğunu düşünüyorsanız istek gönderebileceğiniz özel bir telgraf sohbeti var!


Neden UR DivergenceSpotter?

Daha önce de belirtildiği gibi - gösterge, tek bir göstergeye sarılmış bir deneyimdir. Herkesin anlayabileceği şekilde kodlanmıştır. Gösterge ayrıca, artık geçerli olmadığında sinyal verdiğinde bir özelliğe sahiptir (piyasanın tersine döneceği anlamına gelmez, yalnızca sinyalin o noktaya kadar geçerli olduğu ve fiyatın daha fazla VEYA tersine dönebileceği anlamına gelir - almak size kalmış (kısmi) ) kar edin veya ticaretinizi tamamen kapatın.

UR Divergence Spotter nasıl kullanılır?

Daha aşina olmak için aşağıdaki açıklamaya bakın:


AYARLAR
Hiçbiri
GÖRÜNTÜLEMEK

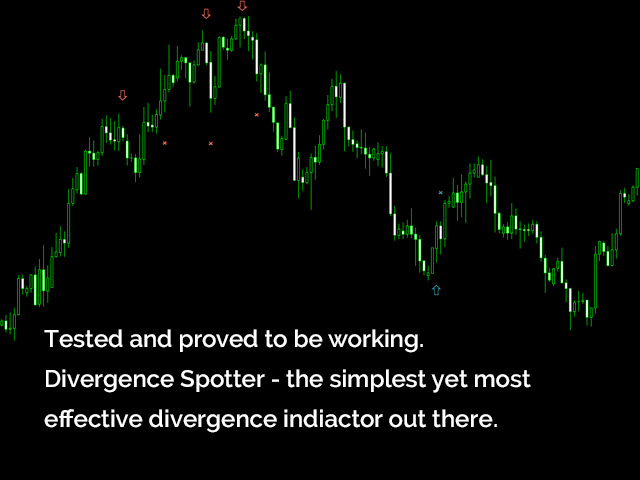
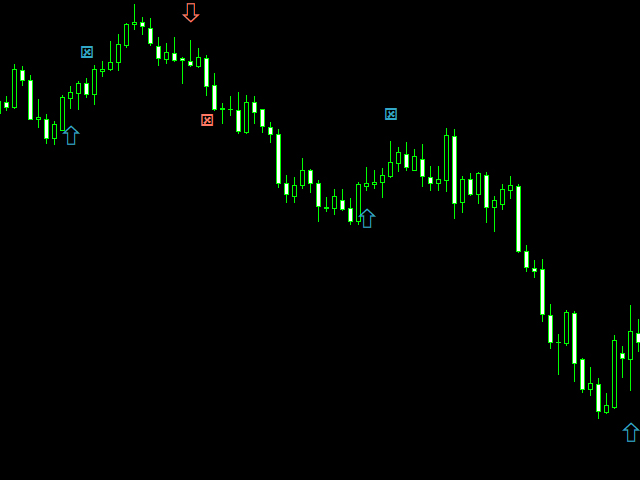
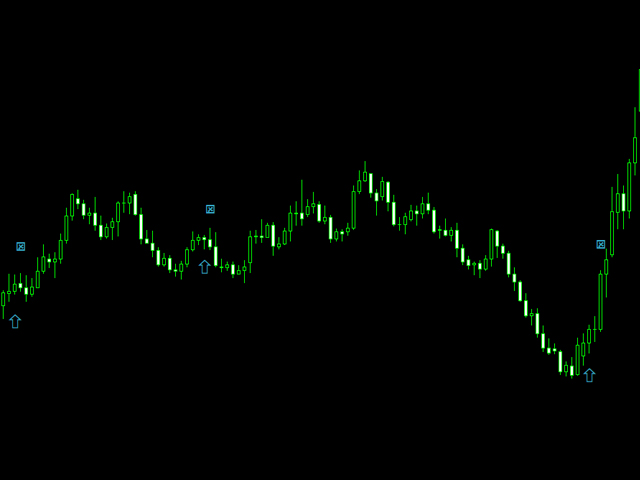
Oklar: Giriş noktaları - mum oluşturulduktan sonra girilmesi en iyisidir. Göstergeler, birkaç gösterge arasındaki farklılığı tespit eder ve bunu bir okla (yön ile) işaret eder.
X: Sinyal doldu ve artık girmek için geçerli değil - oradan fiyat tersine dönebilir veya daha fazla devam edebilir - risk yönetiminize göre ticaret yapın.
EK

Tüm aletlerim monte edildiğinde en iyi şekilde çalışıyor. Yani, UR TrendExhaustion, UR VolumeTrend veya/veya UR HighsAndLows ile kullanıldığında giriş noktalarının doğruluğu çok daha iyidir.
Önerilen ürünler
Was: $249  Now: $99   Market Profile defines a number of day types that can help the trader to determine market behaviour. A key feature is the Value Area, representing the range of price action where 70% of trading took place. Understanding the Value Area can give traders valuable insight into market direction and establish the higher odds trade. It is an excellent addition to any system you may be using. Inspired by Jim Dalton’s book “Mind Over Markets”, this indicator is designed to suit the
Before installing the HeatMap indicator make sure you are using a broker that gives you access to the Depth of market (DOM) !! This indicator creates a heatmap on your chart allowing you to see the buy or sell limit orders easily and in real time. You have the possibility to change the setting and the colors of the HeatMap in order to adapt to all markets and all charts. Here is an example of a setting you can use with the NASDAQ100 on the AMPGlobal broker :  https://www.youtube.com/watch?v=x0
PZ Trend Trading MT5
PZ TRADING SLU
3.67 (3)
Trend Trading is an indicator designed to profit as much as possible from trends taking place in the market, by timing pullbacks and breakouts. It finds trading opportunities by analyzing what the price is doing during established trends. [ Installation Guide | Update Guide | Troubleshooting | FAQ | All Products ] Trade financial markets with confidence and efficiency Profit from established trends without getting whipsawed Recognize profitable pullbacks, breakouts and early reversals The ind
KT Renko Patterns MT5
KEENBASE SOFTWARE SOLUTIONS
KT Renko Patterns scans the Renko chart brick by brick to find some famous chart patterns that are frequently used by traders across the various financial markets. Compared to the time-based charts, patterns based trading is easier and more evident on Renko charts due to their uncluttered appearance. KT Renko Patterns features multiple Renko patterns, and many of these patterns are extensively explained in the book titled Profitable Trading with Renko Charts by Prashant Shah. A 100% automate
Gösterge, tarihsel olanlarla karşılaştırılabilecek güncel teklifler oluşturur ve bu temelde bir fiyat hareketi tahmini yapar. Gösterge, istenen tarihe hızlı navigasyon için bir metin alanına sahiptir. Seçenekler: Sembol - göstergenin göstereceği sembolün seçimi; SymbolPeriod - göstergenin veri alacağı dönemin seçimi; GöstergeRenk - gösterge rengi; Ters - doğru tırnakları tersine çevirir, yanlış - orijinal görünüm; Sonraki, tarihi girebileceğiniz ve 'enter' tuşuna basa
Noize Absorption Index - is the manual trading system that measures the difference of pressure between bears forces and bulls forces. Green line - is a noize free index that showing curent situation. Zero value of index shows totally choppy/flat market.Values above zero level shows how powerfull bullish wave is and values below zero measures bearish forces.Up arrow appears on bearish market when it's ready to reverse, dn arrow appears on weak bullish market, as a result of reverse expectation.
Market Profile MetaTrader System  — is a classic Market Profile implementation that can show the price density over time, outlining the most important price levels, value area, and control value of a given trading session. This indicator can be attached to timeframes between M1 and D1 and will show the Market Profile for daily, weekly, monthly, or even intraday sessions. Lower timeframes offer higher precision. Higher timeframes are recommended for better visibility. It is also possible to use a
VolumeProfile MT5
Robert Hess
3.75 (8)
Description: The Volume Profile displays detailed informations of historical trading activities at certain price levels (Market Profile). Locate the areas with the best prices in the market and get an advantage over other market participants. Support: The indicator is constantly being developed and improved. Please do not hesitate to contact me via the MQL5 Platform. I am very grateful about any Bug report, so that i can constantly improve the indicator. I appreciate any public review for this
Blahtech Supply Demand MT5
Blahtech Limited
4.57 (14)
Was: $299  Now: $99   Supply Demand uses previous price action to identify potential imbalances between buyers and sellers. The key is to identify the better odds zones, not just the untouched ones. Blahtech Supply Demand indicator delivers functionality previously unavailable on any trading platform. This 4-in-1 indicator not only highlights the higher probability zones using a multi-criteria strength engine, but also combines it with multi-timeframe trend analysis, previously confirmed swings
No Demand No Supply MT5
Trade The Volume Waves Single Member P.C.
No Demand No Supply   This indicator identifies   No Demand –No Supply candles  to your chart and plots volume bars colored according to the signal. It can be applied to all timeframes or to a specific one only. It can also be used as regular volume indicator  with exceptional future of WEIGHTED VOLUME. Furthermore is has an alert notification, sound and email when a signals occurs. The indicator does not repaint but the alert will come on two candles back due to the definition of No Demand No S
Gioteen Volatility Index (GVI) - your ultimate solution to overcoming market unpredictability and maximizing trading opportunities. This revolutionary indicator helps you in lowering your losing trades due to choppy market movements. The GVI is designed to measure market volatility, providing you with valuable insights to identify the most favorable trading prospects. Its intuitive interface consists of a dynamic red line representing the volatility index, accompanied by blue line that indicate
Premium seviye, %80'den fazla doğru tahmin doğruluğuna sahip benzersiz bir göstergedir! Bu gösterge en iyi Ticaret Uzmanları tarafından iki aydan uzun süredir test edilmiştir! Yazarın göstergesini başka hiçbir yerde bulamazsınız! Ekran görüntülerinden bu aracın doğruluğunu kendiniz görebilirsiniz! 1, sona erme süresi 1 mum olan ikili opsiyon ticareti için harikadır. 2 tüm döviz çiftleri, hisse senetleri, emtialar, kripto para birimleri üzerinde çalışır Talimatlar: Kırmızı ok görün
This indicator allows you to enjoy the two most popular products for analyzing request volumes and market deals at a favorable price: Actual Depth of Market Chart Actual Tick Footprint Volume Chart This product combines the power of both indicators and is provided as a single file. The functionality of Actual COMBO Depth of Market AND Tick Volume Chart is fully identical to the original indicators. You will enjoy the power of these two products combined into the single super-indicator! Below is
PipFinite Exit EDGE MT5
Karlo Wilson Vendiola
4.89 (35)
Did You Have A Profitable Trade But Suddenly Reversed? In a solid strategy, exiting a trade is equally important as entering. Exit EDGE helps maximize your current trade profit and avoid turning winning trades to losers. Never Miss An Exit Signal Again Monitor all pairs and timeframes in just 1 chart www.mql5.com/en/blogs/post/726558 How To Trade You can close your open trades as soon as you receive a signal Close your Buy orders if you receive an Exit Buy Signal. Close your Sell orde
Introducing "X Marks the Spot" – Your Ultimate MetaTrader 5 Indicator for Perfect Trades! Are you tired of the guesswork in trading? Ready to take your MetaTrader 5 experience to a whole new level? Look no further – "X Marks the Spot" is here to revolutionize your trading strategy! What is "X Marks the Spot"? "X Marks the Spot" is not just another indicator – it's your personal trading compass that works seamlessly on all timeframes . Whether you're a beginner or an experienced trader,
The best time to trade Using this Indicator is when the time reach exactly hour,half,45 minutes,15 minutes and sometimes 5 minutes.. This indicators is helpful to those who trade boom and crash indecies.How to read this indicator first you'll see Blue allow and Red allow all these allows used to indicate or to detect the spike which will happen so the allow happens soon before the spike happen.This indicator works properly only in boom and crash trading thing which you have to consider when
Gösterge, piyasa analizi için en etkili araçlardan biri olan Fibonacci destek ve direnç seviyelerini otomatik olarak hesaplar ve çizer. Hesaplama, seçilen dönem ve zaman çerçevesi için ortalama fiyat verilerini kullanır. Bu süre için minimum ve maksimum hareketin başlangıcı ve sonu olarak alınır. Fibonacci seviyeleri, etrafında fiyat hareketinin yavaşlayabileceği veya tersine dönebileceği potansiyel referans noktalarını görmenizi sağlar, yani bunlar daha fazla hareketi tahmin etmek ve ayrıca sto
VR Grid Mt5
Vladimir Pastushak
3.6 (10)
VR Izgara göstergesi, kullanıcı tanımlı ayarlarla grafiksel bir ızgara oluşturmak için tasarlanmıştır . Standart ızgaradan farklı olarak, VR Izgarası dairesel seviyeler oluşturmak için kullanılır. Kullanıcının seçimine bağlı olarak tur seviyeleri arasındaki adım isteğe bağlı olabilir. Ek olarak, diğer göstergeler ve yardımcı programlardan farklı olarak VR Grid, zaman dilimi değiştiğinde veya terminal yeniden başlatıldığında bile ızgaranın konumunu korur . Ayarlar, set dosyaları, demo versiyonlar
FREE
Bu indikatör, her sipariş için önceden belirlediğiniz TP ve SL Değerlerini (o para biriminde) grafiklerde (işlem/sipariş satırına kapalı) gösterecek ve her sipariş için kar ve zararınızı tahmin etmenize çok yardımcı olacaktır. Ayrıca size PIP değerlerini de gösterir. gösterilen format "Kâr veya Zararımızın Döviz Değerleri / PIP değerlerimiz" şeklindedir. TP Değeri Yeşil Renkte ve SL Değeri Kırmızı Renkte gösterilecektir. Herhangi bir sorunuz veya daha fazla bilgi için lütfen fxlife.asia@hotma
Cumulative delta indicator As most traders believe, the price moves under the pressure of market buying or selling. When someone redeems an offer standing in the cup, the deal is a "buy". If someone pours into the bid standing in the cup - the deal goes with the direction of "sale". The delta is the difference between purchases and sales. A cumulative delta - the difference between the cumulative sum of purchases and sales for a certain period of time. It allows you to see who is currently contr
For a trader, trend is our friend. This is a trend indicator for MT5, can be used on any symbol. just load it to the terminal and you will see the current trend. green color means bullish trend and red means bearlish trend. you can also change the color by yourself when the indicator is loaded to the MT5 terminal the symbol and period is get from the terminal automaticly. How to use: I use this trend indicator on 2 terminals with different period  for the same symbol at same time. for example M5
Introduction to Chart Pattern MT Chart Pattern MT is a chart pattern scanner to detect the triangle pattern, falling wedge pattern, rising wedge pattern, channel pattern and so on. Chart Pattern MT uses highly sophisticated chart pattern detection algorithm. However, we have designed it in the easy to use with intuitive user interface. Chart Pattern MT will show all the patterns in your chart in the most efficient format for your trading. You do not have to do tedious manual pattern detection an
Your Trend Friend
Luigi Nunes Labigalini
The trend is your friend! Look at the color of the indicator and trade on that direction. It does not  repaint. After each candle is closed, that's the color of the trend. You can focus on shorter faster trends or major trends, just test what's most suitable for the symbol and timeframe you trade. Simply change the "Length" parameter and the indicator will automatically adapt. You can also change the color, thickness and style of the lines. Download and give it a try! There are big movements
HMA Trend Professional MT5
Pavel Zamoshnikov
4.4 (5)
Improved version of the free HMA Trend indicator (for MetaTrader 4) with statistical analysis. HMA Trend is a trend indicator based on the Hull Moving Average (HMA) with two periods. HMA with a slow period identifies the trend, while HMA with a fast period determines the short-term movements and signals in the trend direction. The main differences from the free version: Ability to predict the probability of a trend reversal using analysis of history data. Plotting statistical charts for analyz
To download MT4 version please click here . This is the exact conversion from TradingView: "WaveTrend [LazyBear]" By "zeusuk3". One of the coolest indicators out there to detect overbought and oversold zones. It can be used as a part of more complicated strategy and for confirming a potential trade setup. There are buffers to use in EAs also. The indicator is loaded light and non-repaint. - You can message in private chat for further changes you need. Thanks for downloading 
BoxChart MT5
Evgeny Shevtsov
5 (7)
The market is unfair if only because 10% of participants manage 90% of funds. An ordinary trader has slim changes to stand against these "vultures". This problem can be solved. You just need to be among these 10%, learn to predict their intentions and move with them. Volume is the only preemptive factor that faultlessly works on any timeframe and symbol. First, the volume appears and is accumulated, and only then the price moves. The price moves from one volume to another. Areas of volume accumu
Binary Options Assistant (BOA) Multi Currency Dashboard for Binary Options (MT5) . You can use any of the BOA Signals Indicators with the dashboard. Just change the BOA Signals Indicator Name in the dashboard settings to the indicator you want to get signals from. For example: CHILL. BLAZE:  BOA_BLAZE_Indicator_v1   Strategy :   BLW Online Trading Binary Options Strategy (3 Moving Average) LAVA:  BOA_LAVA_Indicator_v1   Strategy:   Lady Trader Binary Options Strategy (Bollinger Bands & Stoc
Düz ve trend belirleme göstergesi. Fiyat, iki histogramdan ve iki çizgiden (kırmızı ve mavi) herhangi birinin altındaysa, bu bir satış bölgesidir. Göstergenin bu sürümünü satın alırken, bir gerçek ve bir demo hesabı için MT4 sürümü - hediye olarak (almak için bana özel mesaj yazın)! Fiyat, iki histogramdan ve iki çizgiden (kırmızı ve mavi) herhangi birinin üzerindeyse, bu bir satın alma bölgesidir. MT4 versiyonu: https://www.mql5.com/en/market/product/3793 Fiyat iki satır arasında veya
PULLBACK HUNTER What is every trader's cherished dream? To see without delay the places where the reversal will happen. This, of course, is from the category of magic, though... nothing is impossible. But for now I've prepared for you an indicator that marks in real time the end of corrections to the current movement or in short - catches pullbacks.What is the main point? Many people practice rebounds when the price moves in the direction of the open position. And they do them on the formation o
Alpha Trend Pro
Eslam Mohamed Abdelrady Shehata
Alpha Trend Pro: Your Ultimate Trading Companion Embark on a new era of trading with Alpha Trend Pro Indicator. Crafted with precision and innovation, Alpha Trend is designed to elevate your trading experience by seamlessly blending powerful elements to navigate various market conditions. **Key Features:** **1. Dynamic Adaptability:**    - In sideways market conditions, Alpha Trend acts as a dead indicator. Say goodbye to many false signals and welcome a tool that adapts seamlessly to mar
Bu ürünün alıcıları ayrıca şunları da satın alıyor
Öncelikle belirtmek gerekir ki bu Ticaret Göstergesi Yeniden Çizim Yapmaz, Gecikmez ve Gecikme Göstermez, bu da hem manuel hem de robot ticareti için ideal hale getirir. Kullanıcı kılavuzu: ayarlar, girişler ve strateji. Atom Analisti, Piyasada Daha İyi Bir Avantaj Bulmak İçin Fiyatın Gücünü ve Momentumunu Kullanan PA Fiyat Hareketi Göstergesidir. Gürültüleri ve Yanlış Sinyalleri Kaldırmaya ve Ticaret Potansiyelini Artırmaya Yardımcı Olan Gelişmiş Filtrelerle Donatılmıştır. Birden fazla katmanl
Öncelikle, bu Ticaret Sistemi'nin Non-Repainting, Non-Redrawing ve Non-Lagging Göstergesi olduğunu vurgulamak önemlidir, bu da hem manuel hem de robot ticareti için ideal hale getirir. Online kurs, kılavuz ve ön ayarları indir. "Smart Trend Trading System MT5", yeni ve deneyimli tüccarlar için özelleştirilmiş kapsamlı bir ticaret çözümüdür. 10'dan fazla premium göstergeyi birleştiriyor ve 7'den fazla sağlam ticaret stratejisi sunuyor, bu da çeşitli piyasa koşulları için esnek bir seçim yapar. Tr
FX Volume MT5
Daniel Stein
4.94 (17)
Sabah Brifingimiz aracılığıyla ayrıntılar ve ekran görüntüleri ile günlük piyasa güncellemenizi alın burada mql5 ve on Telegram ! FX Volume, bir brokerin bakış açısından piyasa duyarlılığı hakkında GERÇEK bir fikir veren İLK ve TEK hacim göstergesidir. COT raporlarından çok daha hızlı bir şekilde, brokerlar gibi kurumsal piyasa katılımcılarının Forex piyasasında nasıl konumlandıklarına dair harika bilgiler sağlar. Bu bilgileri doğrudan grafiğinizde görmek, ticaretiniz için gerçek oyun değiştir
Tanıtım       Quantum Breakout PRO   , Breakout Bölgeleri ile ticaret yapma şeklinizi değiştiren çığır açan MQL5 Göstergesi! 13 yılı aşkın ticaret tecrübesine sahip deneyimli tüccarlardan oluşan bir ekip tarafından geliştirilmiştir.       Kuantum Breakout PRO       yenilikçi ve dinamik koparma bölgesi stratejisiyle ticaret yolculuğunuzu yeni zirvelere taşımak için tasarlanmıştır. Kuantum Breakout Göstergesi, size 5 kar hedefi bölgesi ile kırılma bölgelerinde sinyal okları ve kırılma kutusuna
Quantum Trend Sniper
Bogdan Ion Puscasu
5 (39)
Tanıtım       Kuantum Trend Keskin Nişancı Göstergesi   , trend tersine dönmeleri belirleme ve ticaret yapma şeklinizi değiştiren çığır açan MQL5 Göstergesi! 13 yılı aşkın ticaret tecrübesine sahip deneyimli tüccarlardan oluşan bir ekip tarafından geliştirilmiştir.       Kuantum Trend Keskin Nişancı Göstergesi       trend dönüşlerini son derece yüksek doğrulukla belirlemenin yenilikçi yolu ile ticaret yolculuğunuzu yeni zirvelere taşımak için tasarlanmıştır. ***Kuantum Trend Keskin Nişancı Gö
RelicusRoad Pro MT5
Relicus LLC
4.82 (22)
Şimdi 147 $ (birkaç güncellemeden sonra 499 $ 'a yükseliyor) - Sınırsız Hesaplar (PC'ler veya Mac'ler) RelicusRoad Kullanım Kılavuzu + Eğitim Videoları + Özel Discord Grubuna Erişim + VIP Durumu PİYASAYA BAKMAK İÇİN YENİ BİR YOL RelicusRoad, forex, vadeli işlemler, kripto para birimleri, hisse senetleri ve endeksler için dünyanın en güçlü ticaret göstergesidir ve yatırımcılara kârlı kalmaları için ihtiyaç duydukları tüm bilgileri ve araçları sağlar. Başlangıç ​​seviyesinden ileri seviyey
FX Power MT5 NG
Daniel Stein
5 (5)
Sabah Brifingimiz burada mql5 ve on Telegram! FX Power MT5 NG , uzun zamandır çok popüler olan döviz gücü ölçerimiz FX Power'ın yeni neslidir. Peki bu yeni nesil güç ölçer ne sunuyor? Orijinal FX Power hakkında sevdiğiniz her şey PLUS GOLD/XAU güç analizi Daha da hassas hesaplama sonuçları Ayrı ayrı yapılandırılabilir analiz dönemleri Daha da iyi performans için özelleştirilebilir hesaplama limiti Özel çokluDaha fazlasını görmek isteyenler için örnek ayarlar Her grafikte en sevdiğiniz renkler i
TPSpro TRENDPRO  - is a trend indicator that automatically analyzes the market and provides information about the trend and each of its changes, as well as giving signals for entering trades without redrawing! The indicator uses each candle, analyzing them separately. referring to different impulses - up or down impulse. Exact entry points into transactions for currencies, crypto, metals, stocks, indices!  -  Version MT4                  DETAILED DESCRIPTION        /       TRADING SETUPS       
A key element in trading is zones or levels from which decisions to buy or sell a trading instrument are made. Despite attempts by major players to conceal their presence in the market, they inevitably leave traces. Our task was to learn how to identify these traces and interpret them correctly. Reversal First Impulse levels (RFI)   -  Version MT4                  INSTRUCTIONS                 RUS                 ENG                         R ecommended to use with an indicator   -  TREND PRO  
Top indicator for MT5   providing accurate signals to enter a trade without repainting! It can be applied to any financial assets:   forex, cryptocurrencies, metals, stocks, indices .  Watch  the video  (6:22) with an example of processing only one signal that paid off the indicator! MT4 version is here It will provide pretty accurate trading signals and tell you when it's best to open a trade and close it. Most traders improve their trading results during the first trading week with the help of
Quantum Heiken Ashi PRO MT5
Bogdan Ion Puscasu
4.5 (8)
Quantum Heiken Ashi PRO ile   tanışın Pazar eğilimleri hakkında net bilgiler sağlamak üzere tasarlanan Heiken Ashi mumları, gürültüyü filtreleme ve yanlış sinyalleri ortadan kaldırma yetenekleriyle ünlüdür. Kafa karıştırıcı fiyat dalgalanmalarına veda edin ve daha sorunsuz, daha güvenilir bir grafik sunumuna merhaba deyin. Quantum Heiken Ashi PRO'yu gerçekten benzersiz kılan şey, geleneksel şamdan verilerini okunması kolay renkli çubuklara dönüştüren yenilikçi formülüdür. Kırmızı ve yeşil çubukl
Gartley Hunter Multi
Siarhei Vashchylka
5 (6)
Gartley Hunter Multi - An indicator for searching for harmonic patterns simultaneously on dozens of trading instruments and on all classic timeframes: (m1, m5, m15, m30, H1, H4, D1, Wk, Mn). Manual (Be sure to read before purchasing) | Version for MT4 Advantages 1. Patterns: Gartley, Butterfly, Shark, Crab. Bat, Alternate Bat, Deep Crab, Cypher 2. Simultaneous search for patterns on dozens of trading instruments and on all classic timeframes 3. Search for patterns of all possible sizes. Fr
This is arguably the most complete harmonic price formation auto-recognition indicator you can find for the MetaTrader Platform. It detects 19 different patterns, takes fibonacci projections as seriously as you do, displays the Potential Reversal Zone (PRZ) and finds suitable stop-loss and take-profit levels. [ Installation Guide | Update Guide | Troubleshooting | FAQ | All Products ] It detects 19 different harmonic price formations It plots primary, derived and complementary Fibonacci p
Advanced Supply Demand MT5
Bernhard Schweigert
4.53 (15)
Herhangi bir Acemi veya Uzman Tüccar için En İyi Çözüm! Bu gösterge benzersiz, yüksek kaliteli ve uygun fiyatlı bir ticaret aracıdır çünkü bir dizi tescilli özelliği ve yeni bir formülü bir araya getirdik. Bu güncelleme ile çift zaman dilimi dilimlerini gösterebileceksiniz. Yalnızca daha yüksek bir TF gösteremeyeceksiniz, aynı zamanda TF grafiğini ve ARTIK daha yüksek TF'yi de gösterebileceksiniz: YUVARLAK BÖLGELERİ GÖSTERMEK. Tüm Arz Talebi tüccarları buna bayılacak. :) Önemli Bilgiler Açıkland
MetaForecast M5
Vahidreza Heidar Gholami
5 (2)
MetaForecast, fiyat verilerindeki harmonileri kullanarak herhangi bir piyasanın geleceğini tahmin eder ve görselleştirir. Piyasa her zaman tahmin edilemezken, fiyatlarda bir desen varsa, MetaForecast geleceği mümkün olduğunca doğru bir şekilde tahmin edebilir. Benzer ürünlere göre, MetaForecast piyasa eğilimlerini analiz ederek daha kesin sonuçlar üretebilir. Giriş Parametreleri Past size (Geçmiş boyut) MetaForecast'ın gelecekteki tahminler oluşturmak için kullandığı çubuk sayısını belirtir. M
XQ Indicator MetaTrader 5
Marzena Maria Szmit
5 (1)
Step into the realm of Forex trading with confidence and precision using XQ, a cutting-edge Forex indicator designed to elevate your trading game to unprecedented heights. Whether you're a seasoned trader or just stepping into the world of currency exchange, XQ Forex Indicator empowers you with the insights and signals needed to make informed trading decisions. The signal conditions are a combination of three indicators, and XQ Forex Indicator only display  medium and long-term trends . The ind
Introducing the South African Sniper indicator created by a small group of traders with a few years trading trading the financial market profitably . This is a plug and play indicator that provides you with  BUY and SELL (SNIPER ENTRY) signals with TARGET and trail stops. The indicator Works with all MT5 trading instruments. The indicator uses previous  chart data as receipt to speculate on future market moves.
Golden Gate Algo MT5
James David Lane
4 (6)
CHRISTMAS İÇİN %40 İNDİRİM! 1 OCAK'TA FİYATI $250'YE YÜKSELECEK! GoldenGate Entries Tanıtımı: Keskin Kenarlı Bir Ticaret Çözümü! GoldenGate Entries (GGE) ile ticarette devrim niteliğinde bir yaklaşım keşfedin. GGE, ticaret deneyiminizi yükseltmek amacıyla tasarlanmış gelişmiş bir gösterge olup kullanıcılara ticaret kararlarında hassasiyet ve güven sağlamak için kapsamlı bir özellik seti sunar. Çiftler: Herhangi biri (FX - Emtia - Hisse Senetleri - Hisse Senetleri - Kripto) Zaman Çerçeve
FxaccurateLS
Shiv Raj Kumawat
WHY IS OUR FXACCCURATE LS MT5 THE PROFITABLE ? PROTECT YOUR CAPITAL WITH RISK MANAGEMENT Gives entry, stop and target levels from time to time. It finds Trading opportunities by analyzing what the price is doing during established trends. POWERFUL INDICATOR FOR A RELIABLE STRATEGIES We have made these indicators with a lot of years of hard work. It is made at a very advanced level. Established trends provide dozens of trading opportunities, but most trend indicators completely ignore them!
Yeni Başlayanlar veya Uzman Tüccarlar için En İyi Çözüm! Bu gösterge benzersiz, yüksek kaliteli ve uygun fiyatlı bir ticaret aracıdır çünkü bir dizi tescilli özellik ve gizli bir formül ekledik. Yalnızca BİR grafikle 28 döviz çiftinin tümü için Uyarılar verir. Yeni bir trendin veya scalping fırsatının tam tetik noktasını belirleyebildiğiniz için ticaretinizin nasıl gelişeceğini hayal edin! Yeni temel algoritmalar üzerine inşa edilen bu sistem, potansiyel işlemlerin belirlenmesini ve onaylan
The Volume by Price Indicator for MetaTrader 5 features Volume Profile and Market Profile TPO (Time Price Opportunity). Get valuable insights out of currencies, equities and commodities data. Gain an edge trading financial markets. Volume and TPO histogram bar and line charts. Volume Footprint charts. TPO letter and block marker charts including split structures. Versatile segmentation and compositing methods. Static, dynamic and flexible ranges with relative and/or absolute visualizations. Lay
Wolfe Waves are naturally occurring trading patterns present in all financial markets and represent a fight towards an equilibrium price. These patterns can develop over short and long-term time frames and are one of the most reliable predictive reversal patterns in existence, normally preceding strong and long price movements. [ Installation Guide | Update Guide | Troubleshooting | FAQ | All Products ] Clear trading signals Amazingly easy to trade Customizable colors and sizes Implements perfo
Royal Scalping Indicator M5
Vahidreza Heidar Gholami
5 (8)
Royal Scalping Indicator is an advanced price adaptive indicator designed to generate high-quality trading signals. Built-in multi-timeframe and multi-currency capabilities make it even more powerful to have configurations based on different symbols and timeframes. This indicator is perfect for scalp trades as well as swing trades. Royal Scalping is not just an indicator, but a trading strategy itself. Features Price Adaptive Trend Detector Algorithm Multi-Timeframe and Multi-Currency Trend Low
TrendMaestro5
Stefano Frisetti
note: this indicator is for METATRADER4, if you want the version for METATRADER5 this is the link:  https://www.mql5.com/it/market/product/108106 TRENDMAESTRO ver 2.4 TRENDMAESTRO recognizes a new TREND in the bud, he never makes mistakes. The certainty of identifying a new TREND is priceless. DESCRIPTION TRENDMAESTRO identifies a new TREND in the bud, this indicator examines the volatility, volumes and momentum to identify the moment in which there is an explosion of one or more of these data a
The TimeCycleCaptor indicator is an innovative tool for accurately visualizing the market trend and generating buy and sell signals. The market trend plays a key role in making trading decisions, and our indicator provides a reliable tool for determining it. We have made traders' dream of non-lagging moving averages come true in our indicator. TimeCycleCaptor is capable of predicting future values ​​and is designed to both identify the underlying trend and identify short-term buy or sell si
Owl Smart Levels MT5
Sergey Ermolov
4.49 (37)
MT4 versiyonu  |  FAQ Owl Smart Levels Indicator , Bill Williams'ın gelişmiş fraktalları , piyasanın doğru dalga yapısını oluşturan Valable ZigZag ve kesin giriş seviyelerini gösteren Fibonacci seviyeleri gibi popüler piyasa analiz araçlarını içeren tek gösterge içinde eksiksiz bir ticaret sistemidir. pazara ve kar elde edilecek yerlere. Stratejinin ayrıntılı açıklaması Gösterge ile çalışma talimatı Baykuş Yardımcısı ticaretinde Danışman Yardımcısı Kullanıcıların özel sohbeti -> Satın aldıktan
With Fixed Range Volume Profile,The traces left by the big players will not go unnoticed by you. Professional   Volume Profile   Indicator reveals Institutional order flow. This advanced market indicator will teach you to spot the buying and selling. Dont want to say more because its well known by most professionals  trader. This Indicator : -  Quickly Identify the Strongest Institutional S/R Zones. - W orks with all Trading Instruments (Forex, Futures, Indexes, Commodities, Stocks, Cryptocur
User Support Paid subscribers may request to join the WTGS Workshop @DB_WTI after emailing your Twitter handle and the proof of subscription to wtg.system.international@gmail.com . The System WTGS Navigator Saturn consists of six components: TrendFinder Saturn: Internal Trending   Confirmation   Titan: Internal Trending   Indicator Outer Ring: External Trending Indicator Inner Ring: External Trending Confirmation Data: The time-lapse of a trend on any given timeframe Disclaimers Although every
User Support Paid subscribers may request to join the WTGS Workshop   @DB_WTI after emailing your Twitter handle and the proof of subscription to   wtg.system.international@gmail.com . The System WTGS Navigator Overlay consists of two components: Dynamic Butterfly Footprints Overlay Disclaimers Although every effort has been made when designing WTGS Navigator Overlay, WTG makes no warranties, expressed or implied, or representations as to the accuracy or profitability of the system. WTG assume
"AV Forecast MT5" is a preview or forecast indicator for MetaTrader 5, which draws forecast future price changes on the chart based on historical data. To do this, it primarily uses the everyday rhythm and the seasonality of the year. For timeframes below H1 closer dates can be selected. The lines for calculation can be made visible. Settings: - Draw line for x candles: draw x candles in the future - Show all lines: yes/no - Look back years or mixed (> H1 same): one year back or less b
Yazarın diğer ürünleri
MetaTrader 5 için UR_TradeManager UR_TradeManager ile ticaret potansiyelinizi maksimize edin, bu araç özellikle MetaTrader 4 platformu için tasarlanmış nihai ticaret geliştirme aracıdır. Kesinlik ve işlevsellik düşünülerek yapılan bu kapsamlı araç, piyasa analizi, icraat ve yönetim becerilerini yükseltmeyi amaçlayan yatırımcılar için vazgeçilmezdir. Ana Özellikler: Görsel Ticaret Gösterge Paneli : MetaTrader 4 çalışma alanınıza entegre edilmiş sofistike bir gösterge panelinden doğrudan ticaretle
UR Control Panel
Krzysztof Jan Debski
5 (2)
UR Kontrol Paneli   UR Control Panel, sizinle ÜCRETSİZ olarak paylaşmak istediğim bir araçtır. Ticaretimde bana yardımcı olan ve her gün piyasa taramamı artıran etkileşimli bir Panel. Umarım ihtiyaçlarınıza da uygundur! UR Kontrol Paneli nasıl kullanılır? Hareket ettirilebilir, yeniden boyutlandırılabilir bir çift paneldir ve şunları içerir: - Bunlardan biri, verilen zaman dilimindeki para biriminin gücünü gösterir. - Diğeri, aynı grafiği kullanarak seçeneklerin semboller ve zaman dilimle
FREE
UR Basket
Krzysztof Jan Debski
Sepet   Yapabileceğiniz en iyi şey, siparişlerinizi kayıplara dönüşmekten korumaktır. Artık rahatlayabilir ve UR Basket'in halletmesine izin verebilirsiniz. UR Sepeti kullanmanın avantajları: Tüm parametreler grafiğinizdeki grafik panelinde dinamik olarak değiştirilebilir - Parametreleri değiştirmek veya hangi ayarları kullandığınızı hatırlamak için EA'yı yeniden başlatmanız GEREKMEZ! Siparişlerinizi şu adresten takip edebilirsiniz:   - Sihirli sayı   - EA Yorumu   - Yukarıdakilerin ikisi
UR Sapma Gözlemcisi   UR DivergenceSpotter, uzun yıllara dayanan deneyimin sonucudur ve bazen en kolay yollar en iyisidir. Birkaç gösterge arasında iyi bir korelasyon vardır, ancak bunlar uyumsuz olduğunda - fiyat "yeniden ayarlamaya" çalışır - ve işte o anda UR DivergenceSpotter ile bir sinyal alırız. UR Divergence Spotter kullanmanın avantajları: parametre yok Mum oluşturulduktan sonra yeniden boyanmaz Sinyal artık geçerli olmadığında sinyal verir (bu, işleminizi daha uzun süre tutabile
UR VolumeTrend
Krzysztof Jan Debski
UR Hacim Eğilimi   UR VolumeTrend, hacim olarak devam eden trendi gösteren en net hacim göstergesidir. Yerel zirveleri ve dipleri işaret etmek için UR TrendExhaustion gibi diğer göstergelerle mükemmel şekilde çalışır. Yalnızca 2 parametreyle sınırlıdır - değerler ne kadar yüksek olursa, o kadar uzun trendler gösterir. Aşırı gradyanlar, potansiyel bir tersine dönüşü yakalamak için hacmin olası tükenmelerini gösterir. İki satır - Hacim eğilimi ve Ortalama. En iyi avantaj: Kolay ve tüm varlıkl
UR TrendExhaustion
Krzysztof Jan Debski
UR TrendTükenme   UR TrendExhaustion, parametre değerleri veya diğer kurulumlarla uğraşmak istemeyen tüccarlar için en iyi çözümdür - herkes için hem kolay hem de görsel olarak anlaşılırdır. UR TrendExhaustion kullanmanın avantajları: parametre yok Grafikte neler olup bittiğini en iyi açıklayan 3 satırınız var: Trend Tükenme Hattı, Balina Para Hattı ve Perakende Para Hattı. Arayüz, her iki uçta da (kırmızı alanlar) herhangi bir satırın tükenmesini gösterir. En iyi avantaj: Kolay ve tüm va
UR HighsAndLows
Krzysztof Jan Debski
UR Yüksekler ve Düşükler   UR Highs&Lows, fiyat hareketinin ve oynaklığının derinlemesine bir analizini yapar ve fiyatın içinde hareket ettiği bir kanal oluşturur. Bu kanal artık bir osilatör olarak hareket ediyor ve potansiyel tükenmeleri ve olası tersine dönüşleri işaret etmek için fiyat sapması ile kaplanıyor. UR Yüksekler ve Düşükler kullanmanın avantajları: parametre yok Fiyat hareketini tanımlayan 3 çizginiz var - fiyatın ortalaması olan Beyaz Çizgi ve uç noktaları olan Mavi Çizgile
UR Momenter
Krzysztof Jan Debski
UR Momenteri   UR Momenter, bir osilatör olarak temsil edilen fiyat hareketinin tükenmesiyle ilişkili olarak fiyatın momentumunu mükemmel bir şekilde hesaplar. Bu nedenle, bu bize potansiyel geri dönüşlerin veya geri çekilmelerin gerçekten erken sinyallerini verir. Bu formül, 2018'de pazar balonu patladıktan sonra keşfedildi. UR Momenter kullanmanın avantajları: parametre yok Fiyat hareketini tanımlayan 2 çizginiz var - Fiyatın hareketli ortalama sapmasına bağlı olarak fiyatın Momentumu o
UR FrontEndBackEnd
Krzysztof Jan Debski
UR Ön UçArka Uç   UR FrontEndBackEnd, en doğru destek ve direnç seviyelerini bulmak için en sevdiğim formüldür. Ayrıca ne kadar güçlü olduklarını işaretlemek için bunları farklı kategorilere (kesikli çizgiler, düz çizgiler ve alanlar) ayırdım. Tümü arabelleklerde saklanır, böylece diğer araçlara kolayca erişilebilir ve uygulanabilir. Ek: Aracın uygulandığı varlığa göre ayarlanması gerekebilir - varlığın aracı etkileyen fiyattaki basamak sayısı farklılık gösterir. Bunun için gerekli parametr
UR Gamma
Krzysztof Jan Debski
UR Gama (Makine Öğrenimi sistemlerinde bulunan benzer hesaplamalarla desteklenir) UR Gamma, klasik WaveTrend göstergesine yeni ve geliştirilmiş bir bakış açısı sunan son teknoloji bir finansal analiz aracıdır. UR Gamma, gelişmiş Dijital Sinyal İşleme tekniklerini birleştirerek, geleneksel WaveTrend algoritmalarının bazı sınırlamalarını giderir ve fiyat hareketindeki eğilimleri belirlemeye ve ölçmeye yönelik daha doğru, sağlam ve dinamik bir yaklaşım sağlar. UR Gamma kullanmanın avantajları:
UR Bands
Krzysztof Jan Debski
UR Bantları (Makine Öğrenimi sistemlerinde kullanılan bir Formül ile) UR Bantları, prensip olarak makine öğrenimi sistemlerinde kullanılanlara benzer olan piyasa oynaklığını içeren bir formül aracılığıyla türetilen bir göstergedir. Piyasa koşullarının bu matematiksel temsili, finansal piyasaların doğasında var olan oynaklığı hesaba katarak, fiyat eğilimlerinin ve dinamiklerinin kesin bir analizini sunar. Volatiliteyi bir değişken olarak dahil eden gösterge, piyasa koşullarının daha doğru ve g
UR Vortex
Krzysztof Jan Debski
UR Vortex The Probabilistic UR Vortex Formula: An Accurate System for Predictive Market Analysis using Volatility and Standard Deviation Calculations. The   UR Vortex   indicator is a technical analysis tool that uses volatility and standard deviation calculations to predict potential tops and bottoms in a market. It measures the strength of a trend by calculating the distance between the current price and a moving average, and then standardizing this distance by dividing it by the average true
UR PulseScalp
Krzysztof Jan Debski
UR PulseScalp  Hızlı tempolu piyasalarda en üst noktayı arayan kazıyıcılar için kalibre edilmiş bir ticaret göstergesi UR PulseScalp , hızlı tempolu pazarlarda en üst noktayı arayan kazıyıcılar için son teknoloji bir ticaret çözümüdür. Bu yenilikçi gösterge, son derece doğru ve güvenilir bir sinyal oluşturmak için Volatilite, MoneyFlow ve Relative Strength'in gücünü harmanlayan bilimsel olarak kalibre edilmiş bir formül üzerine kurulmuştur. UR PulseScalp kullanmanın avantajları: Konforlu
MetaTrader 4 için UR_TradeManager UR_TradeManager ile ticaret potansiyelinizi maksimize edin, bu araç özellikle MetaTrader 4 platformu için tasarlanmış nihai ticaret geliştirme aracıdır. Kesinlik ve işlevsellik düşünülerek yapılan bu kapsamlı araç, piyasa analizi, icraat ve yönetim becerilerini yükseltmeyi amaçlayan yatırımcılar için vazgeçilmezdir. Ana Özellikler: Görsel Ticaret Gösterge Paneli : MetaTrader 4 çalışma alanınıza entegre edilmiş sofistike bir gösterge panelinden doğrudan ticaretle
Sepet   Yapabileceğiniz en iyi şey, siparişlerinizi kayıplara dönüşmekten korumaktır. Artık rahatlayabilir ve UR Basket'in halletmesine izin verebilirsiniz. UR Sepeti kullanmanın avantajları: Tüm parametreler grafiğinizdeki grafik panelinde dinamik olarak değiştirilebilir - Parametreleri değiştirmek veya hangi ayarları kullandığınızı hatırlamak için EA'yı yeniden başlatmanız GEREKMEZ! Siparişlerinizi şu adresten takip edebilirsiniz:   - Sihirli sayı   - EA Yorumu   - Yukarıdakilerin ikisi
UR VolumeTrend MT5
Krzysztof Jan Debski
UR Hacim Eğilimi   UR VolumeTrend, hacim olarak devam eden trendi gösteren en net hacim göstergesidir. Yerel zirveleri ve dipleri işaret etmek için UR TrendExhaustion gibi diğer göstergelerle mükemmel şekilde çalışır. Yalnızca 2 parametreyle sınırlıdır - değerler ne kadar yüksek olursa, o kadar uzun trendler gösterir. Aşırı gradyanlar, potansiyel bir tersine dönüşü yakalamak için hacmin olası tükenmelerini gösterir. İki satır - Hacim eğilimi ve Ortalama. En iyi avantaj: Kolay ve tüm varlıkl
UR TrendTükenme   UR TrendExhaustion, parametre değerleri veya diğer kurulumlarla uğraşmak istemeyen tüccarlar için en iyi çözümdür - herkes için hem kolay hem de görsel olarak anlaşılırdır. UR TrendExhaustion kullanmanın avantajları: parametre yok Grafikte neler olup bittiğini en iyi açıklayan 3 satırınız var: Trend Tükenme Hattı, Balina Para Hattı ve Perakende Para Hattı. Arayüz, her iki uçta da (kırmızı alanlar) herhangi bir satırın tükenmesini gösterir. En iyi avantaj: Kolay ve tüm va
UR HighsAndLows MT5
Krzysztof Jan Debski
UR Yüksekler ve Düşükler   UR Highs&Lows, fiyat hareketinin ve oynaklığının derinlemesine bir analizini yapar ve fiyatın içinde hareket ettiği bir kanal oluşturur. Bu kanal artık bir osilatör olarak hareket ediyor ve potansiyel tükenmeleri ve olası tersine dönüşleri işaret etmek için fiyat sapması ile kaplanıyor. UR Yüksekler ve Düşükler kullanmanın avantajları: parametre yok Fiyat hareketini tanımlayan 3 çizginiz var - fiyatın ortalaması olan Beyaz Çizgi ve uç noktaları olan Mavi Çizgile
UR Momenter MT5
Krzysztof Jan Debski
UR Momenteri   UR Momenter, bir osilatör olarak temsil edilen fiyat hareketinin tükenmesiyle ilişkili olarak fiyatın momentumunu mükemmel bir şekilde hesaplar. Bu nedenle, bu bize potansiyel geri dönüşlerin veya geri çekilmelerin gerçekten erken sinyallerini verir. Bu formül, 2018'de pazar balonu patladıktan sonra keşfedildi. UR Momenter kullanmanın avantajları: parametre yok Fiyat hareketini tanımlayan 2 çizginiz var - Fiyatın hareketli ortalama sapmasına bağlı olarak fiyatın Momentumu o
UR Ön UçArka Uç   UR FrontEndBackEnd, en doğru destek ve direnç seviyelerini bulmak için en sevdiğim formüldür. Ayrıca ne kadar güçlü olduklarını işaretlemek için bunları farklı kategorilere (kesikli çizgiler, düz çizgiler ve alanlar) ayırdım. Tümü arabelleklerde saklanır, böylece diğer araçlara kolayca erişilebilir ve uygulanabilir. Ek: Aracın uygulandığı varlığa göre ayarlanması gerekebilir - varlığın aracı etkileyen fiyattaki basamak sayısı farklılık gösterir. Bunun için gerekli parametr
UR Gamma MT5
Krzysztof Jan Debski
UR Gama (Makine Öğrenimi sistemlerinde bulunan benzer hesaplamalarla desteklenir) UR Gamma, klasik WaveTrend göstergesine yeni ve geliştirilmiş bir bakış açısı sunan son teknoloji bir finansal analiz aracıdır. UR Gamma, gelişmiş Dijital Sinyal İşleme tekniklerini birleştirerek, geleneksel WaveTrend algoritmalarının bazı sınırlamalarını giderir ve fiyat hareketindeki eğilimleri belirlemeye ve ölçmeye yönelik daha doğru, sağlam ve dinamik bir yaklaşım sağlar. UR Gamma kullanmanın avantajları:
UR Bands MT5
Krzysztof Jan Debski
UR Bantları (Makine Öğrenimi sistemlerinde kullanılan bir Formül ile) UR Bantları, prensip olarak makine öğrenimi sistemlerinde kullanılanlara benzer olan piyasa oynaklığını içeren bir formül aracılığıyla türetilen bir göstergedir. Piyasa koşullarının bu matematiksel temsili, finansal piyasaların doğasında var olan oynaklığı hesaba katarak, fiyat eğilimlerinin ve dinamiklerinin kesin bir analizini sunar. Volatiliteyi bir değişken olarak dahil eden gösterge, piyasa koşullarının daha doğru ve g
UR Vortex MT5
Krzysztof Jan Debski
UR Vortex MT5 The Probabilistic UR Vortex Formula: An Accurate System for Predictive Market Analysis using Volatility and Standard Deviation Calculations. The UR Vortex MT5 indicator is a technical analysis tool that uses volatility and standard deviation calculations to predict potential tops and bottoms in a market. It measures the strength of a trend by calculating the distance between the current price and a moving average, and then standardizing this distance by dividing it by the average
UR PulseScalp MT5
Krzysztof Jan Debski
UR PulseScalp MT5 Hızlı tempolu piyasalarda en üst noktayı arayan kazıyıcılar için kalibre edilmiş bir ticaret göstergesi UR PulseScalp MT5, hızlı tempolu pazarlarda en üst noktayı arayan kazıyıcılar için son teknoloji bir ticaret çözümüdür. Bu yenilikçi gösterge, son derece doğru ve güvenilir bir sinyal oluşturmak için Volatilite, MoneyFlow ve Relative Strength'in gücünü harmanlayan bilimsel olarak kalibre edilmiş bir formül üzerine kurulmuştur. UR PulseScalp MT5 kullanmanın avantajları:
Filtrele:
İnceleme yok
İncelemeye yanıt
Sürüm 4.0 2022.07.22
Updated Credentials.