FORTS Total Orders
- Göstergeler
- Dmitriy Skub
- Sürüm: 1.5
- Güncellendi: 1 Aralık 2021
- Etkinleştirmeler: 5
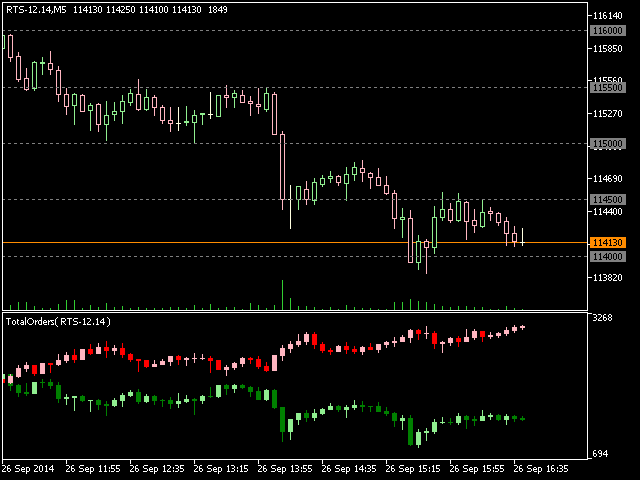
This indicator shows the ratio of the number of buyers'/sellers' orders for the Russian FORTS futures market. Now, you can receive this information in real time in your МetaТrader 5 terminal. This allows you to develop brand new trading strategies or improve the existing ones.
The data on the ratio of the orders number is received from the database (text CSV or binary one at user's discretion). Thus, upon completion of a trading session and disabling the terminal (or PC), the data is saved and uploaded to the chart when the terminal is re-launched.
You can use FORTS All Saver or any other utility that saves data in the same format to keep the database of the ratio of the orders number.
The ratio of the number of orders is displayed in the form of two candlestick charts (for buyers and sellers). The minimum allowable timeframe is М1 (one minute). Thus, you can see the changes of the ratio of the number of orders inside the bar and examine its dynamics in comparison with the neighboring bars.
Settings
Use CSV-file: Yes - the history is taken from a CSV file; No - the history is taken from a binary file. Naturally, the file must be available in the terminal directory.
Use Common Directory: Yes - use the common folder of all terminals for accessing the history database; No - each MT5 terminal installed in the system uses its own directory: "MQL5\Files\TotalOrders".
File Name Prefix - prefix for forming the file name. The file name is formed of a prefix, BUY/SELL attribute, symbol name and extension. For example: "TotalOrdersBUY-GAZR-6.14.CSV". If an empty line is set as a prefix, the default 'TotalOrders' prefix is used.
History Show Period - history period displayed on the chart. It can be set from one day (trading day) to one year and does not depend on the chart's timeframe. Of course, the history should be physically present in the user PC's appropriate directory.
Chart Color Schema - indicator's color scheme. It can be selected from the list - dark colors, light colors, alternate light colors, white on black and black on white.
Show Values on Chart - show/hide the current Open/High/Low/Close values as digits in the indicator window.
Proposal for interested users:
If you have ideas for improvement of this or any of my other products, please write me. You will get a big discount for any of my products if the idea is realized.
Please write all your suggestions on the Comments tab of this page, so we can have a documentary proof of the ideas and see who the first author is.

