Netsrac Correlation Trade Indicator MT5
- Göstergeler
- Carsten Pflug
- Sürüm: 2.20
- Güncellendi: 3 Haziran 2021
- Etkinleştirmeler: 9
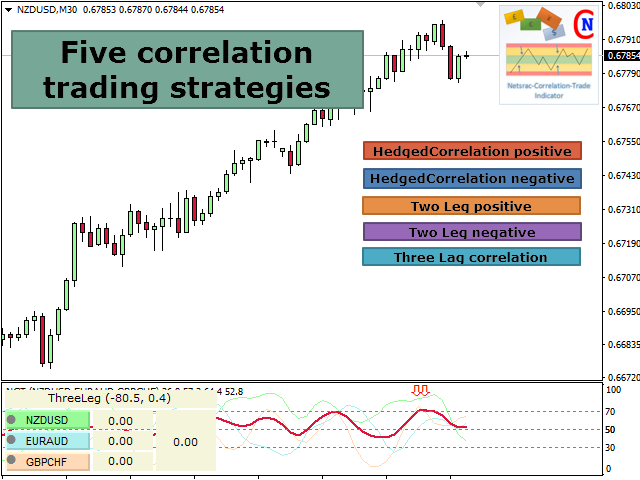
The Netsrac Correlation Trade Indicator (NCTI) was created to trade correlations between different assets. NCTI offers five different strategies to do this.
- Five different correlation trading strategies with two or three assets
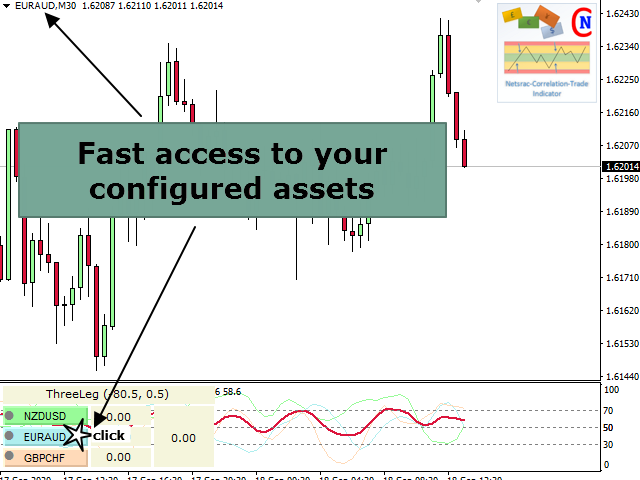
- Fast access your assets with one click via asset buttons
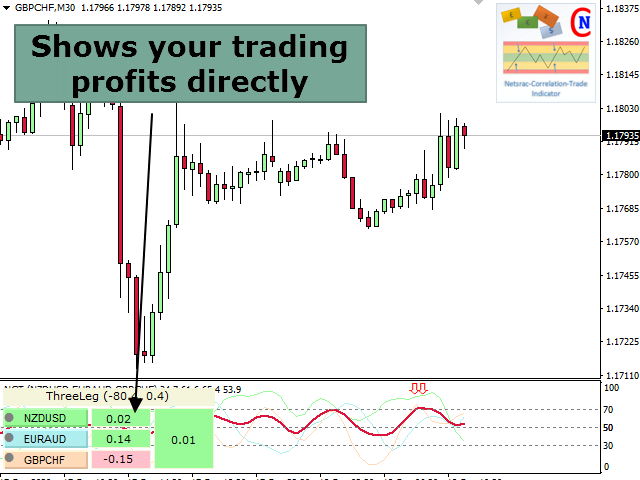
- Your profit/loss at a glance
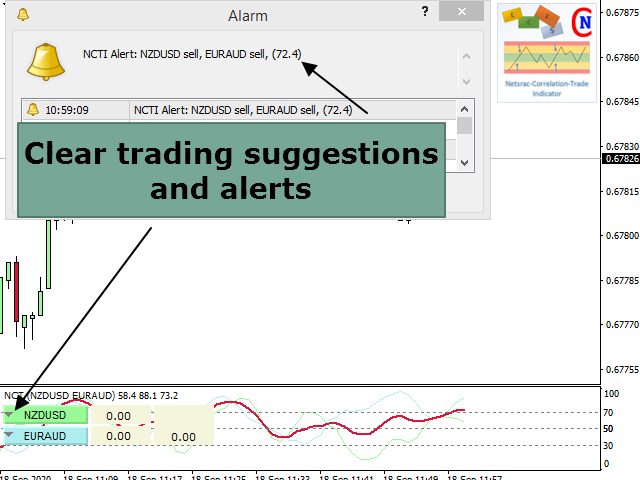
- Configurable alerts via screen or mobile
You can use the indicator with every timeframe. Higher timeframes give fewer but better signals.
If you have some questions or suggestions - please feel free to contact me. To better understand the controls and the principle behind the indicator, please read the blog entry at https://www.mql5.com/en/blogs/post/739727.
If you want to have a overview to all correlations, look at my Correlation Dashboard (for MT4 only at the moment).
How to use the indicator (Short explainer)
1. Search for correlated pairs (you can do that easily with my Correlation Dashboard (for MT4 only at the moment) or with some Internet correlation tools (eg myFXbook)
2. Install the indicator on one chart
3. Add the second (and third for ThreeLeg strategy) correlated pair
4. Configure Alerts
5. Wait for signals from the indicator - if the indicator suggest a trade, look for good entrys and do the trade ...
Don´t forget to read my blog entry at https://www.mql5.com/en/blogs/post/739727.