Extended Keltner Channel MT5
- Göstergeler
- Sergey Efimenko
- Sürüm: 1.6
- Güncellendi: 25 Mart 2020
- Etkinleştirmeler: 10
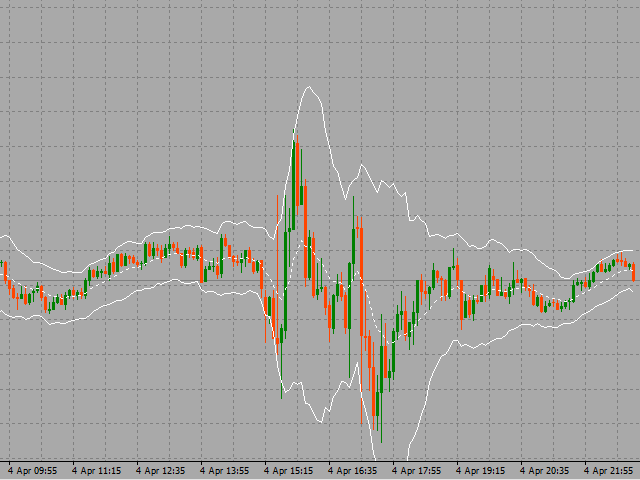
"Keltner Kanalı" göstergesinin genişletilmiş versiyonu. Bu, fiyat pozisyonunun oynaklığına göre oranını belirlemenizi sağlayan analitik bir araçtır.
Göstergenin orta çizgisini hesaplamak için 26 çeşit hareketli ortalama ve 11 fiyat seçeneği kullanabilirsiniz. Fiyat, kanalın üst veya alt sınırına dokunduğunda yapılandırılabilir uyarılar sizi bilgilendirecektir.
Mevcut ortalama türleri: Basit Hareketli Ortalama, Üstel Hareketli Ortalama, Wilder Üstel Hareketli Ortalama, Doğrusal Ağırlıklı Hareketli Ortalama, Sinüs Ağırlıklı Hareketli Ortalama, Üçgen Hareketli Ortalama, En Küçük Kare Hareketli Ortalama (veya EPMA, Doğrusal Regresyon Doğrusu), Düzgünleştirilmiş Hareketli Ortalama, Gövde Hareketli Alan Hull tarafından Ortalama, Sıfır Gecikmeli Üstel Hareketli Ortalama, Çift Üstel Hareketli Ortalama, Patrick Mulloy, T3, T. Tillson, Anlık Trend Çizgisi, J.Ehlers, Hareketli Medyan, Geometrik Ortalama, Düzenlileştirilmiş EMA, Chris Satchwell, Integral of Lineer Regresyon Eğimi , LSMA ve ILRS'nin kombinasyonu, J.Ehlers tarafından genelleştirilmiş Üçgen Hareketli Ortalama, Hacim Ağırlıklı Hareketli Ortalama, Mark Jurik tarafından Yumuşatma.
Hesaplama fiyat seçenekleri: Kapanış, Açılış, Yüksek, Düşük, Medyan Fiyat = (Yüksek + Düşük)/2, Tipik Fiyat = (Yüksek + Düşük + Kapanış)/3, Ağırlıklı Kapanış = (Yüksek + Düşük + Kapanış * 2)/4 , Heiken Ashi Close, Heiken Ashi Open, Heiken Ashi High, Heiken Ashi Low.
Parametreler:- PeriodMA - kanalın orta çizgisinin periyodu
- MethodMA - kanal merkez hattı yumuşatma yöntemi
- PriceMA - hesaplama için kullanılan fiyat
- PeriodATR - ATR göstergesinin süresi
- MulATR - ATR göstergesinin çarpanı
- ShiftMA - kanalı grafikte ileri / geri kaydır
- AddDigits - ondalık noktadan sonra rakamlardaki gösterge okumalarının doğruluğunda ek artış
- AlertOnUpTouch - üst kanal çizgisine dokunduğunuzda uyarıları etkinleştirin / devre dışı bırakın
- AlertOnDnTouch - alt kanal hattına dokunduğunuzda uyarıları etkinleştirin / devre dışı bırakın
- EnableAlertMessage - bir metin mesajının görüntülenmesini etkinleştirin / devre dışı bırakın
- EnableAlertNotification - mobil terminallere bildirim göndermeyi etkinleştirin / devre dışı bırakın
- EnableAlertSound - sesli bildirimi etkinleştir / devre dışı bırak
- AlertUpSoundFileName - üst kanal satırına dokunulduğunda bildirim için ses dosyasının adı
- AlertDnSoundFileName - alt kanal hattına dokunulduğunda bildirim için ses dosyasının adı
Kullanıcı incelemeye herhangi bir yorum bırakmadı