• Genel bakış
  • İncelemeler (2)
  • Yorumlar
  • Yenilikler

OneKey DeleteOrder

I see that many tools in the market deal with Position and Order in the form of operation panels. Which is loaded into a Chart in the form of an EA.

However, once the operator panel EA is loaded, no other EAs can be loaded. So, I wrote the one-click operation of Position and Order as a script, so you can load other EAs and easily complete one-click operation of Trade.

1. What is this:

This is a one-click script to delete the pending order.

Now you can delete pending tickets at high speed, for example 1000 pending tickets can be deleted instantaneously.

2. Function:

There are many ways to filter:
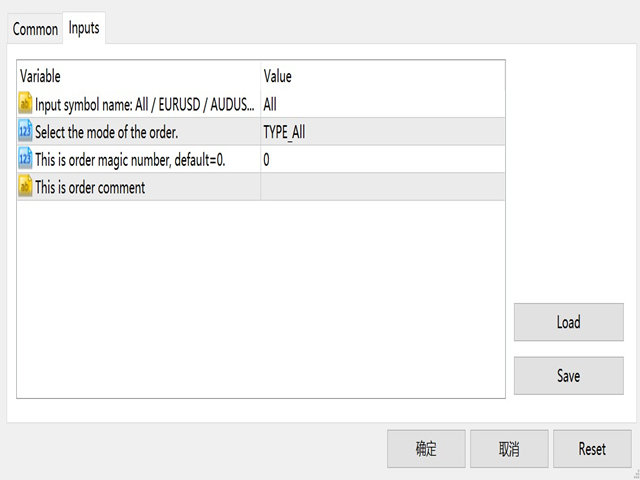
  • You can choose the symbol of the pending order.  Default is All.
  • You can choose the type of pending order, Default is All.
  • You can enter magci number, the default is 0.
  • You can enter comment, the default is "".
3. Parameters:
  • Input string ForexName="All";                            //Input symbol name: All / EURUSD / AUDUSD / ...
  • Input Enum_OrderType Type_Order=TYPE_All;    //Select the mode of the order.
  • Input int MAGICNUM=0;                                     //This is order magic number, default=0.
  • Input string COMMENT="";                                  //This is order comment
  • Input bool HighSpeed=true; //True represents high speed execution
Thanks for using!


Önerilen ürünler
This non-trading expert utilizes so called   custom symbols   feature to build renko charts based on history of real ticks of selected standard symbol. RenkoFromRealTicks generates custom symbol quotes, thus you may open many charts to apply different EAs and indicators to the renko. It also transmits real ticks to update renko charts in real time. This is a functionally limited demo version of  RenkoFromRealTicks . RenkoFromRealTicks utility can not work in the tester because it uses CustomSym
FREE
Bonus when buying an indicator or an advisor from my list. Write to me in private messages to receive a bonus. Manual Assistant MT5 is a professional manual trading tool that will make your trading fast and comfortable. It is equipped with all the necessary functions that will allow you to open, maintain and close orders and positions with one click. It has a simple and intuitive interface and is suitable for both professionals and beginners. The panel allows you to place buy and sell orders
FREE
Are you tired of drawing trendlines every time you're analyzing charts? Or perhaps you would like more consistency in your technical analysis. Then this is for you. This indicator will draw trend lines automatically when dropped on a chart. How it works Works similar to standard deviation channel found on mt4 and mt5. It has 2 parameters: 1. Starting Bar 2. Number of bars for calculation The   starting bar   is the bar which drawing of the trend lines will begin, while the   number of bars for c
FREE
Renko Builder GLX1
Eranga Thilina Dhanushka Gallage
GLX1 Renko Builder   Expert Advisor (EA) can create the Renko bar charts on any symbol. The Renko charts are generated as real-time custom symbol charts which can be further used for technical analysis with any MT5 compatible indicator.  Find the free   GLX1 Renko Euro   Expert Advisor from here.  https://www.mql5.com/en/market/product/115074 Included Features: Truly responsive Renko Charting on a custom symbol chart Accurate automatic live chart update Ability to attach any MT5 indicator
Renko Chart
Marcin Konieczny
4.27 (11)
This indicator allows to display Renko charts in the indicator window. Renko charts show only price movements that are bigger than the specified box size. It helps to eliminate noise and allows to focus on main trends. Time is not a factor here. Only price movements are taken into account. That's why Renko chart is not synchronized with the main chart it is attached to. Indicator works in two modes: CLOSE - only close prices are taken into account while building the chart HIGH_LOW - only high/
FREE
Renko Plus
Eadvisors Software Inc.
With Renko Plus you can use the features in the Indicator functionality, just add it to the Metatrader5 chart.             The Renko chart is a type of chart, developed by the Japanese, that is constructed using price movement rather than standardized prices and time intervals like most charts. It is believed to be named after the Japanese word for bricks, "renga", as the graphic looks like a series of bricks.             A new brick is created when the price moves a specified p
A professional tool for trading - the divergence indicator between the  RVI and the price, which allows you to receive a signal about a trend reversal in a timely manner or catch price pullback movements (depending on the settings). The indicator settings allow you to adjust the strength of the divergence due to the angle of the  RVI peaks and the percentage change in price, which makes it possible to fine-tune the signal strength. The indicator code is optimized and is tested very quickly as p
FREE
Trend Yakalayıcı: Alarm İndikatörü ile Trend Yakalayıcı Stratejisi, piyasa trendlerini ve potansiyel giriş ve çıkış noktalarını belirlemede yardımcı olan çok yönlü bir teknik analiz aracıdır. Piyasa koşullarına uyum sağlayarak trend yönünün net görsel temsili için dinamik bir Trend Yakalayıcı Stratejisi sunar. Tüccarlar tercihlerine ve risk toleranslarına göre parametreleri özelleştirebilirler. Gösterge, trendleri tanımlamaya yardımcı olur, potansiyel ters dönüşleri sinyaller, trailing stop m
FREE
Order Book, known also as Market Book, market depth, Level 2, - is a dynamically updated table with current volumes of orders to buy and to sell specific financial instument at price levels near Bid and Ask. MetaTrader 5 provides the means for receiving market book from your broker, but in real time only, without access to its history. The indicator OrderBook Cumulative Indicator accumulates market book data online and visualizes them on the chart. In addition, the indicator can show the market
Account Info EA It is a tool that presents on the graph all the positions of the account, and specific information concerning the positions, but also the account. It enables the user to have an image of his account at a glance. Use like any expert advisor. You can't attach it in the same chart with other expert advisor. It does not have the ability to open or manage positions. You can attach it on any chart and any timeframe.
FREE
VR Renk Seviyeleri, trend çizgisi, dikdörtgen ve metin gibi unsurları kullanarak teknik analiz uygulayanlar için kullanışlı bir araçtır. Grafiğe doğrudan metin eklemek ve ekran görüntüsü almak mümkündür. Ayarlar, set dosyaları, demo versiyonları, talimatlar, problem çözme, adresinden edinilebilir. [Blog] İncelemeleri şu adresten okuyabilir veya yazabilirsiniz: [bağlantı] Sürümü [MetaTrader 4] Göstergeyle çalışma tek tıklamayla gerçekleştirilir. Bunu yapmak için, çizginin bulunduğu düğmeye tı
FREE
Gino Renko
Stephane, Andr Valette
1 (1)
Another renko-based indicator. It returns different usable values ​​for an EA, and is directly displayed on the main chart. Its setting is very simple: The size of the renko The number of bars taken into account The falling color The color on the rise Returned values: Buffer 0 : Value of the middle Buffer 1 : Value of the Top Buffer 2 : Value of the Bottom Buffer 3 : Direction of renko (0.0 for top ; 1.0 for bottom) Buffer 4 : Ratio of the renko, for example, if it is twice, 3 times, ro more of
Important Lines
Terence Gronowski
4.88 (26)
This indicator displays Pivot-Lines, preday high and low, preday close and the minimum and maximum of the previous hour. You just have to put this single indicator to the chart to have all these important lines, no need to setup many single indicators. Why certain lines are important Preday high and low : These are watched by traders who trade in a daily chart. Very often, if price climbs over or falls under a preday low/high there is an acceleration in buying/selling. It is a breakout out of
FREE
This indicator will mirror the assets in use in another metatrader, being able to choose the timeframe and a template. This is the Metatrader 5 Client, it needs the Metatrader 4 or 5 Server versions: Metatrader 4 Mirror Chart Server:   https://www.mql5.com/en/market/product/88644 Metatrader 5 Mirror Chart Server: https://www.mql5.com/en/market/product/88652 Details of how it works in the video.
FREE
Highly configurable Adx indicator. Features: Highly customizable alert functions (at levels, crosses, direction changes via email, push, sound, popup) Multi timeframe ability Color customization (at levels, crosses, direction changes) Linear interpolation and histogram mode options Works on strategy tester in multi timeframe mode (at weekend without ticks also) Adjustable Levels Parameters: ADX   Timeframe:  You can set the lower/higher timeframes for Adx. ADX   Bar Shift:   you can set the
FREE
I see that many tools in the market deal with Position and Order in the form of operation panels. Which is loaded into a Chart in the form of an EA. However, once the operator panel EA is loaded, no other EAs can be loaded. So, I wrote the one-click operation of Position and Order as a script, so you can load other EAs and easily complete one-click operation of Trade. 1. What is this: This is a one-click script to close position order. Now you can close position tickets at high speed, for examp
Market Profile 3 ForexArby com
Hussien Abdeltwab Hussien Ryad
4.17 (12)
Market Profile 3 MetaTrader 5 indicator  version 4.70— is a classic Market Profile implementation that can show the price density over time, outlining the most important price levels, value area, and control value of a given trading session. This indicator can be attached to timeframes between M1 and D1 and will show the Market Profile for daily, weekly, monthly, or even intraday sessions. Lower timeframes offer higher precision. Higher timeframes are recommended for better visibility. It is als
FREE
Gm Volumes
Antonio Augusto Barreto De Melo
4.2 (5)
A simple volume indicator according to the color of the candle! - Custom background! - Supports Volume by Ticks or Real Volume. The original Metatrader Volume indicator does not show the colors of the bar according to the color of the Candle, it only changes color when the volume of a candle is greater than the previous one, this sometimes creates confusion for beginners and does not know the real reason for the color change. Free indicator, support may take a while to respond!
FREE
ChartPan
Leandro Rodrigo Giron
Hey Trader! Boring with the Meta chart? Do you want to move it as you do in Profit? Your problems are over! Now available   Chart Panoramic   or   ChartPan   for closer friends, a utility that allows you to move the chart to better visualize the most relevant points for your trade. Recommend you to add a keyboard shortcut for quick access (Ctrl + Q - for example), because you will need to run   ChartPan   after symbol changing to "release" the chart again. To add a hotkey: after downloa
FREE
A professional tool for trading - the divergence indicator between the WPR and the price, which allows you to receive a signal about a trend reversal in a timely manner or catch price pullback movements (depending on the settings). The indicator settings allow you to adjust the strength of the divergence due to the angle of the WPR peaks and the percentage change in price, which makes it possible to fine-tune the signal strength. The indicator code is optimized and is tested very quickly as par
FREE
RSI Divergence F
Andrey Dik
4.67 (6)
A professional tool for trading - the divergence indicator between the RSI and the price, which allows you to receive a signal about a trend reversal in a timely manner or catch price pullback movements (depending on the settings). The indicator settings allow you to adjust the strength of the divergence due to the angle of the RSI peaks and the percentage change in price, which makes it possible to fine-tune the signal strength. The indicator code is optimized and is tested very quickly as par
FREE
Data Extractor (DE) is designed to extract symbol price movement data and save it to file. It's a simple tool, designed to be used in combination with other software. SETTINGS (INPUTS) Period_in_days - How many days of data for Data Extractor to process (including non-work days).  File extension - Defines the type of file in which data will be saved. CSV is readable for a human, HST and BIN are binary data intended for machine reading. File name (without extension) - User defined part of file
FREE
The   Close script   is a simple tool that allows traders to close their trades by three methods. Just run the script and choose the close method. Closing methods Symbol  - Allows closing all open trades for a specific symbol. All_Trades  - Allows closing all open trades. Magic_Number  - Allows closing all open trades according to their magic number. Recommendation AutoTrading functions must be activated.  If the AutoTrading function is disabled, the script will not work. EA should be stopped
FREE
Size Bars
Viktor Loginov
Size Bars – индикатор отображает на графике максимальный, минимальный, текущий и средний размер баров (свечей) за выбранный период. Отображаемые параметры индикатора Size Bars: 1)       Текущий размер бара в писах (по максимум/минимум, тело бара). 2)       Максимальный, минимальный и средний размер свечей BUY . 3)       Максимальный, минимальный, средний размер свечей SELL . 4)       Количество свечей BUY и количество свечей SELL . 5)       Среднее количество свечей подряд BUY и SELL . 6)    
BoletaMiniPanel
PATRICK ANTONIO MORELO A.
5 (5)
Simple panel with  Stop loss (Loss), Stop gain (Gain) , Trailing stop (TS) and Breakeven (BE-P). Lot is the number of contracts to be traded. Gain is the number, in points, that the stop gain will be positioned. If you don't want to put stop gain, just put 0 (zero) in place and when you open the order it won't have this stop. Loss is the number, in points, that the stop loss will be placed. If you don't want to put stop loss, just put 0 (zero) in place and when you open the order it won't
FREE
Minimalist and fully customizable info panel. It works on any chart and timeframe, with 2 - 4 digits brokers and with 3 - 5 digits ones. It can show: Current Spread in pips (1 decimal digit if you are on a 3 - 5 digits broker) ATR (Average True Range) in pips Current Server Time Current GMT Time Important Account Info: Current Leverage and Stop-out Level (%) Time left for the current bar. Very useful on 4 h charts All info labels have a tooltip with the same data Available customizations : En
FREE
The Rayol Code Hour Interval Lines indicator was  designed to assist your trading experience.  It  draws the range of hours chosen by the user directly on the chart, so that it enables traders to visualize price movements during their preferred trading hours, providing  traders a more comprehensive view of price movements and market dynamics. This indicator allows the user to choose not only the Broker's time, but also the Local time. This way, the user no longer needs to calculate local time in
FREE
RenkoChart EA
Paulo Henrique Da Silva
4 (1)
The RenkoChart tool presents an innovative and highly flexible approach to visualizing market data in MetaTrader 5. This expert creates a custom symbol with Renko bricks directly on the chart, displaying accurate prices at the respective opening date/time for each brick. This feature makes it possible to apply any indicator to the Renko chart. Furthermore, this tool also allows access to historical brick data through native methods in the MQL5 programming language, such as iOpen, iHigh, iLow and
FREE
Follow The Line MT5
Oliver Gideon Amofa Appiah
4.4 (30)
This indicator obeys the popular maxim that: "THE TREND IS YOUR FRIEND" It paints a GREEN line for BUY and also paints a RED line for SELL. (you can change the colors). It gives alarms and alerts of all kinds. IT DOES NOT REPAINT and can be used for all currency pairs and timeframes. Yes, as easy and simple as that. Even a newbie can use it to make great and reliable trades. NB: For best results, get my other premium indicators for more powerful and reliable signals. Get them here: https://www.m
FREE
LT Rainbow Trend
Thiago Duarte
5 (1)
Do you, like me, like to trade with the trend? Then this indicator will help you! Rainbow Trend is a trend indicator, which uses several Moving Averages on the chart. It measures different trend strenght zones for different periods: very long term, long term, mid term, short term and very short term. Each zone has its color, and it is possible to have sound alert when the prices leaves a zone and enters another. Its configuration is very simple. If you find any bug or have any suggestions, co
Bu ürünün alıcıları ayrıca şunları da satın alıyor
Trade Assistant MT5
Evgeniy Kravchenko
4.4 (172)
It helps to calculate the risk per trade, the easy installation of a new order, order management with partial closing functions, trailing stop of 7 types and other useful functions. Attention, the application does not work in the strategy tester. Manual, Description, Download demo Line function -   shows on the chart the Opening line, Stop Loss, Take Profit. With this function it is easy to set a new order and see its additional characteristics before opening.   Risk management  - The risk
Fiyatın saniyeler içinde değiştiği finansal piyasalarda emirleri vermekte aynı şekilde kolay olması gerektiğini düşünüyor musunuz? Metatrader programında her emir açmak istediğinizde emir fiyatını, zararı durdur emrini, kar al emrini ve işlem hacmini gireceğini pencereyi açmak zorundasınız. Finansal marketlerde işlem yaparken sermaye yönetimi sermayenizi doğru yönetmek için çok önemlidir. Bunun için işlem açmadan önce doğru işlem hacmini hesaplamanız gerekir.  Bu hesaplamaları sizin için yapabil
Local Trade Copier EA MT5
Juvenille Emperor Limited
5 (64)
Local Trade Copier EA MT5   ile olağanüstü hızlı işlem kopyalama deneyimi yaşayın. Kolay 1 dakikalık kurulumuyla bu işlem kopyalayıcısı, aynı Windows bilgisayarda veya Windows VPS'te birden fazla MetaTrader terminali arasında işlemleri kopyalamanıza olanak tanır ve 0.5 saniyenin altındaki şimşek hızında kopyalama hızları sunar. Başlangıç seviyesinde veya profesyonel bir tüccar olsanız da,   Local Trade Copier EA MT5 , spesifik ihtiyaçlarınıza göre özelleştirmek için geniş bir seçenek yelpazesi s
TradePanel MT5
Alfiya Fazylova
4.86 (115)
Ticaret Paneli çok işlevli bir ticaret asistanıdır. Uygulama, manuel ticaret için 50'den fazla işlev içerir ve çoğu ticaret eylemini otomatikleştirmenize olanak tanır. Satın almadan önce Demo sürümünü bir demo hesabında test edebilirsiniz. Demo burada . Talimatların tamamı burada . Ticaret. Tek tıklamayla temel alım satım işlemlerini gerçekleştirmenize olanak tanır: Bekleyen emirleri ve pozisyonları açın. Bekleyen emirleri ve pozisyonları kapatın. Pozisyonların tersine çevrilmesi (SATIN KAPATIN
The product will copy all telegram signal to MT5 ( which you are member) , also it can work as remote copier.  Easy to set up, copy order instant, can work with almost signal formats, image signal,  s upport to translate other language to English Work with all type of channel or group, even channel have "Restrict Saving Content", work with  multi channel, multi MT5 Work as remote copier: with signal have ticket number, it will copy exactly via ticket number. Support to backtest signal. How to s
Riskinizi otomatik olarak hesaplarken işlemlere hızlı bir şekilde girip çıkmanıza yardımcı olacak Ticaret Yöneticisi. Aşırı Ticaret, İntikam Ticareti ve Duygusal Ticaretten korunmanıza yardımcı olacak özellikler içerir. İşlemler otomatik olarak yönetilebilir ve hesap performans ölçümleri bir grafikte görselleştirilebilir. Bu özellikler, bu paneli tüm manuel yatırımcılar için ideal kılar ve MetaTrader 5 platformunun geliştirilmesine yardımcı olur. Çoklu Dil desteği. MT4 Sürümü  |  Kullanım Kılavu
MT5 to Telegram Signal Provider , hesabınızı bir sinyal sağlayıcı haline getirerek belirtilen sinyalleri Telegram'ın sohbetine, kanalına veya grubuna göndermeyi sağlayan kullanımı kolay, tamamen özelleştirilebilir bir araçtır. Rakip ürünlerin çoğunun aksine, DLL içe aktarması yapmaz. [ Demo ] [ Kılavuz ] [ MT4 Versiyonu ] [ Discord Versiyonu ] [ Telegram Kanalı ] Kurulum Adım adım bir kullanıcı kılavuzu mevcuttur. Telegram API'si hakkında bilgi gerekmemektedir; ihtiyacınız olan her şey gelişti
YuClusters
Yury Kulikov
4.93 (43)
Attention: You can view the program operation in the free version  YuClusters DEMO .  YuClusters is a professional market analysis system. The trader has unique opportunities to analyze the flow of orders, trade volumes, price movements using various charts, profiles, indicators, and graphical objects. YuClusters operates on data based on Time&Sales or ticks information, depending on what is available in the quotes of a financial instrument. YuClusters allows you to build graphs by combining da
Trade copier MT5
Alfiya Fazylova
4.39 (28)
Trade Copier, ticaret hesapları arasındaki işlemleri kopyalamak ve senkronize etmek için tasarlanmış profesyonel bir yardımcı programdır. Kopyalama, tedarikçinin hesabından/terminalinden alıcının aynı bilgisayarda veya vps'de kurulu olan hesabına/terminaline gerçekleşir. Satın almadan önce demo sürümünü bir demo hesabında test edebilirsiniz. Demo versiyonu burada . Tüm talimatlar burada . Ana işlevler ve avantajlar: Emirlerin kopyalanmasını destekler: МТ5> МТ5, МТ4> МТ5, МТ5> МТ4. Emirlerin kopy
Trade Assistant 38 in 1
Makarii Gubaydullin
4.87 (15)
Çok amaçlı araçlar: Lot hesaplayıcı, fiyat analizi, risk/ödül oranı, pozisyon yönetici, arz  talep bölgelerini de içeren 65'den fazla fonksiyon Deneme sürümü   |   Kullanım Kılavuzu   |   MT4 Yardımcı program, strateji test cihazında çalışmaz: Ürünü test etmek için Demo Sürümünü BURADAN indirebilirsiniz. Sorularınız için iletişim İşlem sürecinizi kolaylaştırın, hızlandırın ve otomatikleştirin. Terminalin standart  özelliklerini bu program ile genişletin Yeni işlem açma : Lot / Risk / Risk/Ödül
-25% discount ($199 -> $149) Advanced trading tool: One click smart orders that execute under your conditions Developed by trader for trading community:  position size calculator (lot size), open position after price action, strategy builder, set and forget trading, mobile notifications... Risk Management -  Risk percentage position size calculator, gain percentage, target risk reward ratio, spread and commissions are included in calculations 7 Advanced order types  - Set and forget trading w
The top-selling EAs on the market cost a lot and one day they are suddenly gone. This is because one strategy will not work in the forex market all the time. Our product is unique from all others in the MQL Marketplace because our EA comes with 34+ built-in indicators that allow develop strategies every time.  You build your strategy and keep updating it. If one strategy does not work, simply build another all using only one EA. This is All-In-One EA   in this market place. You can use as trade
Pro Arbitrage EA   trades based on Arbitrage Strategy. The strategy is like a scalping technology but on three cross currency pairs at the same time. Each trade basket involves three pairs (all open at the same time) and they will close at once when any desired profit reaches. The strategy has no SL technically because all opened currencies are hedged. SL can happen if high slippages on order execution on the broker side. So the strategy is one of the safest ones in the world. Using the EA : U

Exp COPYLOT CLIENT for MT5
Vladislav Andruschenko
3.84 (19)
MT5 için ticari kopyalayıcı, МetaТrader 5 platformu için bir ticari kopyalayıcıdır   . arasındaki   forex işlemlerini kopyalar.       COPYLOT MT5 sürümü için   herhangi bir hesap   MT5   -   MT5, MT4   -   MT5 (veya COPYLOT MT4 sürümü için   MT4 -   MT4 MT5   -  MT4) Güvenilir fotokopi makinesi! MT4 sürümü Tam tanım   +DEMO +PDF Nasıl alınır Nasıl kurulur     Günlük Dosyaları nasıl alınır?     Nasıl Test Edilir ve Optimize Edilir     Expforex'in tüm ürünleri Ayrıca МТ4 terminali   (МТ4  
Tired of complex order placement and manual calculations? Trade Dashboard is your solution. With its user-friendly interface, placing orders becomes effortless, by a single click, you can open trades, set stop loss and take profit levels, manage trade lot size, and calculate risk to reward ratios, allowing you to only focus on your strategy. Say goodbye to manual calculations and streamline your trading experience with Trade Dashboard. Download   demo version   right now. You can find   deta
Üye olduğunuz herhangi bir kanaldan (özel ve kısıtlı olanlar dahil) sinyalleri doğrudan MT5'inize kopyalayın.  Bu araç, kullanıcıyı göz önünde bulundurarak tasarlanmış olup işlemleri yönetmek ve izlemek için ihtiyacınız olan birçok özelliği sunar. Bu ürün, kullanıcı dostu ve görsel olarak çekici bir arayüzde sunulmaktadır. Ayarlarınızı özelleştirin ve ürünü dakikalar içinde kullanmaya başlayın! Kullanıcı Kılavuzu + Demo  | MT4 Sürümü | Discord Sürümü Demo denemek isterseniz lütfen kullanıcı k
UTM Manager, hızlı ve verimli ticaret gerçekleştirme olanağı sunan sezgisel ve kullanımı kolay bir araçtır. Öne çıkan özelliklerden biri, spreadleri tamamen göz ardı ederek mum fiyatı üzerinden işlem yapmanızı sağlayan "Yayılmayı Yoksay" modudur (örneğin, LTF'de daha yüksek spread çiftlerinde işlem yapmanızı sağlar, spread nedeniyle alım satımların dışında kalmaktan kaçınır). UTM Manager'ın diğer bir önemli yönü, benzersiz yerel ticaret kopyalayıcısıdır ve her bir aracı kurumda farklı ticaret st
Set price targets, and leave everything else to HINN Lazy Trader! This tool is designed for automatic position sizing from specified levels to designated targets. Using a VPS is recommended (*). Current price already includes a 25% discount : Purchase (lifetime) -- $365 instead of $490 Rent (30 days) -- $50 instead of $69 The demo version generated by MT Market is automatically and is useless because to start this algo advisor, you need to specify zones of interest and targets! A community
-25% discount ($149 -> $111) Everything for chart Technical Analysis indicator mt5 in one tool Draw your supply demand zone with rectangle and support resistance with trendline and get alerts to mobile phone or email alert -  Risk reward indicator mt5 Video tutorials, manuals, DEMO download   here .   Find contacts on my   profile . 1.   Extended rectangles and trendlines Object will be extended to the right edge of the chart when price will draw new candles on chart. This is rectangle extend
DrawDown Limiter
Haidar, Lionel Haj Ali
5 (17)
Drawdown Limiter EA You are in the right place if you were searching for Drawdown control, Drawdown limiter, Balance protection, Equity Protection or Daily Drawdown Limit related to Prop Firm, FTMO, or Funded account trading, or if you want to protect your trading account. Have you suffered from controlling your drawdown when trading funded accounts? This EA is meant for you. Prop firms usually set a rule called “Trader Daily Drawdown”, and if it is not respected, you are disqualified.  I am an
ATTENTION the expert does not work in strategy tester, for a trial version visit my profile. " Launch offer : throughout the month of June, purchase our product for only 100 USD instead of 150 USD!" Manual RiskGuard Management   RiskGuard management was born with the idea of ​​helping traders from their initial journey to becoming expert and aware traders. Written completely with native MetaTrader 5 functions without any use of external libraries, it is perfectly compatible with any operatin
OrderManager 'ı Tanıtıyoruz: MT5 için Devrim Niteliğinde Bir Yardımcı Program Yepyeni Order Manager yardımcı programı ile MetaTrader 5 için işlemlerinizi bir profesyonel gibi yönetin. Basitlik ve kullanım kolaylığı göz önünde bulundurularak tasarlanmış olan Order Manager, her işlemle ilişkilendirilen riski kolayca tanımlamanıza ve görselleştirmenize olanak tanır, böylece bilinçli kararlar alabilir ve ticaret stratejinizi optimize edebilirsiniz. OrderManager hakkında daha fazla bilgi için lütfen
MT4 to Discord Signal Provider , ticaret sinyallerini doğrudan Discord'a göndermek için tasarlanmış kullanıcı dostu ve tamamen özelleştirilebilir bir araçtır. Bu araç, ticaret hesabınızı etkili bir sinyal sağlayıcısına dönüştürür. Mesaj formatlarını tarzınıza uyacak şekilde özelleştirin! Kolay kullanım için önceden tasarlanmış şablonlardan seçim yapın ve hangi mesaj öğelerini dahil etmek veya çıkarmak istediğinize karar verin. [ Demo ] [ Kullanım Kılavuzu ] [ MT4 Versiyonu ] [ Telegram Versiyonu
1 tıklama ile ticaret için Ticaret Paneli.   Pozisyonlar ve emirlerle çalışmak!   Grafikten veya klavyeden alım satım. Alım satım panelimizi kullanarak, grafikten tek bir tıklamayla alım satım yapabilir ve alım satım işlemlerini standart MetaTrader kontrolünden 30 kat daha hızlı gerçekleştirebilirsiniz. Bir tüccar için hayatı kolaylaştıran ve bir tüccarın ticaret faaliyetlerini çok daha hızlı ve daha rahat gerçekleştirmesine yardımcı olan parametrelerin ve işlevlerin otomatik hesaplamaları. Gra
Ticaret paneli, emirleri yönetmekle sınırlıdır - hem düğmeler kullanılarak açılır hem de kullanıcı tarafından açılır. Koleksiyonda basit ve kullanışlı. Herhangi bir alıcıyı tamamlayacak. Gold Stuff göstergesiyle birlikte kullanmanızı öneririm. Alım satımı tek emirler olarak kurun ve mesafeli bir ızgara oluşturun. Standart bir ızgara oluşturmak için 10000 gibi büyük bir mesafe ayarlamanız yeterlidir. Gerçek zamanlı sonuçlar burada görüntülenebilir. Ayarları ve kişisel bir bonusu almak için s
Bu program, MetaTrader hesabınızdan tüm işlemlerinizi çok kullanıcı dostu bir Arayüz kullanarak Notion'a doğrudan aktarmanıza olanak tanır.  MT4 Sürümü  |  Kullanıcı Kılavuzu + Demo Başlamak için lütfen Kullanıcı Kılavuzunu kullanın ve Notion Şablonunu indirin. Demo istiyorsanız lütfen Kullanıcı Kılavuzuna gidin. Strateji testinde çalışmaz! Ana Özellikler Tüm işlemlerinizi ticaret hesabınızdan Notion'a aktarın Devam eden işlemleri ve bekleyen emirleri Notion'a aktarın ve güncelleyin Şablon oluşt
Mentfx Mmanage mt5
Anton Jere Calmes
4.43 (7)
The added video will showcase all functionality, effectiveness, and uses of the trade manager. Drag and Drop Trade Manager. Draw your entry and have the tool calculate the rest. Advanced targeting and close portions of a trade directly available in tool (manage trades while you sleep). Market order or limit order on either side with factored spread. Just draw the entry, the tool does the rest. Hotkey setup to make it simple. Draw where you want to enter, and the stop loss, the tool calculates al
EA DIDI Alert – ATM Systems için sayaç okuyucu Finansal piyasalardaki en iyi ticaret fırsatlarından yararlanmanıza yardımcı olacak araçlar mı arıyorsunuz? Daha sonra, ATM Systems tarafından sunulan DIDI Alert – Agulhadas Detector, bu stratejiye adanmış diğer danışmanların aksine, Didi Aguiar'ın güçlü İğne Kurulumu ticaret stratejisini DIDI INDEX ile güçlendiren piyasadaki tek danışmandır. Kaynaklarımızın çeşitli olduğunu bilmemiz gerekiyor. Çok eksiksiz, işlevsel ve pratik. Bollinger Band ge
This EA Utility allows you to manage (with advanced filtering) unlimited open orders (manual or EA) with 16 trailing stop methods: fixed, percent, ATR Exit, Chandelier Exit, Moving Average, Candle High Low Exit, Bollinger Bands, Parabolic, Envelope, Fractal, Ichimoku Kijun-Sen, Alligator, Exit After X Minutes or Bars, RSI and Stochastic. The trailing stop can be either real or virtual, and you can exit fully or with a partial close percent on touch or bar close.  Moreover, you can add (overri
Bu Uzman Danışman, maliyetli düşüşleri önlemek ve/veya alım satım kurallarına uymak için alım satım hesabınızın öz sermayesini sürekli olarak izler. Belirli bir dizi kural ihlal edildiğinde, EA uyaracak, tüm işlemleri kapatacak ve bazı durumlarda bekleyen tüm emirleri silecektir. İsteğe bağlı olarak, hesapta çalışan tüm EA'ları kaldırmak için tüm çizelgeleri de kapatabilir. Bu EA, özellikle FTMO Challenge veya PZ Challenge gibi Prop Trading Challenges için kullanışlıdır. [ Kurulum Kılavuzu | Gü
Yazarın diğer ürünleri
1. Why did I develop this series of indicators I found that most traders need to use multiple time frame indicators. They usually switch time frame to see indicators. However, once the timeframe is switched, you cannot see the  corresponding relationship  between  the price in the smaller timeframe  and  the indicator in the larger timeframe . For example: if your price chart is in H1 timeframe, you can see H4, D1 and W1 indicators in H1 timeframe Chart. This is more helpful for you to find t
This product can be used to synchronize multiple Charts, and each Chart can be set to a different sync mode. With this product you can better view and manipulate charts: different time frames for a single Symbol, the same time frame for multiple Symbols, system indicators for single/multiple Symbols... and more. Feature: Chart settings can be synchronized, including : background, indentation, size, etc. Multiple Chart window start times  or end times can be synchronized. Multiple Chart time f
Do you think it's a bit cumbersome when you need to switch symbols or timeframes with mouse click? 1. What is this? This is a program that can switch symbols and timeframes with direction keys. Fast switching, very convenient, no mouse click required. For traders, one symbol with multi-timeframe charts are usually added,  you can change symbol on those charts easily. For multi-currency traders, different symbol charts are usually added, you can also change those timeframes easily. I wrote this p
This product can be used to synchronize multiple Charts, and each Chart can be set to a different sync mode. With this product you can better view and manipulate charts: different time frames for a single Symbol, the same time frame for multiple Symbols... and more. PS: The link below is the FreeDemo product, you can use it on EURUSD/XUAUSD/USDCNH symbol: https://www.mql5.com/en/market/product/38557 Feature: Chart settings  can be synchronized, including : background, indentation, size, etc.
Have you ever take a long time to watch a Symbol when the network link is not good ? Have you ever wait for a long time when you switch chart between different Symbols or different TimeFrames ? If you do long-term backtesting , Have you ever to be downloaded datas for a long time ? Yes, If there is no data in the system, those will happen.  1. What is this: Download all the Symbol data in Market Watch to the system. PS: This is not outputting data to Files. This Link go to Demo version: https:
1. What is this         Rising volatility and falling volatility are not the same, whether it is academic research or actual testing has shown this point.         The original ATR indicator is calculated by putting up and down fluctuations together. This indicator is to calculate separately the upward volatility and the downward volatility, which can better help you study the market. 2. Indicator description          There are two modes for the calculation of this indicator, as shown in the f
I see that many tools in the market deal with Position and Order in the form of operation panels. Which is loaded into a Chart in the form of an EA. However, once the operator panel EA is loaded, no other EAs can be loaded. So, I wrote the one-click operation of Position and Order as a script, so you can load other EAs and easily complete one-click operation of Trade. 1. What is this: This is a one-click script to close position order. Now you can close position tickets at high speed, for examp
Do you think it's a bit cumbersome when you need to switch symbols or timeframes with mouse click? 1. What is this? This is a program that can switch symbols and timeframes with direction keys. Fast switching, very convenient, no mouse click required. For traders, one symbol with multi-timeframe charts are usually added,  you can change symbol on those charts  easily . For multi-currency traders, different symbol charts are usually added, you can also change those timeframes easily. I wrote thi
According to trading experience: Some symbols are easy to reverse on certain days, such as Monday, or afternoon, and so on. So comparing the current price with the corresponding historical moment price is valuable. If the price coordinate system uses a logarithmic price, you will get a lot of valuable information. 1. What is this? This program can convert the symbol price and add it to your Chart. You can compare it with your major chart. The DEMO version Link: https://www.mql5.com/en/market/p
What is this: Violent trading: means sending a large number of orders to your brokerage server,  it can conduct a stress test of the trading. In this program you can run a variety of trading tests.  Now you can trade at high speed, For example 1000 orders in an instant. The Demo version's link:  https://www.mql5.com/en/market/product/38431/ Why to use: Whether manual trading or EA trading,  the status of the broker server is very important. So it is beneficial to conduct a trading stress test on
1. Why did I develop this series of indicators I found that most traders need to use multiple time frame indicators. They usually switch time frame to see indicators. However, once the timeframe is switched, you cannot see the  corresponding relationship  between  the price in the smaller timeframe  and  the indicator in the larger timeframe . For example: if your price chart is in H1 timeframe, you can see H4, D1 and W1 indicators in H1 timeframe Chart. This is more helpful for you to find t
Filtrele:
[Silindi] 2019.02.14 14:59 
 

Kullanıcı incelemeye herhangi bir yorum bırakmadı

[Silindi] 2019.02.14 14:08 
 

Kullanıcı incelemeye herhangi bir yorum bırakmadı

İncelemeye yanıt
Sürüm 1.11 2021.10.23
magic number: default 0 means all.
comment: default "" means all.
Sürüm 1.10 2020.12.01
Now you can delete pending tickets at high speed, for example 1000 pending tickets can be deleted instantaneously.

Sürüm 1.7 2020.06.06
recompiled for MT5 update.
Sürüm 1.6 2019.05.07
Add to print the total time of deleting all pending orders.
Sürüm 1.2 2019.02.14
1.01 Fix some bug.

1.02 Add alert when you have the wrong operation.