Trade Path Journal
- Yardımcı programlar
- Sürüm: 1.1
- Etkinleştirmeler: 5

Would your stop loss or take profit have been reached first? Trade Path Journal shows how price moved between the entry and final exit of a closed MetaTrader 5 position. Set virtual exit levels and see which one the broker’s recorded ticks reached first, down to the millisecond.
Review a position
- Attach Trade Path Journal to a separate chart in desktop MT5. It opens your most recent closed position. Use Older and Newer to browse, or set History symbol to review one instrument.
- Enter SL pts and TP pts as distances from the actual entry fill, then click Apply. The distances use the symbol’s points. Set either distance to zero to turn that level off.
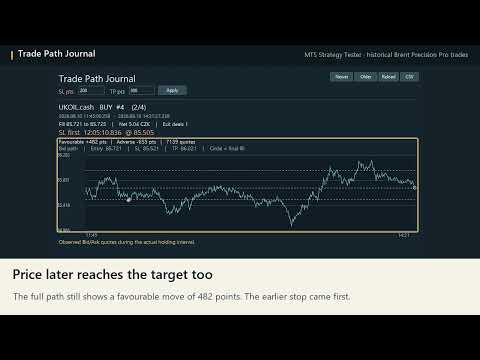
- Follow the Bid line for a buy or the Ask line for a sell. A dot marks the first quote to reach or cross a virtual level. The line continues to the actual exit, so you can also see what happened afterward.
On one UKOIL.cash buy in the MT5 Strategy Tester, price crossed both virtual levels while the position was open. The stop at 85.521 came first, when Bid fell to 85.505 at 12:05:10.836 broker time. The target at 86.021 was reached later. The marked price is the observed quote. An actual order’s fill would depend on execution.
The panel also shows the largest moves in your favour and against you in points, alongside the realised result including commissions, swap and fees recorded against the position. Click CSV to export the selected position’s summary.
The journal supports closed positions with one entry fill and one or more exits, including partial closes. It uses your broker’s available tick history and flags gaps. If a gap makes the sequence uncertain, the panel shows Order unresolved. The journal is read-only and works with Algo Trading switched off.