Wave Reversal Toolkit
- Göstergeler
- Sürüm: 1.0
- Etkinleştirmeler: 10

Wave Reversal Toolkit is a reversal indicator for MetaTrader 5 with two jobs. It marks WaveTrend turns on the price chart, and it puts what you need to judge them right next to them: support and resistance channels, a golden pocket from the last H4 swing, a volume profile and a seven-timeframe trend table.
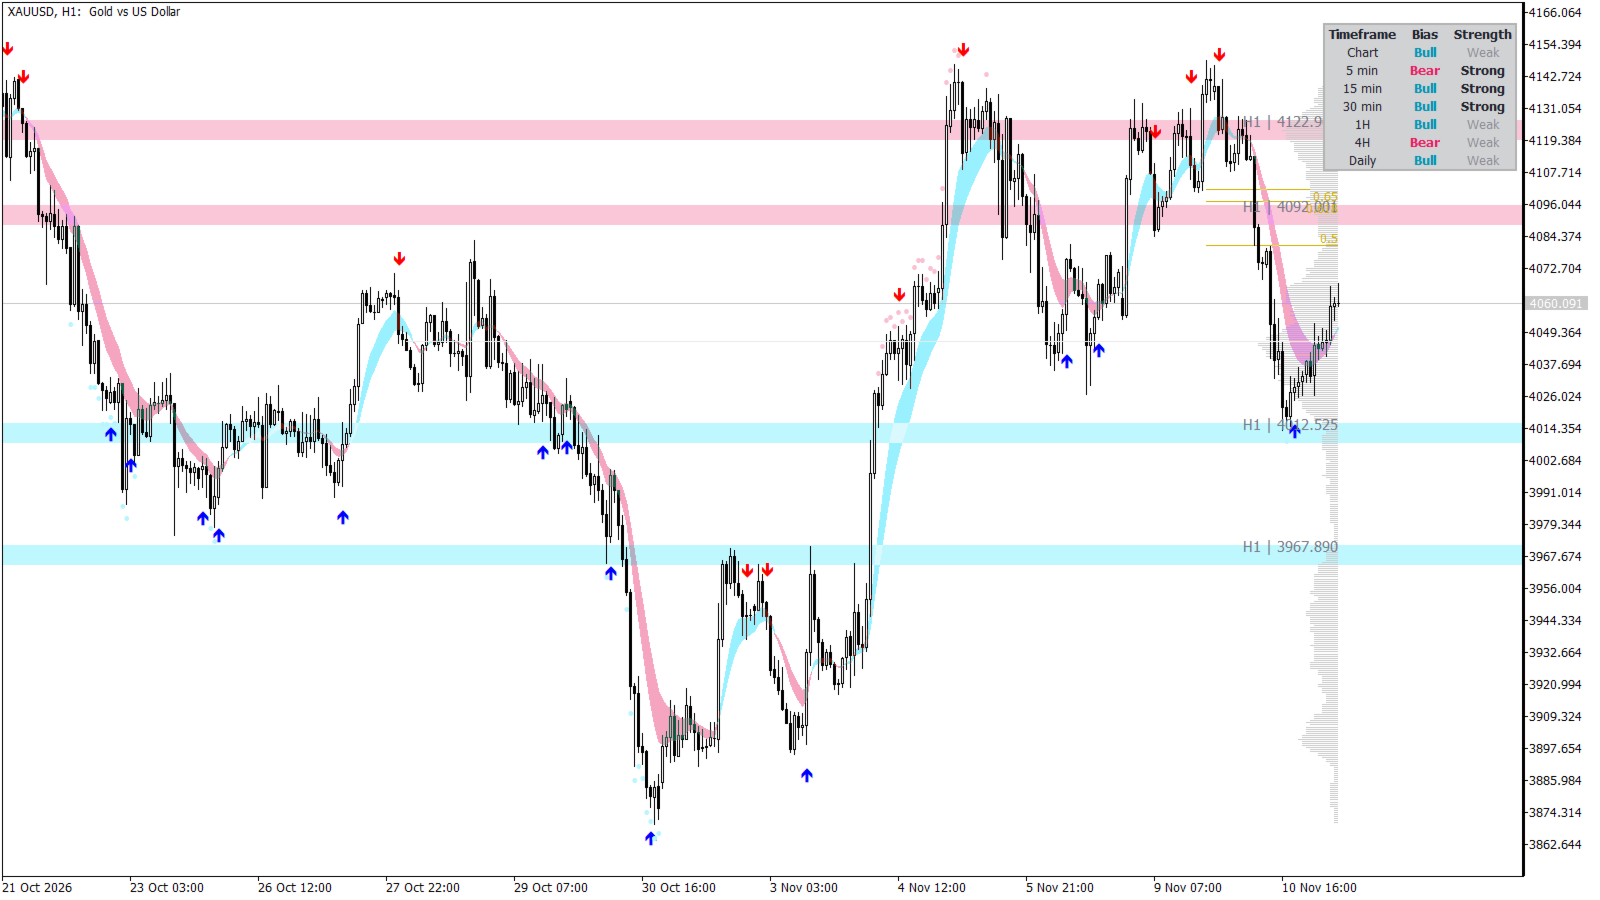
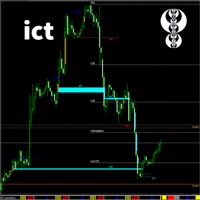
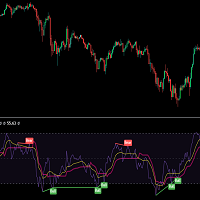
The second job matters more, and the cover chart shows why. Between 22 and 30 October 2026 gold printed eight buy arrows on H1 while it fell from 4,023 to 3,876. The ninth arrow, at 18:00 on 30 October, came with WaveTrend at -95, the deepest reading of the whole leg, and gold reached 4,146.98 on 5 November. Same arrow, two very different outcomes. So the arrow alone can't tell you which one you're looking at.
What most reversal indicators skip
| What the idea needs | What the usual free version does | What Wave Reversal Toolkit does |
|---|---|---|
| A turn from an extreme, not any wiggle | Arrow on every oscillator cross | Arrow only when the slow line is beyond ±25, alerts only beyond ±55 |
| Overbought that's still being pushed, not just "high" | Paints every bar with RSI over 70 | Dot only when RSI(21) is past 70/30 and still past its own 13-bar average |
| A level to lean on | Leaves you to draw it | Groups the last 284 body pivots into channels and keeps the 7 strongest |
| A view of the bigger trend | One timeframe | Bias and ADX strength on chart, M5, M15, M30, H1, H4 and D1 in one table |
| Higher-timeframe levels that were really there at the time | Reads the H4 candle before it closes, so history looks better than it traded | Golden pocket and liquidity built from closed H4 candles only |
The last row is the quiet one. Read the forming H4 candle as if it had closed and every past swing lines up a little too neatly, so you end up trusting levels that weren't on screen when price got there. Here a swing only counts once its H4 candle has closed. What you see in history is what you'd have seen live.
What it draws
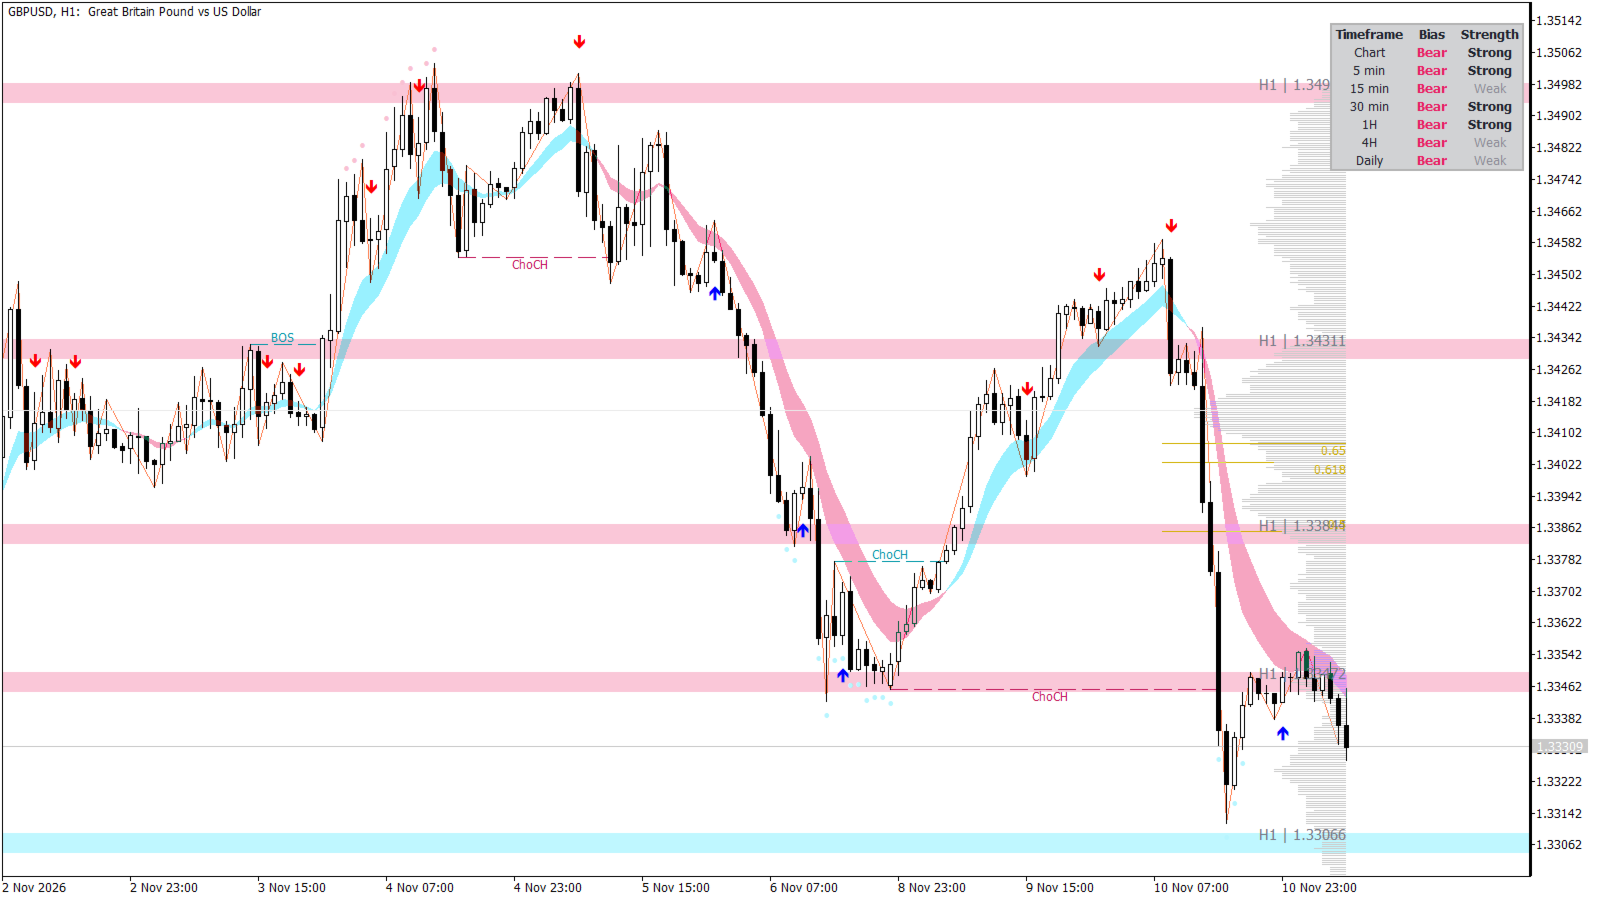
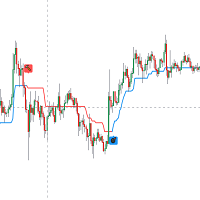
Buy and sell arrows (on). WaveTrend 13/21 on the typical price. Blue arrow when the fast line crosses up with the slow line at -25 or lower, red arrow for the mirror case above +25.
Overbought and oversold dots (on). Small dots between the candle and the arrows, so the two never sit on top of each other. RSI(21) on the typical price beyond 70 or 30 and beyond its own 13-bar EMA.
Trend ribbon (on). EMA 8 against EMA 13, blue when the fast one is on top, pink when it isn't. The quickest way to see an arrow fighting the short-term trend.
Support and resistance channels (on). Up to 284 candle-body pivots (10 bars each side) grouped into channels no wider than 10% of the 300-bar range. A channel needs two pivots, and the 7 strongest are drawn as wide translucent lines with timeframe and price. A higher timeframe works too.
Golden pocket (on). 0.5, 0.618 and 0.65 of the latest H4 swing, drawn from that swing to the current bar.
Volume profile (on). The last 233 bars in 377 price rows of tick volume, with the busiest row extended back as the point of control.
Trend table (on). Per timeframe: close above the EMA 21 of the typical price (Bull/Bear), and ADX(21,13) above 21 (Strong/Weak).
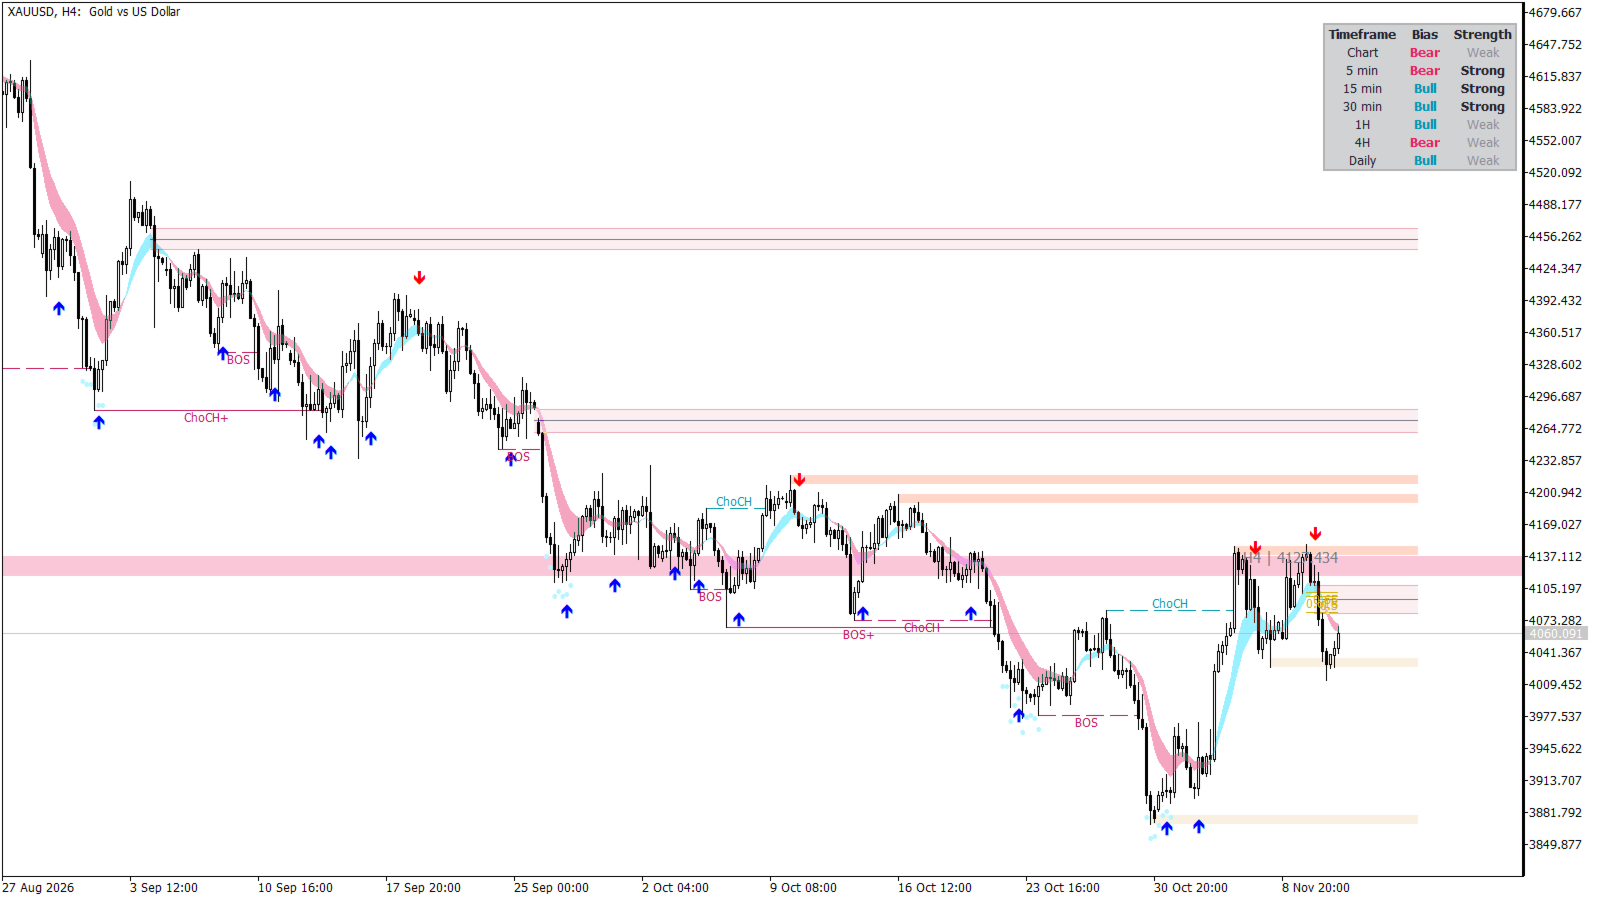
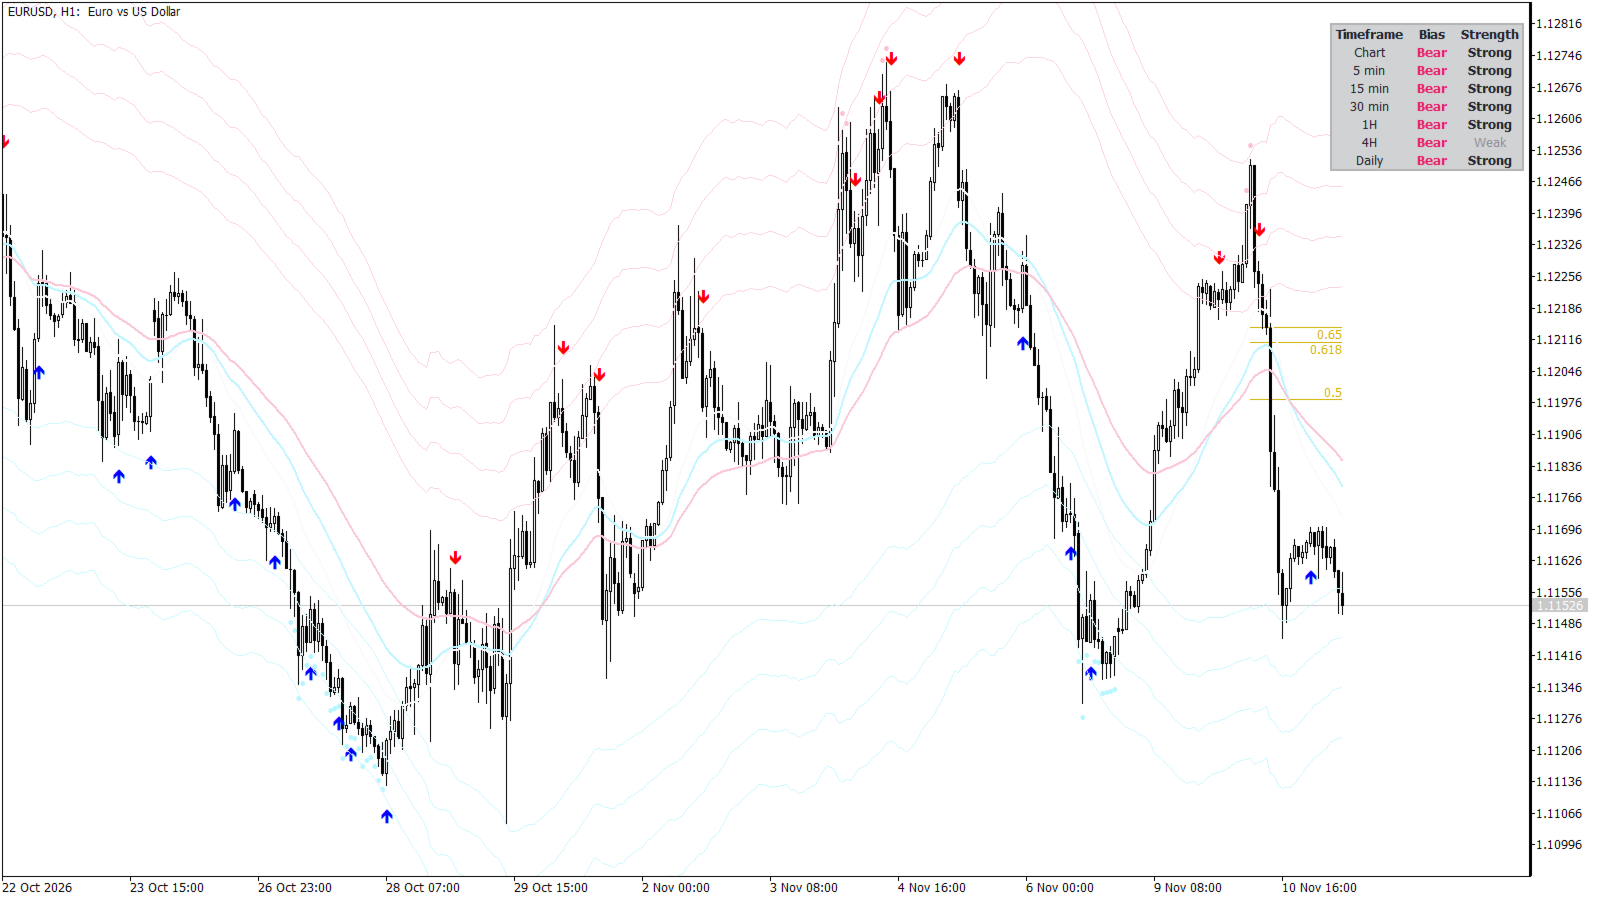
Off by default, one switch each: ChoCH/BOS (8-bar internal, 50-bar swing structure), H4 fair value gaps, H4 liquidity levels, a one-bar Gann swing line, EMA 21/34/55 and reversal bands at 3 to 6 ATR around a 55-bar average.
No order blocks, no take-profit levels, no trades.
How to read it
| On the chart | Read it as |
|---|---|
| Blue arrow | WaveTrend turned up from oversold. A prompt to look, not an entry |
| Several blue arrows in a row | The market's still falling and the oscillator keeps trying to turn |
| Dot under a candle | RSI is deeply oversold and still dropping |
| Arrow at a support channel or in the golden pocket | The turn lines up with a level. That's the case worth your time |
| Trend table: H1 and H4 both Bear and Strong | A buy arrow is going against a trend that's still pushing |
Long: a blue arrow at or just under a support channel, the golden pocket or the point of control, with the ribbon turning blue in the next bars and H4 not showing Bear/Strong. Take your own confirmation on a lower timeframe and aim for the next channel above. Short is the same thing mirrored.
Skip it when: the arrows are stacking up one after another, the dots keep printing on every bar, the higher timeframes in the table are Strong against you, or the arrow is sitting in the middle of nowhere with no level near it.
To be straight with you, that's how the pieces fit together, not a system I've proven. On their own the arrows aren't an edge. I checked that over 2020 to 2026 on gold and three major pairs before writing this page. And I'd rather tell you now than have you find out with real money.
Settings
| Setting | Default | What it changes | When to move it |
|---|---|---|---|
| Buy/Sell WaveTrend level | 25 | How far past zero the slow line must be for an arrow | Raise to 40-55 if the arrows crowd your chart. Fewer arrows, all from deeper extremes |
| Buy/Sell alert WaveTrend level | 55 | Same rule for alerts only | Lower it if you want an alert for every arrow |
| Levels | 7 | How many S/R channels are kept (1-10) | Drop to 3-4 on a cluttered chart |
| S/R Timeframe | Current | Which candles the pivots come from | H4 on an H1 chart for fewer, older levels |
| Golden Pocket Timeframe | H4 | Which candles the swing is measured on | D1 if you hold for days, H1 for intraday swings |
| FVG / Liquidity Timeframe | H4 | Candles used for gaps and liquidity | Keep them above your chart timeframe |
| Bars back to draw | 2000 | How far back structure labels and the Gann line go | Lower it on M1/M5 if the chart feels slow |
Only the first two change the signals. The show switches, profile size, labels and colours change what's drawn, so hiding a layer never moves an arrow.
Three setups I've looked at on real charts:
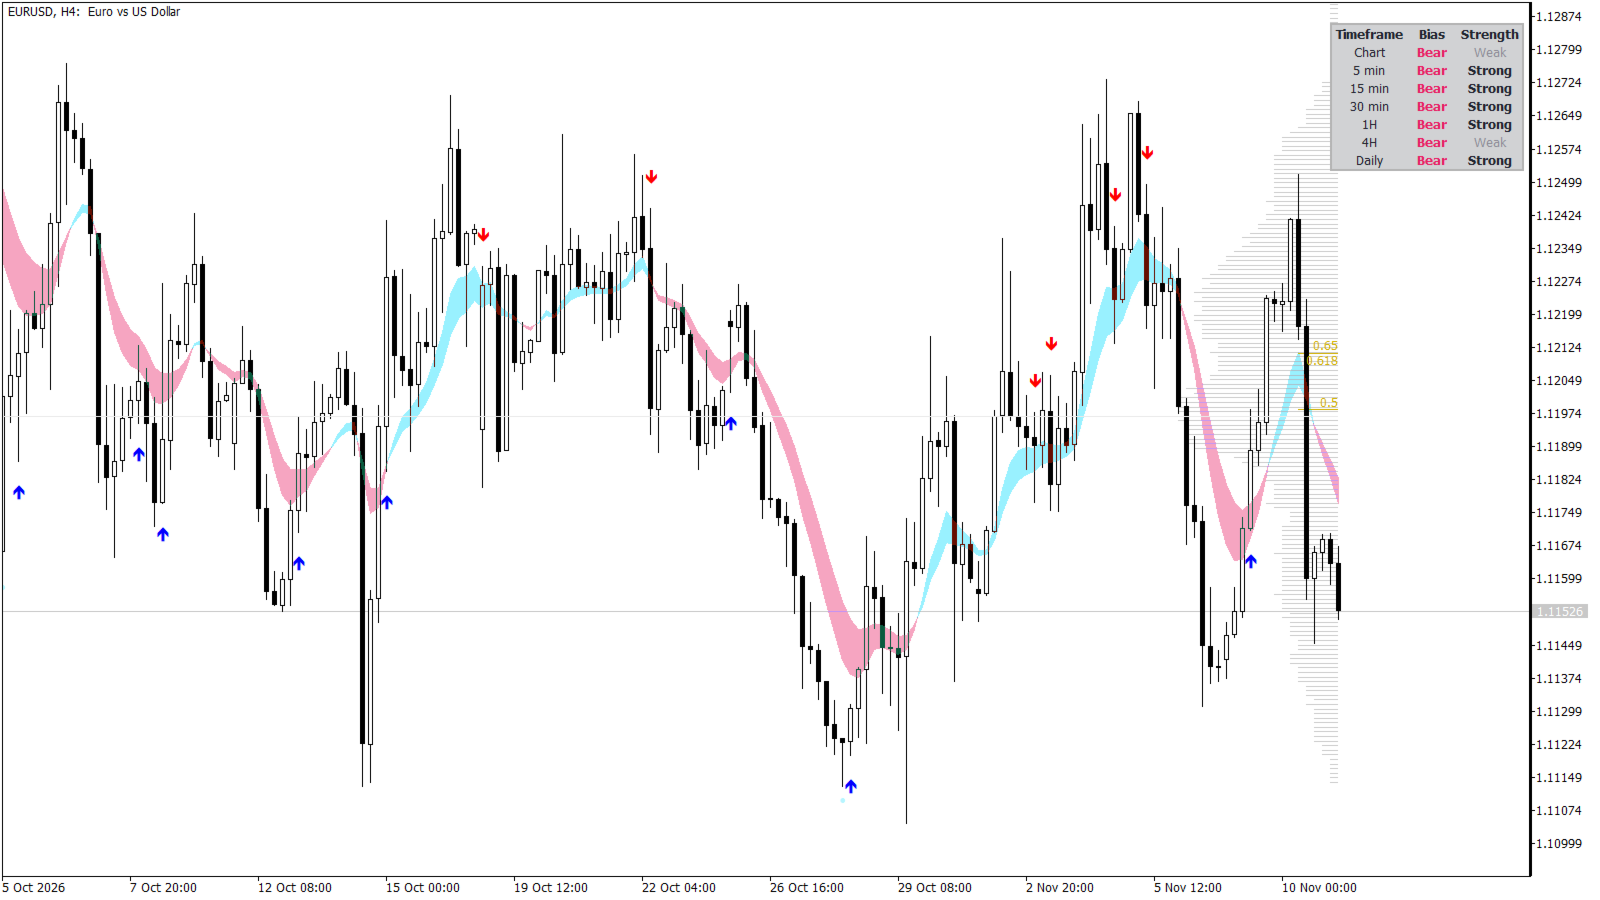
Default Arrows, dots, ribbon, S/R, golden pocket, profile, table Structure view + ChoCH/BOS, H4 FVG, H4 liquidity, profile off (gold H4) Average view + EMA 21/34/55, reversal bands, ribbon and profile off (EURUSD H1)
If you only touch three things, touch the WaveTrend level, Levels and the timeframe you run it on. Leave the 13/21 WaveTrend lengths alone, they aren't inputs for a reason.
Alerts (popup, push, email, and Telegram on MT5) cover buy/sell, S/R crosses, ChoCH/BOS, gaps and liquidity. They're off until you pick a channel, wait for the bar to close, and fire once per bar.
What this version can't do
The S/R channels are the strongest 7 of the last 284 pivots, not the nearest 7. On a pair that has travelled a long way they can all sit off screen; on EURUSD H1 and H4 in November 2026 none of them were in view. Set the S/R timeframe lower or raise Levels if that happens to you.
The fair value gaps need 300 higher-timeframe candles before their size filter works, so a symbol with little history shows none at first. Gaps and liquidity zones vanish on the first touch, by design.
The profile uses tick volume and sits over the last 20 bars. On MT4 the ribbon is thin columns and the S/R lines are thinner.
You won't find a win rate table here, and I'd be careful with any indicator page that has one.
Honestly, the part that took longest wasn't the oscillator. It was making the higher-timeframe pieces wait for closed candles and still load on a fresh chart where the H4 history hasn't arrived yet.
Questions you'll have
Does Wave Reversal Toolkit repaint? Closed bars don't change. The arrows and dots are worked out on the forming bar too, so one can appear and disappear before the close, which is why alerts wait for the close by default. S/R channels, structure labels, gaps and liquidity are only drawn from closed bars.
Why do I get several buy arrows in a row? The market kept falling and WaveTrend kept turning up from oversold. Raise the WaveTrend level to 40 or 55, and use the table and levels to choose between them.
What's the best timeframe for Wave Reversal Toolkit? I've looked at it on M15, H1 and H4 on gold, EURUSD and GBPUSD, and I'd start on H1 or H4. I haven't looked below M15, so I can't tell you it works there.
Is there an MT4 version? Yes, listed separately as Wave Reversal Toolkit MT4. It calculates the same values bar for bar. This MT5 version adds the filled ribbon, Telegram alerts and wider S/R lines.
Can an EA read the signals? Yes. Arrows are buffers 0 and 1, dots 2 and 3 on both. The WaveTrend slow line and RSI are 18 and 19 on MT5, 20 and 21 on MT4.
Support
Message me on MQL5 with a screenshot, the symbol and the timeframe. Updates are free.
Analysis tool. It places no trades and makes no profitability claim. Past price behaviour is not a guide to future price behaviour.