Gold Command Dashboard
- Göstergeler
- Sürüm: 1.0

Gold Command Dashboard puts the context you need before you click Buy or Sell into one compact panel on your XAUUSD chart. It does not draw arrows, does not generate signals and does not trade. It tells you what kind of market you are in, so your own strategy can make better decisions. Free, no time limit.
What the panel shows
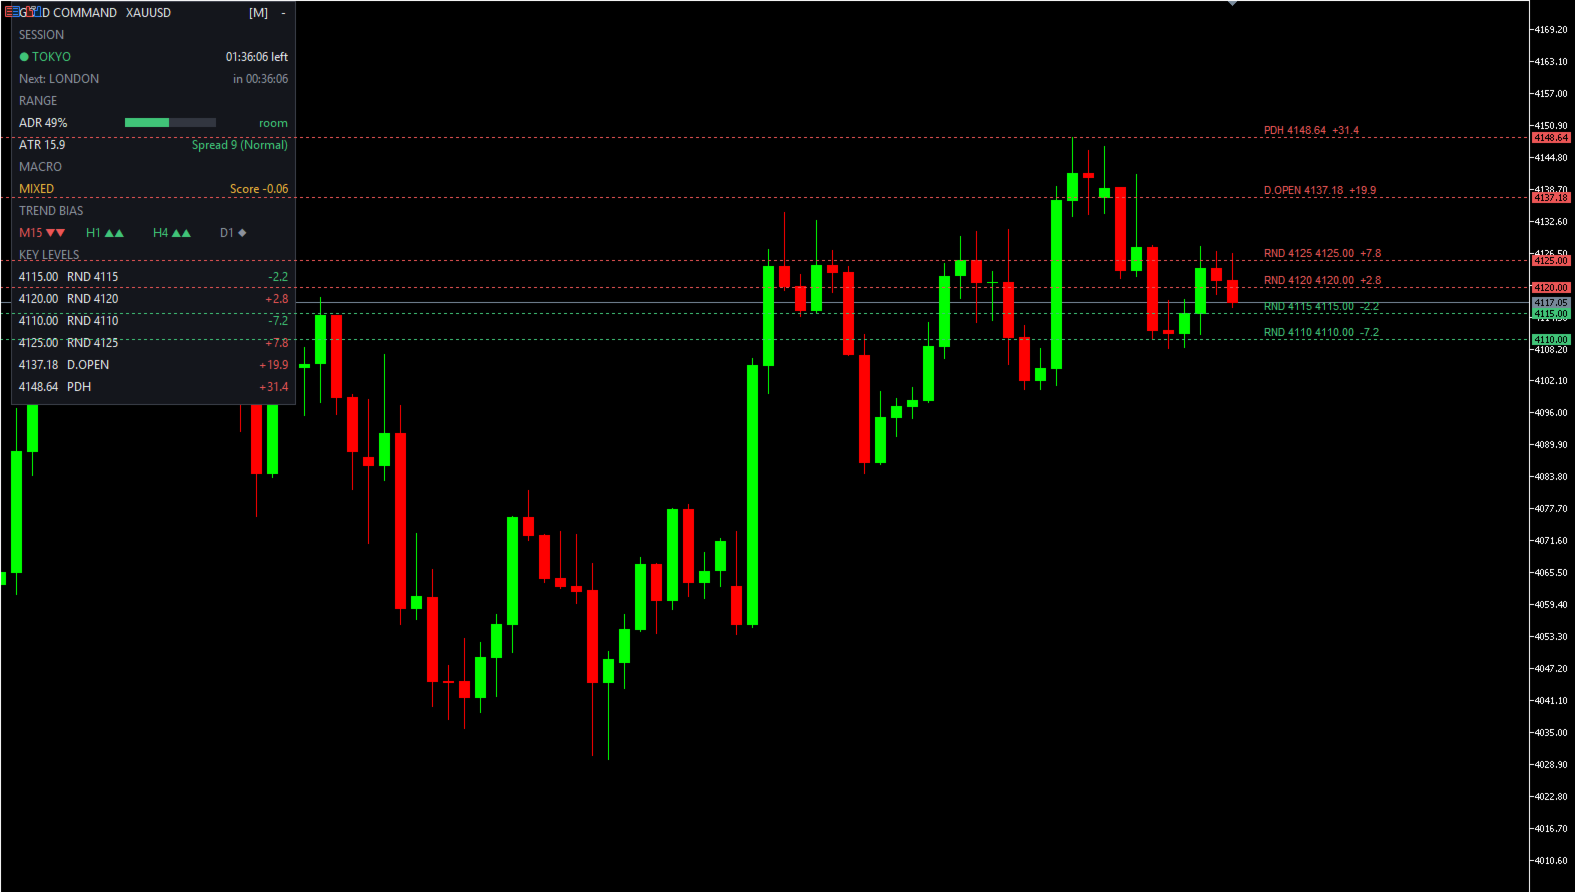
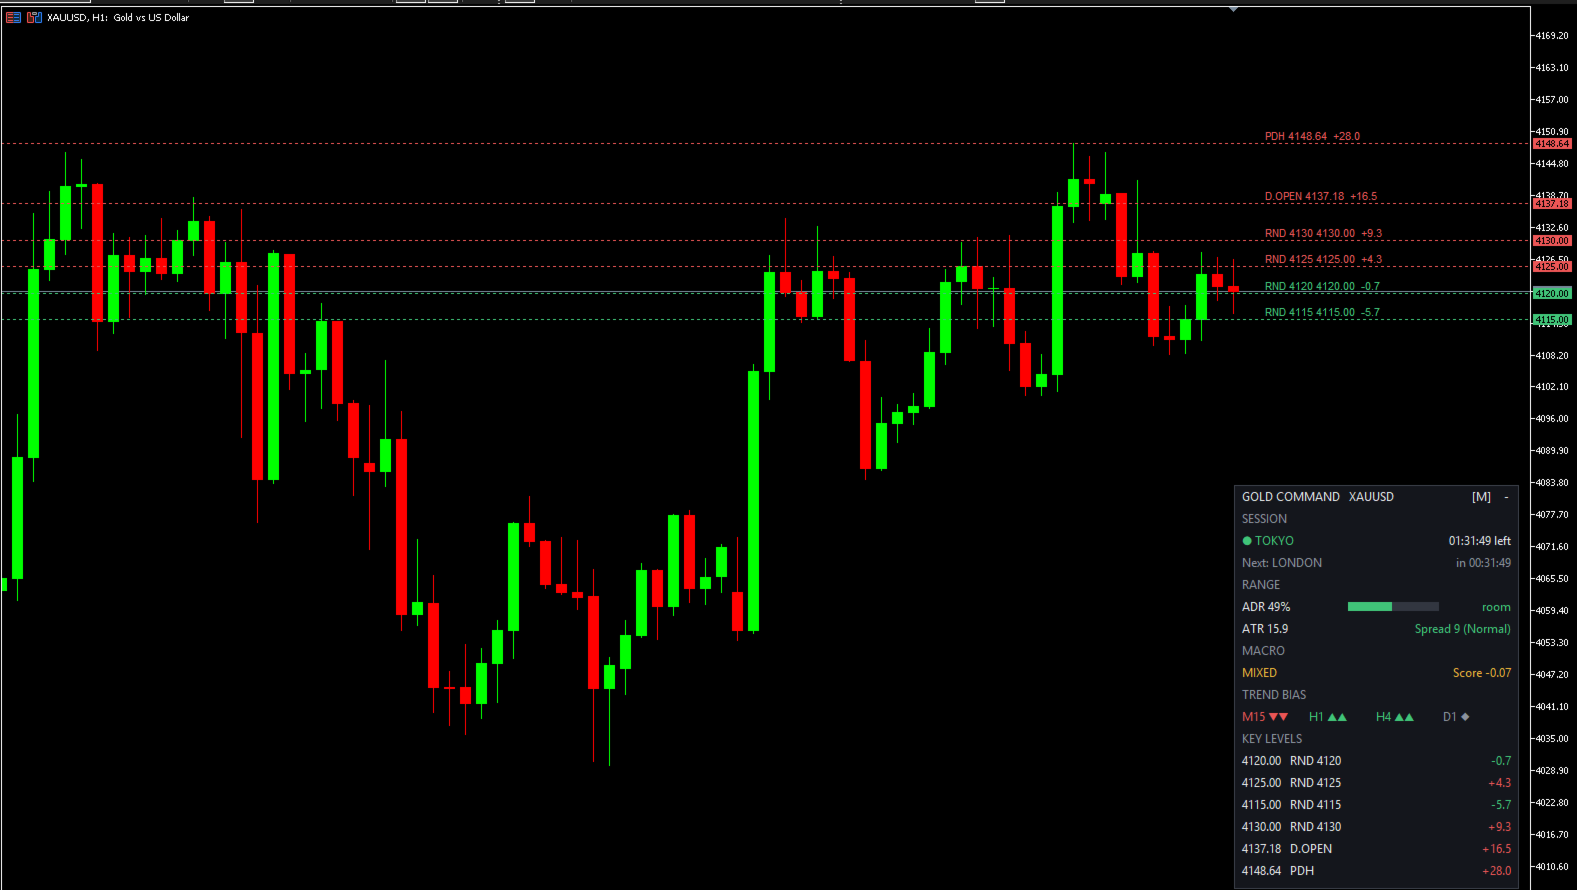
- SESSION - active session (Tokyo / London / New York, overlaps shown as "LONDON + NEW YORK"), countdown to the close and to the next session.
- RANGE - today's range as a % of ADR with a progress bar (green below 70% = "room", amber 70-100% = "extended", red above 100% = "exhausted"), ATR value and live spread (Normal / Wide / High, colored by your own thresholds).
- MACRO - a single verdict for gold: TAILWIND, HEADWIND or MIXED, with a numeric score from -1 to +1. (Pro adds the USD / Risk / Yield breakdown and the raw numbers behind it.)
- TREND BIAS - M15, H1, H4 and D1 at a glance: strong up, up, neutral, down, strong down.
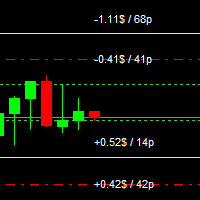
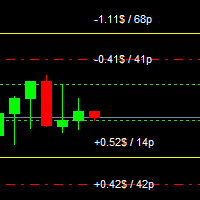
- KEY LEVELS - the 6 nearest levels to price (round numbers, previous day high/low, daily open) with the distance from the current price. Levels are also drawn on the chart as dotted lines with a tag.
How the Macro score works
The question it answers: "Is the macro environment helping or fighting gold right now?"
- USD strength - the move of 7 USD pairs (EURUSD, GBPUSD, AUDUSD, NZDUSD, USDJPY, USDCHF, USDCAD) since the reference point (default: today's daily open), each pair normalized by its own typical volatility, then combined with the median so one outlier (for example a JPY spike) cannot dominate. A stronger USD = headwind for gold.
- Risk - the move of a US stock index (the first of US500, SPX500, USA500, US500.cash that your broker offers). Risk-on = mild headwind.
- Yield - optional US yield symbol, if your broker offers one. Rising yields = headwind.
- Components are weighted (defaults 0.60 / 0.28 / 0.12). If a component is missing, the remaining weights are re-scaled automatically.
- Verdict: score above +0.20 = HEADWIND, below -0.20 = TAILWIND, otherwise MIXED, with a small hysteresis so the verdict does not flicker around the threshold.
- Missing data is shown as "--", never as 0. If fewer than 5 of the 7 USD pairs are available, no verdict is shown instead of a misleading one.
The weights and thresholds are sensible defaults, not an optimized or back-tested strategy - treat the verdict as context, not as a trade trigger.
How the Trend Bias works
For each timeframe: close vs EMA21 and EMA21 vs EMA50. Both bullish = strong up, one bullish = up, mixed = neutral, and the same in reverse for down. It is a quick directional filter, not a prediction.
Quick start
- Attach the indicator to any chart (it is designed for XAUUSD charts, M5-H4). The panel reads data for the gold symbol set in the inputs, so it keeps working even if the chart shows a different symbol (key level lines are only drawn when the chart symbol is the gold symbol).
- Check the broker symbol names. If the panel says "Symbol not found", set Gold symbol to your broker's name (XAUUSDm, GOLD, XAUUSD.r ...).
- If your broker uses suffixes on forex pairs (EURUSDm, EURUSD.r ...), enter it once in Suffix for the 7 USD pairs. Missing symbols are added to Market Watch automatically. If MACRO shows "no data", check these names.
- Set Risk index symbol to your broker's US index name if it is not detected automatically (you can list several, comma separated). Leave Yield symbol empty if your broker has none.
- Session hours are in UTC/GMT and do not adjust for daylight saving time. Default: Tokyo 00:00, London 08:00, New York 13:00, each 9 hours long. Shift the start hours in the inputs when your markets change to summer/winter time.
Panel controls
- Drag - hold the left mouse button on the panel title and move it anywhere on the chart. Position, size and collapsed state are remembered for each chart.
- [S] [M] [L] button - cycle panel size.
- - / + button - collapse or expand the panel.
- Dark or Light theme, panel position (X / Y) and refresh interval are set in the inputs.
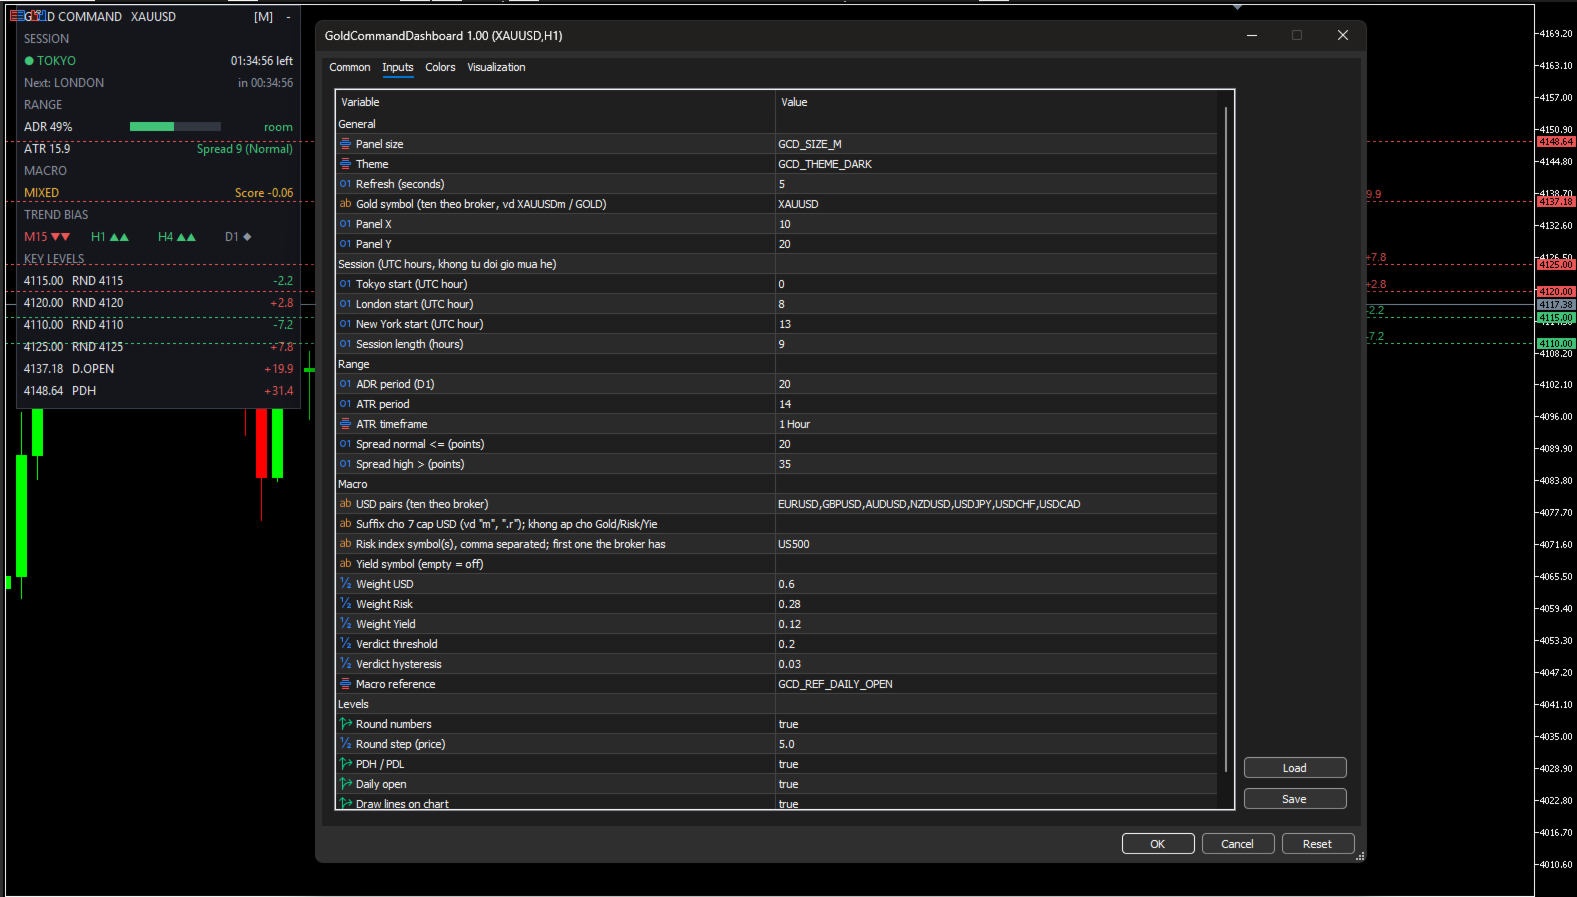
Main inputs
- General - panel size, theme, refresh seconds (default 5), gold symbol, panel X / Y.
- Session - Tokyo / London / New York start hour (UTC), session length.
- Range - ADR period (20), ATR period (14) and timeframe (H1), spread thresholds for Normal / High.
- Macro - USD pair list, pair suffix, risk symbol, yield symbol, component weights, verdict threshold and hysteresis, reference point (1 hour / 4 hours / daily open / previous close).
- Levels - round numbers on/off and step (default 5.0 price units), PDH/PDL, daily open, draw lines on chart.
Good to know
- The indicator uses no DLL and sends no web requests. It only reads quotes from your terminal.
- Everything is calculated every few seconds by a timer, so the panel stays live even when ticks are slow.
- All objects on the chart start with the prefix GCD_ and are removed when you remove the indicator.
- Level distances are shown in price units (for example +1.5 = 1.5 in gold price).
Want to be told instead of watching?
The free version shows you the state of the gold market. Gold Command Dashboard Pro is for traders who cannot stare at the chart all day:
- Economic calendar with a live "Next News" countdown (choose MetaTrader's built-in calendar or the Companion EA feed).
- Alerts (popup, push, Telegram): session open/close briefings, ADR reached, level touch, macro flip, news in 15 minutes, and Macro + Trend aligned.
- Strength meter 0-100, Auto support / resistance zones, session range vs 10-day average.
- Asia high / low and weekly open levels, and the full USD / Risk / Yield breakdown behind the macro verdict.
▶ Get Gold Command Dashboard Pro
Risk disclaimer: this indicator provides market context only. It is not financial advice and not a trading system. Past behaviour does not guarantee future results. Trading leveraged products carries a high level of risk.