Trend Suite Pro MT4
- Göstergeler
- Sürüm: 1.0
- Etkinleştirmeler: 20

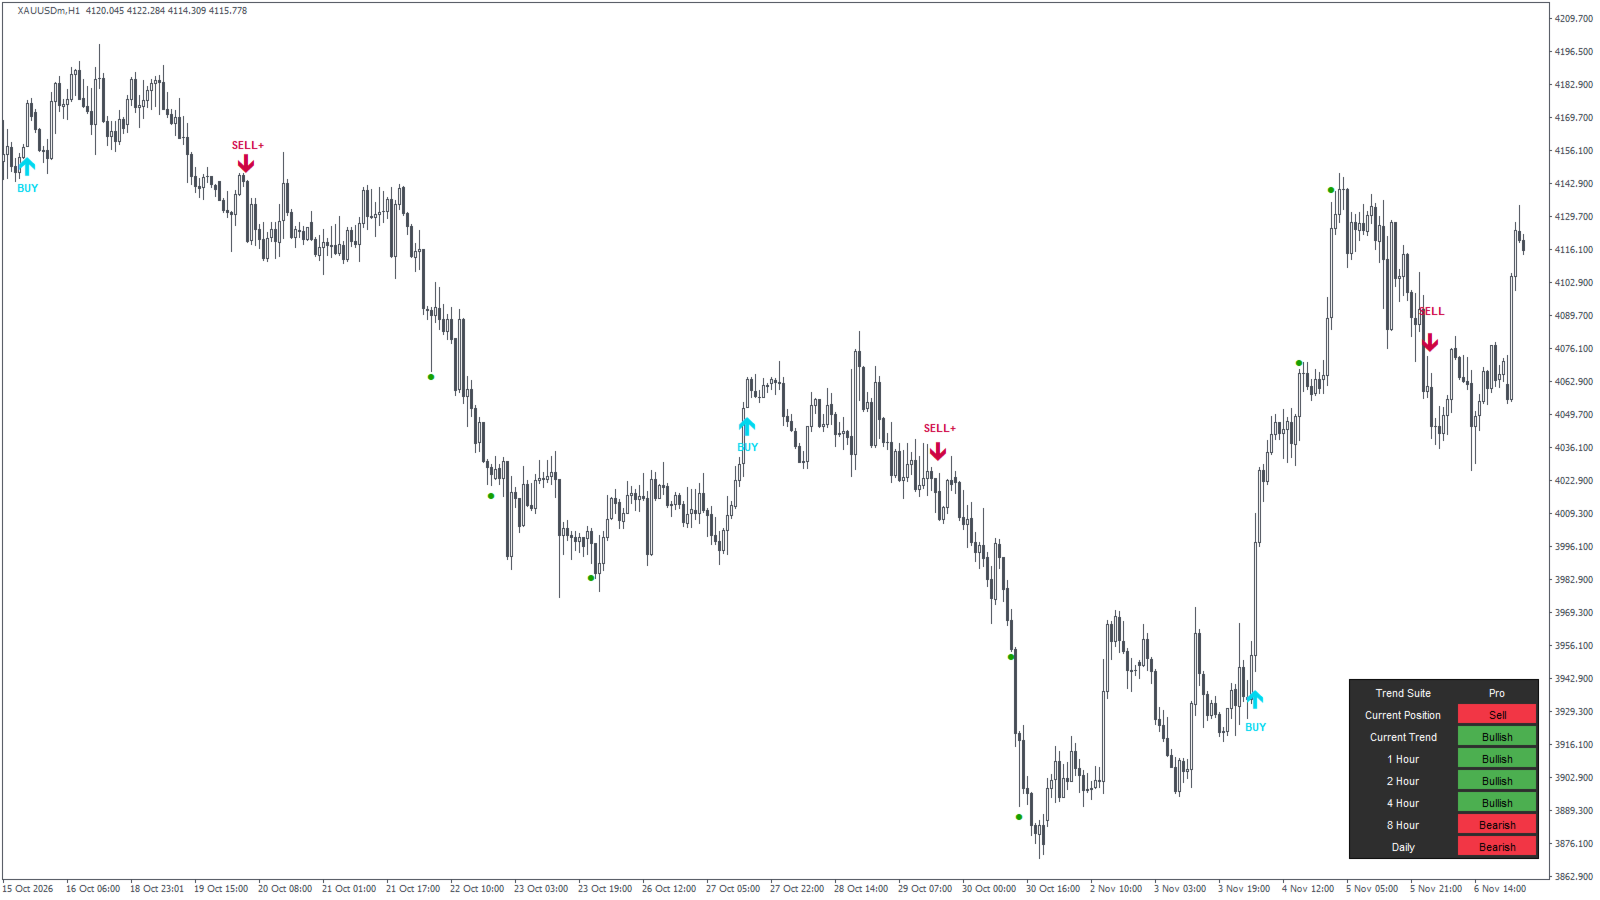
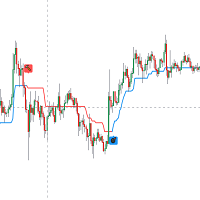
Most arrow indicators give you one buy arrow. This one gives you two, and the difference matters. BUY+ means price crossed the trend band while already above the 200 EMA, so you're going with the bigger trend. Plain BUY is the same cross below it, so you're fighting it. Same for SELL and SELL+.
On top of that there's a multi-timeframe dashboard and ten extra modules. They're all off when you load it. Turn on the two or three you actually use.
I checked the maths with a separate Python version of the same rules, bar by bar: 57,712 H1 gold bars on MT5 and 11,500 on MT4. Everything matched. That tells you the chart shows what the rules say. It doesn't make it a strategy.
What you get
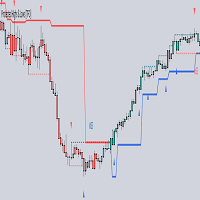
Signals. A trend band built from the bar's open (ATR 11), so it barely moves while the bar is forming. A close through it, on the right side of the 13 SMA, is a signal. The 200 EMA decides if it's printed as BUY or BUY+.
Bar colours (MT5 only). Candles keep the colour of the last signal.
TP/SL. Entry is the signal close. TP1/2/3 sit 1x, 2x and 3x (Risk Management x ATR 14) away, SL 1x on the other side. A green dot shows the first time price reaches each TP.
Dashboard. Last position, close vs 200 EMA on your chart, and the same test on 1H, 2H, 4H, 8H and Daily.
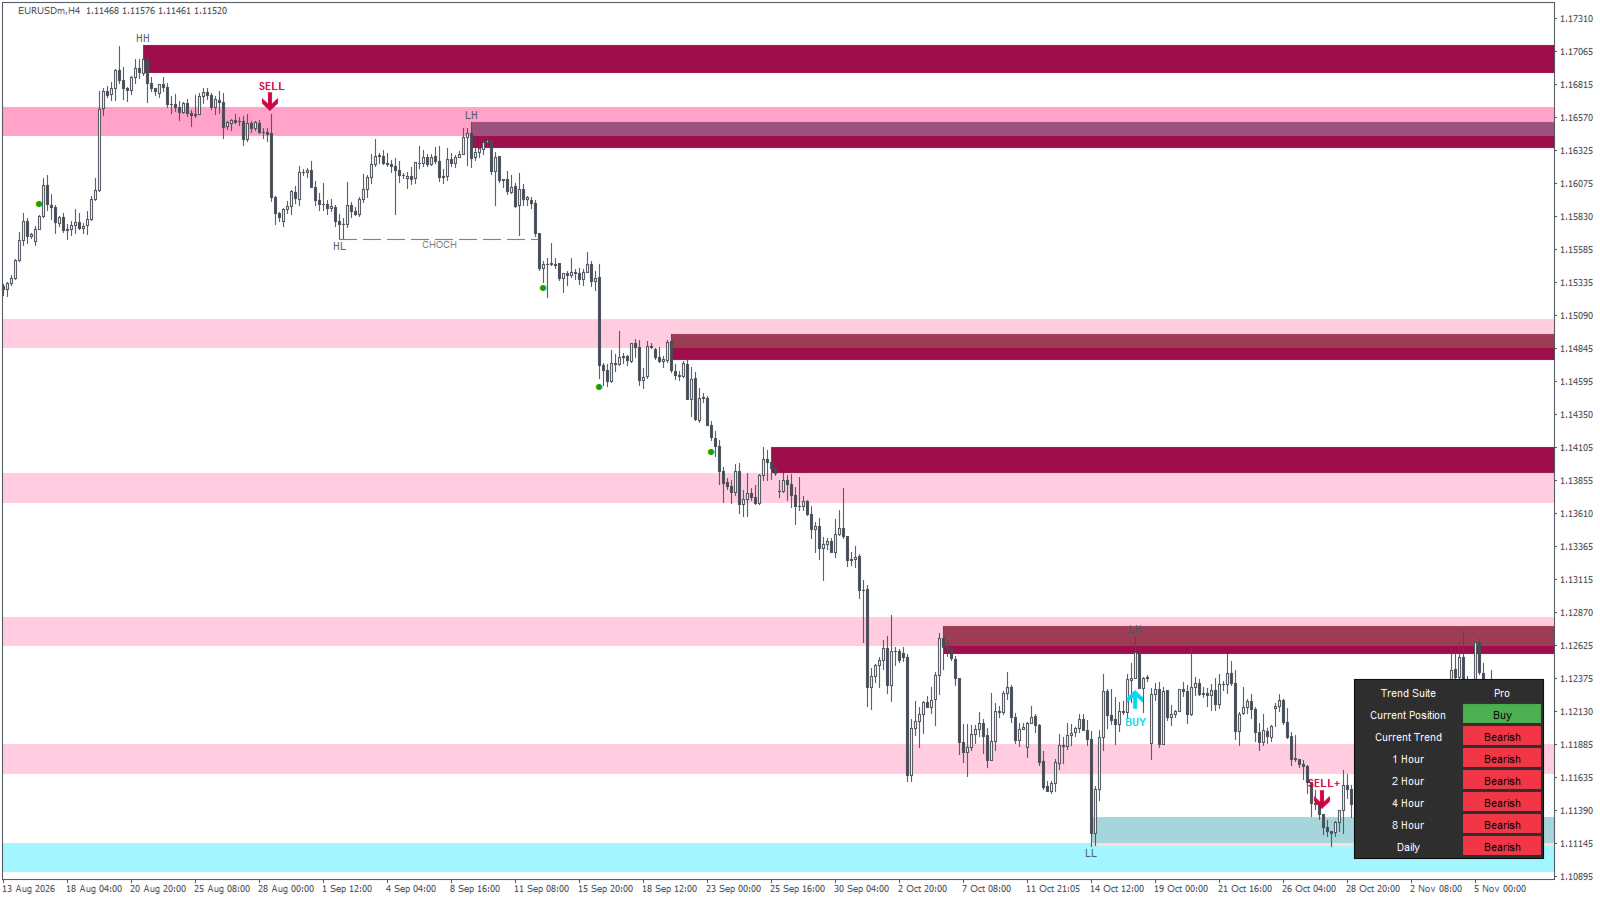
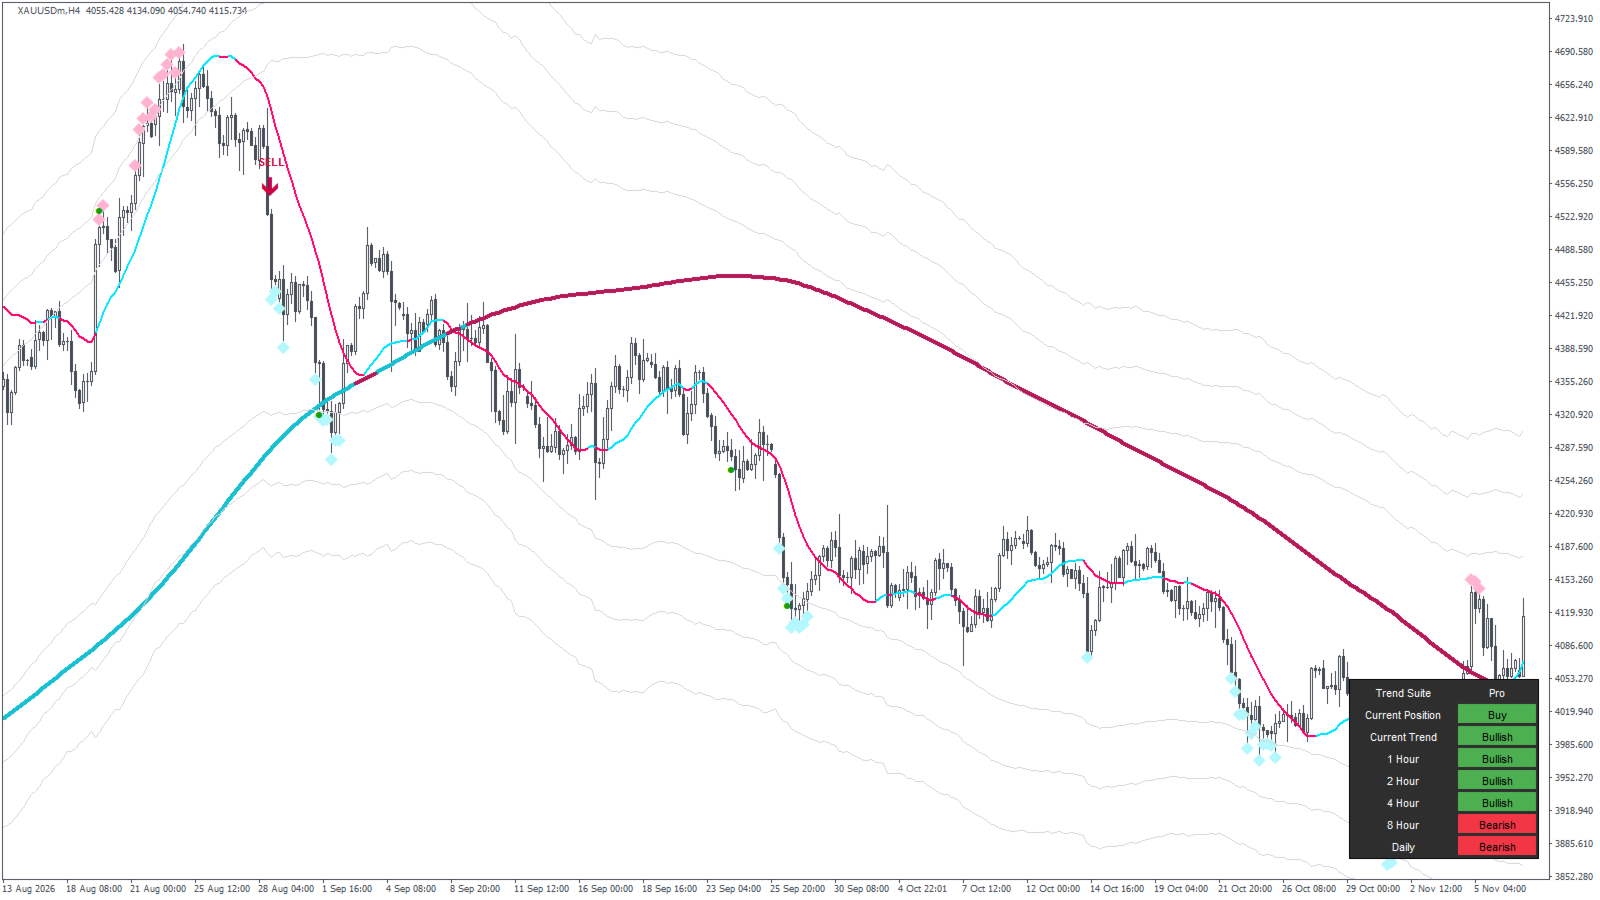
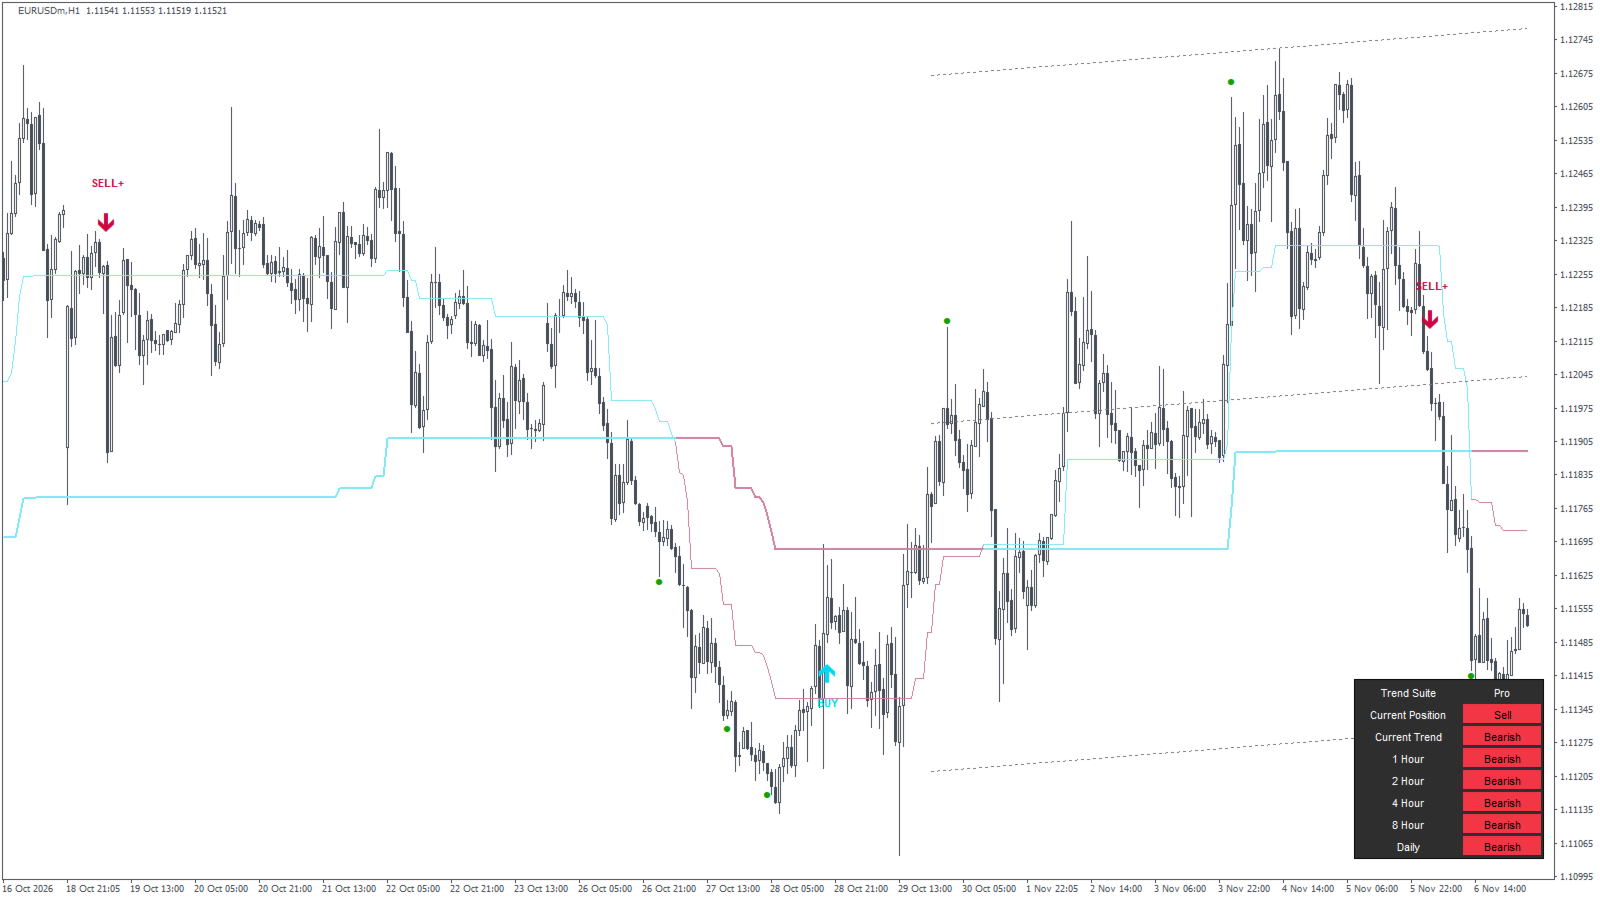
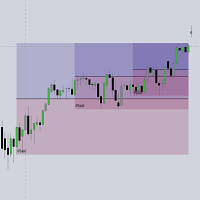
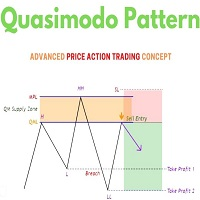
Ten modules: trailing stop, supply/demand boxes, Power MA, market structure (BOS/CHOCH), S/R zones, RSI reversals, reversal bands, trend lines, trend ribbon and retest zone.
Theres no order blocks, FVG or volume profile in here, and it doesn't trade.
How to read it
| On the chart | Means |
|---|---|
| BUY+ / SELL+ | Cross with the 200 EMA trend. The main signal |
| BUY / SELL | Cross against it. Weaker, smaller size or skip |
| Green dot | That TP was reached for the first time |
| Dashboard rows all one colour | Higher timeframes agree |
Long: take a BUY+ when the 4 Hour and Daily rows aren't both red and price isn't parked right under a supply box. The SL line is where the idea is wrong. Short is the same, flipped.
Skip it when the band gets crossed back and forth 3 or 4 times in a few dozen bars. That's a range and any crossing system loses alot of small trades there.
Settings
Only the BUY/SELL group changes signals. Modules, dashboard and colours only change what's drawn, so switch them on and off as much as you like.
Signals
| Setting | Default | What it does | When to change it |
|---|---|---|---|
| Signal Mode | All | All, Normal (BUY/SELL only) or Strong (BUY+/SELL+ only) | Strong if you only want with-trend trades. Alerts follow this too |
| Signal Sensitivity (1-15) | 5 | Band width in ATRs. Higher = fewer, later signals | Raise it if it flips too much, lower it for earlier entries with more noise |
| MA Filter | false | Buys need close above the MA, sells below | Turn on for a second trend gate |
| MA Filter type / length | SMA / 200 | SMA, EMA, WMA, VWMA or HMA | Shorter length blocks less |
| Show Bar Colors | true | Paints candles (MT5 only) | Off if you use your own candle colours |
Modules
Switch them on in the INDICATORS group. Their settings are in their own groups further down.
| Module | Main settings | Notes |
|---|---|---|
| Trailing Stop Loss | Initial Stop 0.1, Risk Increment 0.01, Max Risk 0.03, Zone Width 0.3 | Parabolic SAR dots plus a second line Zone Width x ATR 100 inside it |
| Supply/Demand | Swing Length 10, History 21, Box Width 10, Extend on | Box starts at a swing, height is Box Width/10 x ATR 300. Gone once a close breaks through it |
| Power MA | ZLEMA length 50 | Zero-lag EMA, cyan rising, pink falling |
| Market Structure | Swing Length 45, Confirmation Candle Close | 45 is slow. 15-20 fits intraday. Wicks breaks levels earlier but fakes more |
| S/R | S&R Strength 2, SR Zones on | How many pivots must cluster. 1 = lots of zones, 3-4 = only the busy ones |
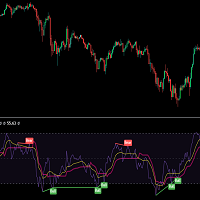
| Reversals | none | RSI 14 under 30 or over 70. Marks every bar in the area |
| Reversal Bands | Lengths 80, Multipliers 5/7/9, Style Range | Three envelopes. ATR style needs long history (ATR Length 2000) |
| Trend Lines | Line Style, Width, Extend | 150-bar regression channel, redraws every bar |
| Trend Ribbon | none | HMA 600 |
| Retest Zone | none | Cloud between two range filters |
TP/SL = Yes shows the level lines and prices; Risk Management (3) is the TP multiplier. Dashboard has Location and Size. Bars back to draw objects (2000) keeps old labels from piling up.
I've only run the defaults on gold H1 and EURUSD H4 so I'm not handing you made-up presets. If you touch three things make it Signal Mode, Signal Sensitivity and the timeframe.
Alerts
Popup, phone push, email, and on MT5 also Telegram (with or without a screenshot). Separate switches for signals and TP hits. By default it waits for the bar to close so you dont get a signal that disappears mid-bar.
Limits
- TP/SL use the current ATR, not the one at entry, so the lines drift a bit while the trade runs.
- On the forming bar a signal can show up and vanish before the close. Alerts wait for the close, the chart doesn't.
- Sideways markets will chop it up.
There's no win rate here, and I'd be careful with any indicator listing that has one.
Quick questions
MT4 or MT5? Same numbers on both. MT5 adds candle colours, filled zones and Telegram.
Repaint? Structure, supply/demand and S/R come from closed bars and stay put. Signals are final at the close.
Timeframe? I've looked at H1 and H4. Lower works but gets noisy.
EA use? Arrows are buffers 5/6 on MT5, 0/1 on MT4. Entry, TPs, SL and signal type have their own buffers, ask me for the map.
Message me on MQL5 with a screenshot showing the dashboard, symbol and timeframe. Updates are free.
Analysis tool. It places no trades and makes no profitability claim. Past price behaviour is not a guide to future price behaviour.