Rejection Candles Pro

Rejection Candles Pro marks candles where price was pushed one way and thrown back, and lets you keep only the ones your chosen filters agree with. It works on any symbol and any timeframe.

What it marks

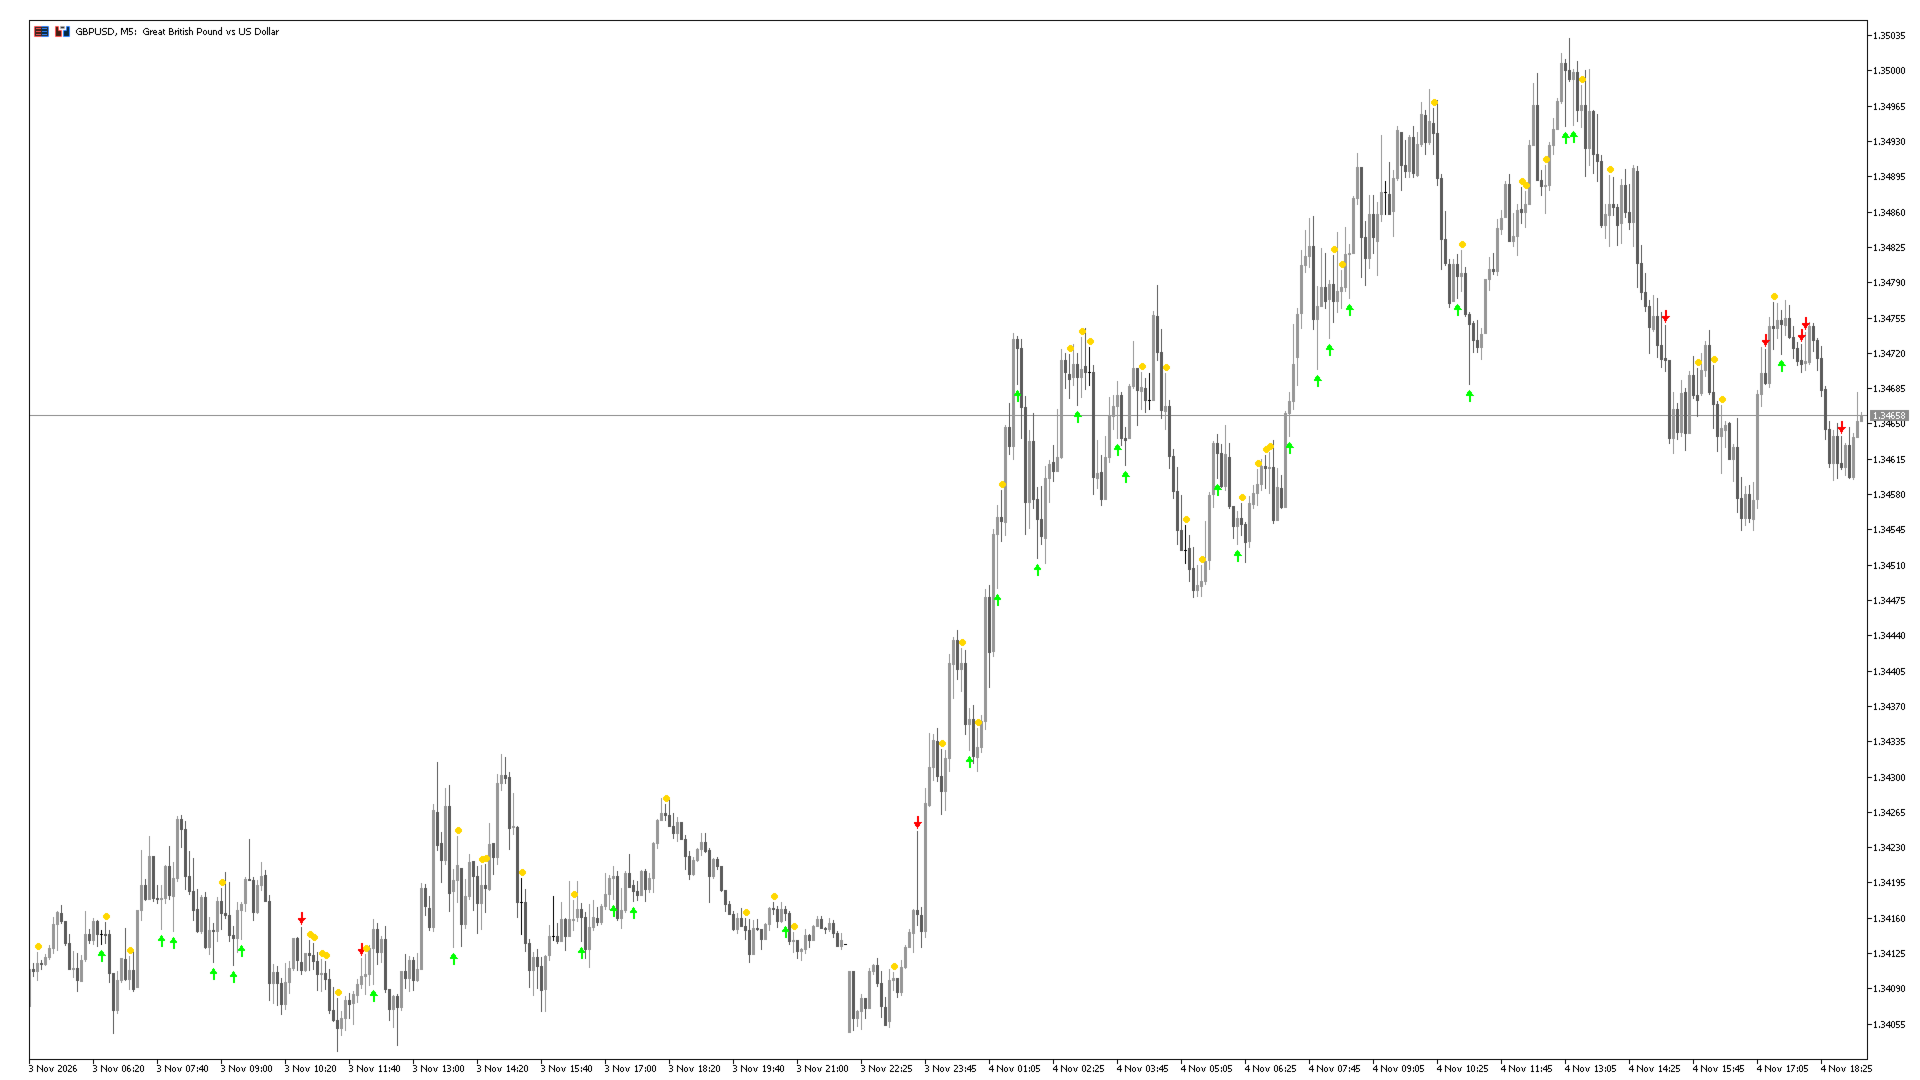
  • Rejection from below (green arrow under the candle): hammer, dragonfly doji, bullish pin bar.
  • Rejection from above (red arrow over the candle): inverted hammer, shooting star, gravestone doji.
  • Rejection from both sides (gold dot, optional): long-legged doji and spinning top.

Three filters

Switch on any of them, alone or together. With all of them off you see every rejection candle.

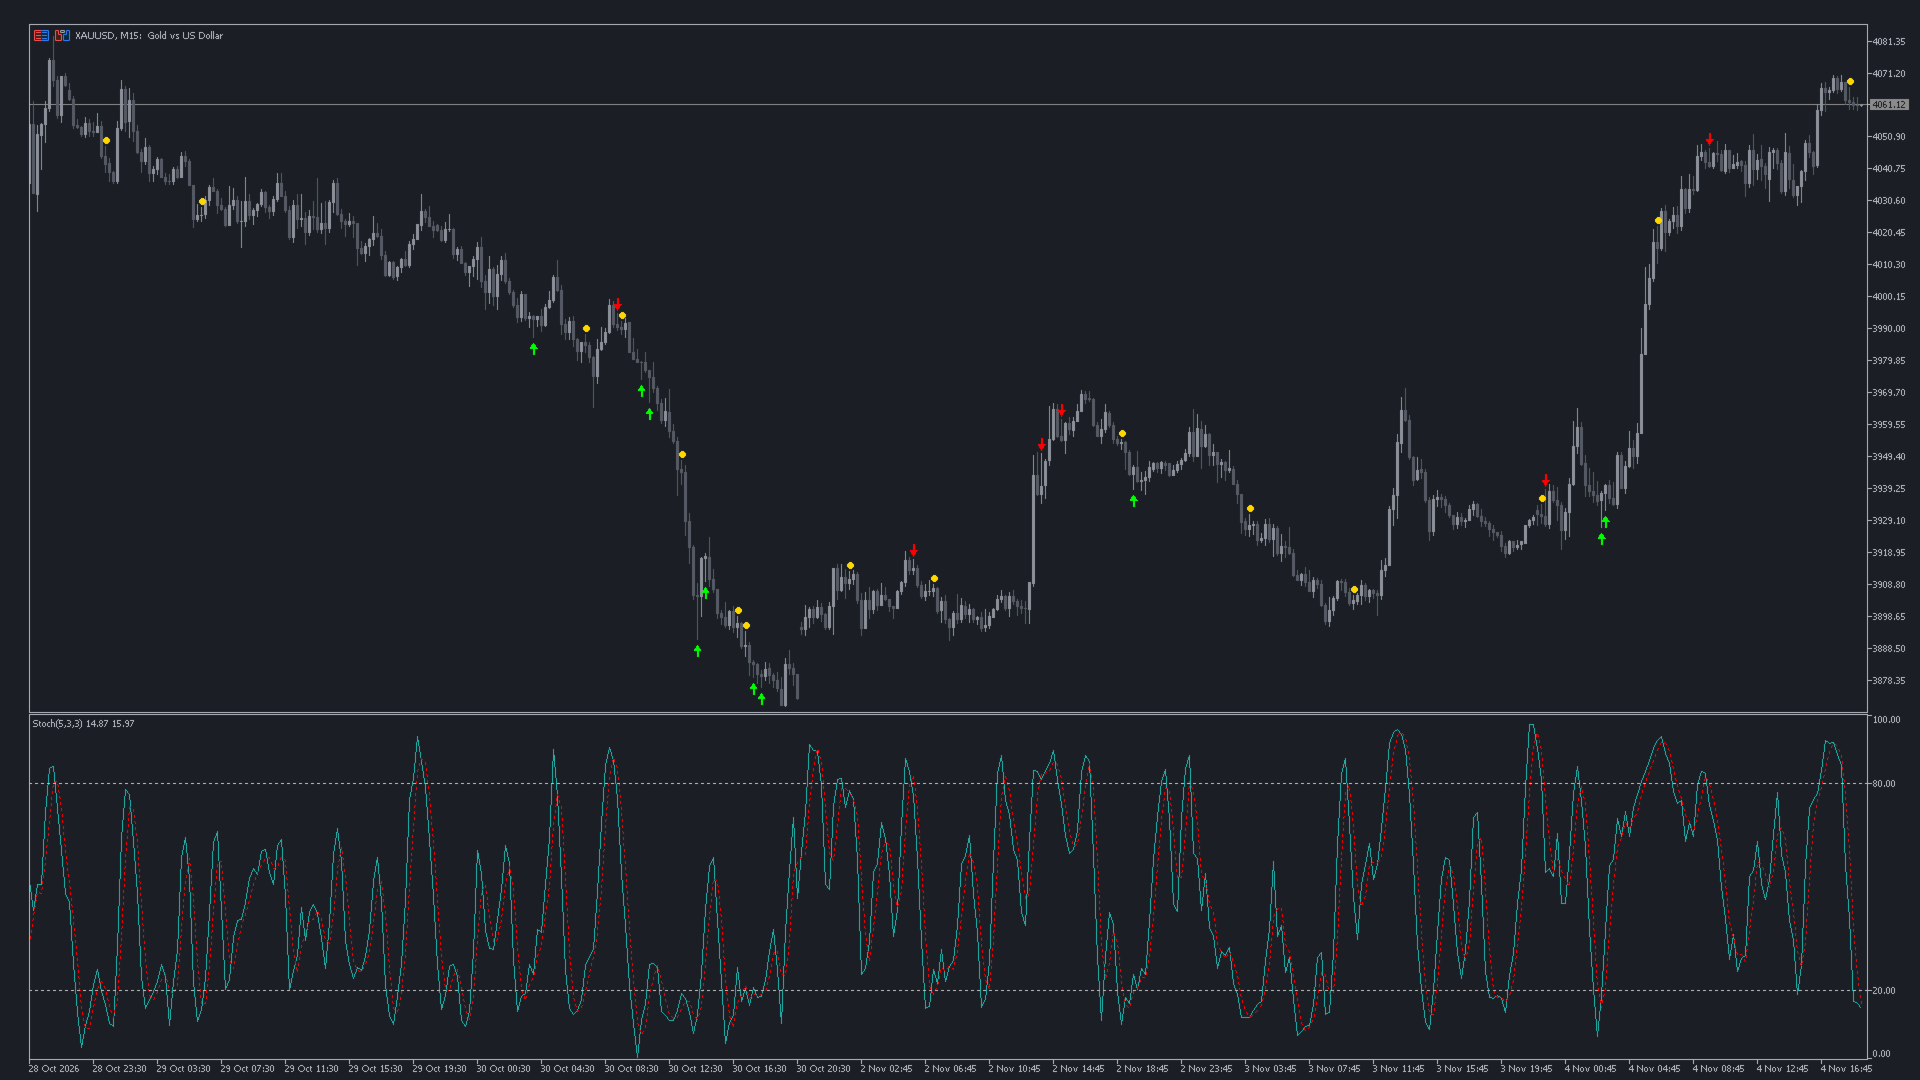
  • Stochastic: an arrow stays only when Stochastic agrees with it. Its settings are adjustable.
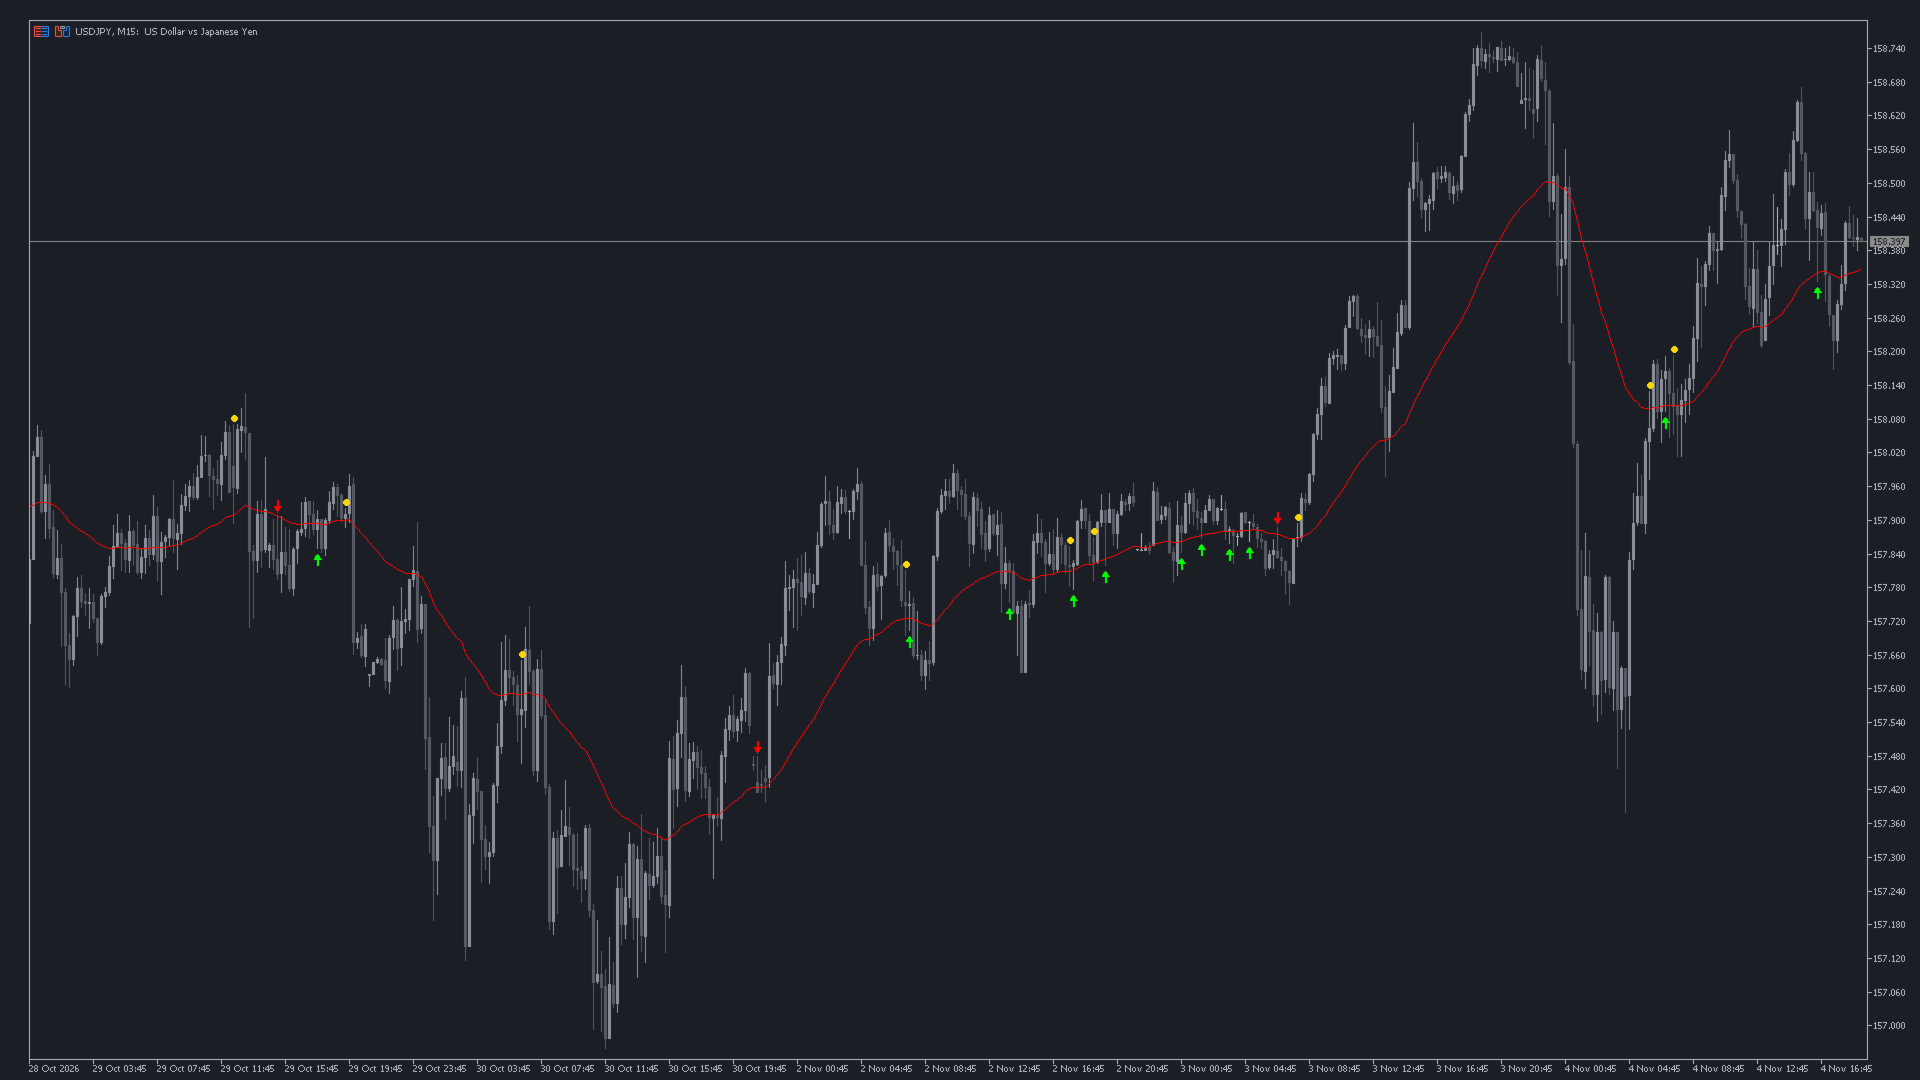
  • Moving average: an arrow stays only when the candle is rejected at the moving average, used as support or resistance. Period and method are adjustable.
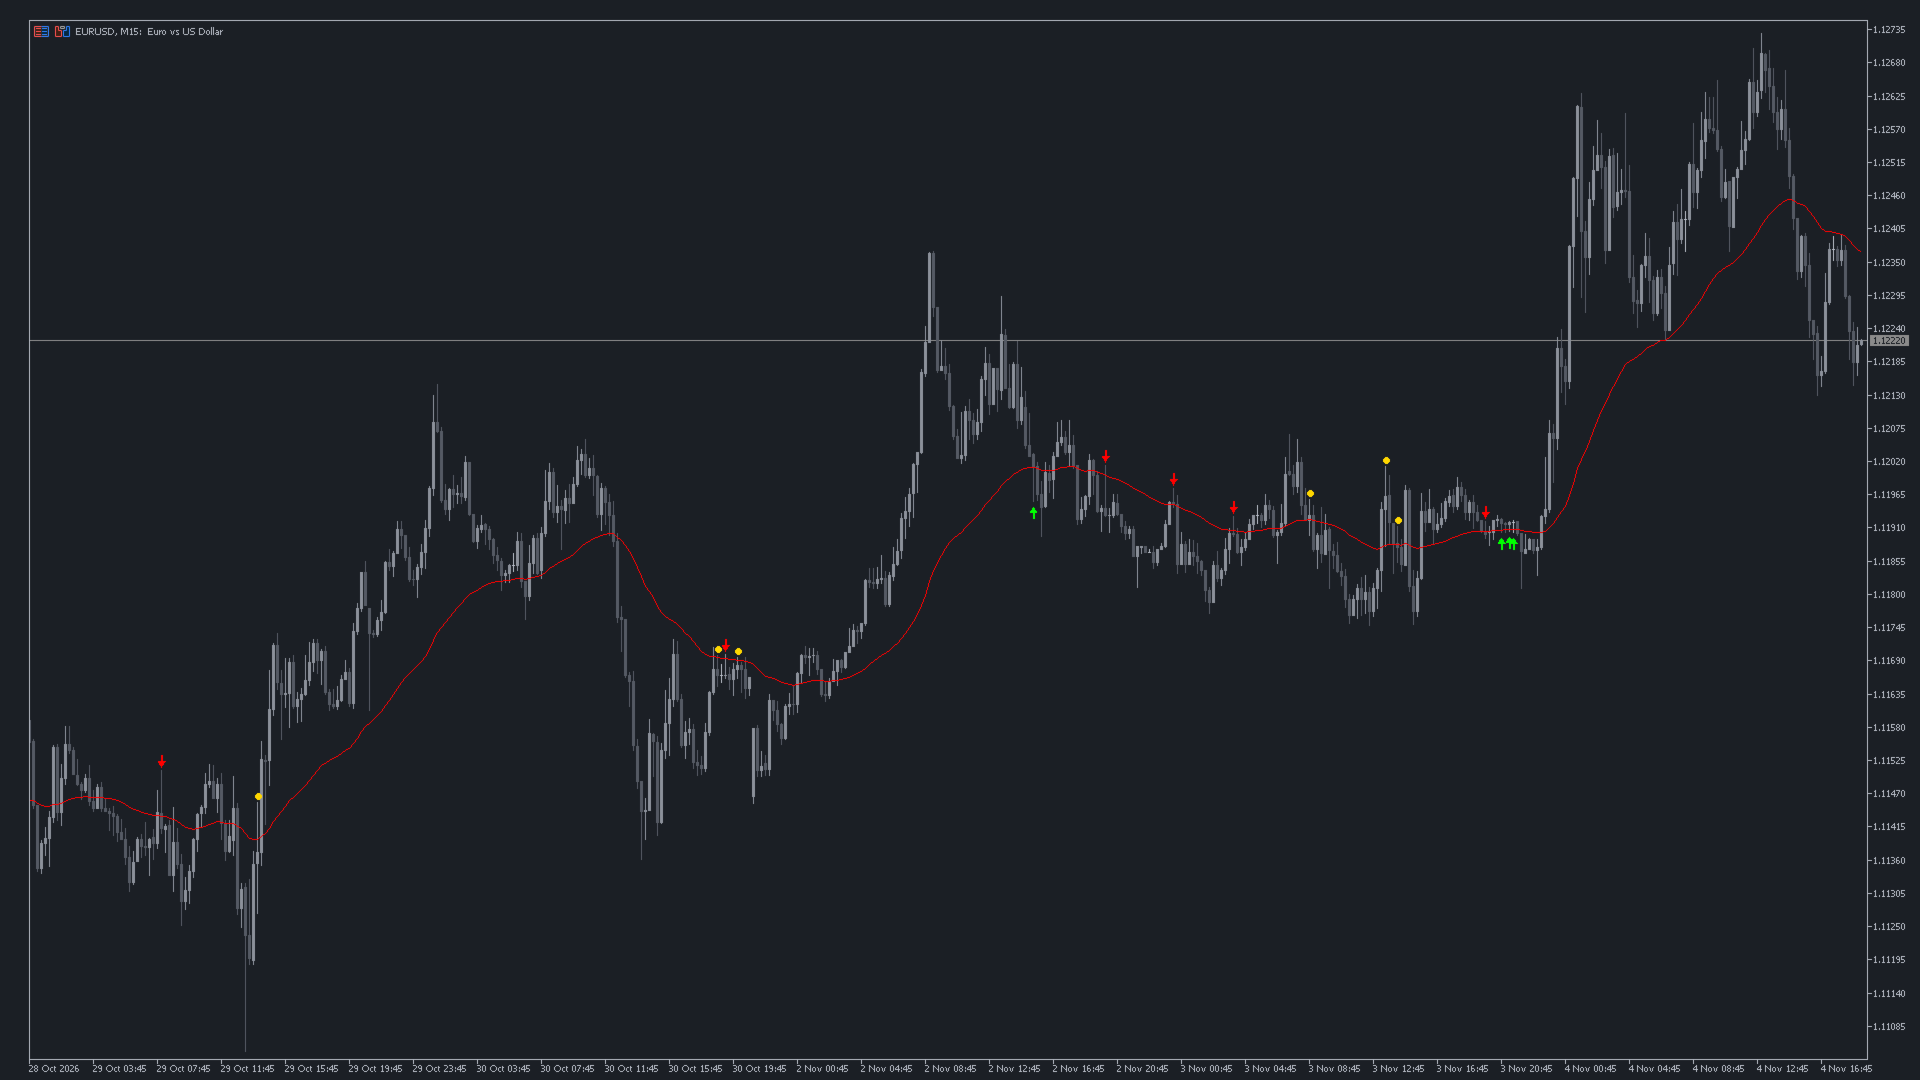
  • Higher timeframe trend: an arrow stays only when it agrees with the trend of the next higher timeframe. This is chosen for you: M1 uses M5, M5 uses M15, M15 uses M30, M30 uses H1, H1 uses H4, H4 uses D1, D1 uses W1. The trend EMA period is adjustable.
  • Each chart can run its own filters, for example the higher timeframe trend on one symbol and Stochastic on another.

Alerts

  • Pop-up, sound, push notification to your phone and e-mail, once per new marked candle.
  • The alert names the pattern and the filters it passed, for example: EURJPY M1: rejection from ABOVE - Inverted hammer / shooting star (confirmed: M5-trend).

Good to know

  • Only closed candles are marked, so an arrow never appears or disappears while a candle is forming, and past arrows do not repaint.
  • It runs light on many charts at the same time.
  • It works on dark and light chart themes, and follows the chart as you scroll and zoom. Arrow size, distance and colours are adjustable.
  • It does not open or manage trades.
  • It has no output buffers and draws no chart objects that other programs can read.
  • It does not calculate in the Strategy Tester's non-visual mode. Use it on a chart, or in the tester's visual mode.
  • A free version, Rejection Candles, marks the same candles without the filters.
  • A filtered rejection candle shows where price was turned back under the conditions you chose. It is not a prediction that price will keep moving that way. Use it together with your own analysis and risk management.
Yazarın diğer ürünleri
Graded Liquidity Sweep
Kaustubh Pradeep Deshmukh
This indicator marks the candles where price runs through a liquidity level and turns back. It finds and ranks the levels by itself, so there is nothing to draw by hand. It is made for manual trading on any symbol and timeframe. What you see on the chart A buy or sell arrow on the candle that confirms the reversal. Arrows appear only after that candle has closed, and they do not repaint. For every signal: the level that was swept, a stop level and two target levels. A label with the type of leve
Rejection Candles
Kaustubh Pradeep Deshmukh
Rejection Candles marks candles where price was pushed one way and thrown back: a small body with a long wick. It works on any symbol and any timeframe. What it marks Rejection from below (green arrow under the candle): hammer, dragonfly doji, bullish pin bar. The long wick is the lower one. Rejection from above (red arrow over the candle): inverted hammer, shooting star, gravestone doji. The long wick is the upper one. Rejection from both sides (gold dot, optional): long-legged doji and spinnin
FREE
Key Zones Volume Profile
Kaustubh Pradeep Deshmukh
Key Zones draws the price zones that matter on your chart, by itself. It marks support and resistance where price has turned more than once, and volume zones where the most tick volume has traded. Nothing needs to be drawn by hand, and the zones update as new candles close. It works on any symbol and timeframe: forex, metals, indices, crypto and synthetic indices. What you see on the chart Support zones (green) below price and resistance zones (red) above price. A zone turns amber while price is
FREE
Price Pattern Breakouts
Kaustubh Pradeep Deshmukh
Price Pattern Breakouts scans the price for chart patterns automatically and marks each breakout with a buy or sell arrow. It is made for manual trading on any symbol and timeframe. Please note An arrow shows that price has broken out of a pattern. It does not guarantee that a trade will be profitable, and breakouts can fail. Confirm each arrow with other indicators or your own analysis, and always use proper risk management. What you see on the chart A buy arrow below the price for an upward br
Manual Grid Trader is a trade panel for traders who choose their own entries and want the grid around them placed and managed for them. You press BUY or SELL; the panel opens the entry, places the further levels, and closes the whole basket together at one take profit. Please note This is a tool for manual trading. It does not decide when to enter and it does not predict price. Grid trading adds positions while price moves against the basket, so losses can grow quickly, especially with a lot mul
Honest Signals
Kaustubh Pradeep Deshmukh
Model Filtered Signals marks buy and sell signals on the chart, but only the ones a trained model accepts. Every candidate signal is scored by the model, and the arrow is shown only when its confidence is high enough. The confidence figure is printed beside each arrow, so you can see how strongly the model rated it. Please note The model filters signals; it does not guarantee that a trade will be profitable, and accepted signals can still fail. Use the arrows together with your own analysis and
Aurum Pullback
Kaustubh Pradeep Deshmukh
AURUM PULLBACK - Gold (XAUUSD) Expert Advisor for the M1 chart Please backtest Aurum Pullback on your own broker before you buy. Download the free demo, run it in your Strategy Tester on XAUUSD M1 with your broker's data, and judge the results yourself. Brokers differ in price feed, spread and commission, and I would rather you see real numbers from your own broker than rely on my screenshots. WHAT IT DOES Aurum Pullback trades gold on the one-minute chart and always trades in the direction
Graded Structure Zones
Kaustubh Pradeep Deshmukh
Graded Structure Zones maps the market on three timeframes at once: the trend, and the zones price may pull back into. It finds order blocks and fair value gaps by itself, grades each one Strong, Medium or Weak, and removes them once price has used them up. There are no arrows. It is a chart-reading tool for manual trading on any symbol and timeframe. What you see on the chart Order blocks (OB) and fair value gaps (FVG) from the chart timeframe and two higher timeframes (H1 and H4 by default), d
StretchTurnLevels
Kaustubh Pradeep Deshmukh
Stretch Turn Levels marks turning points on the chart. Instead of arrows, it draws the level that matters for each turn and tints the candles while that turn is still in play. There are no buy or sell calls: it shows the situation, and you decide what to do with it. What you see on the chart Turn level - a line at the extreme of each turn: under an up turn, above a down turn. It runs to the right until a candle closes beyond it, so you can see at a glance whether the turn is still holding. Tinte
Filtrele:
Değerlendirme yok
Değerlendirmeye yanıt