Arixis Volume Bubbles
- Göstergeler
- Sürüm: 1.0

Arixis Volume Bubbles
Visualize Market Activity with Dynamic Volume Bubbles
Arixis Volume Bubbles is a professional MetaTrader 5 indicator designed to identify and visualize periods of unusually high market activity directly on your trading chart.
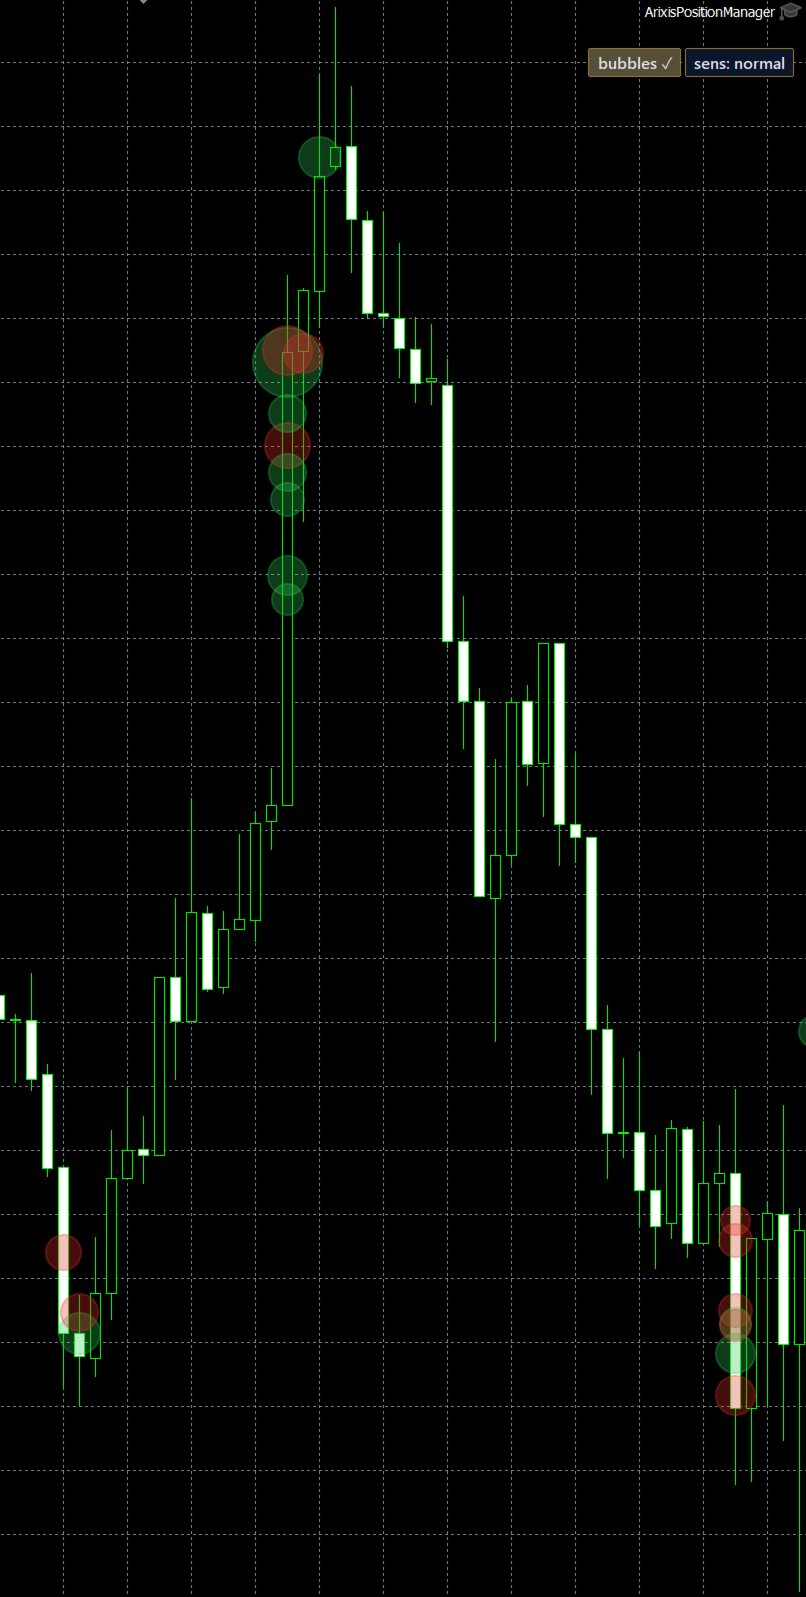
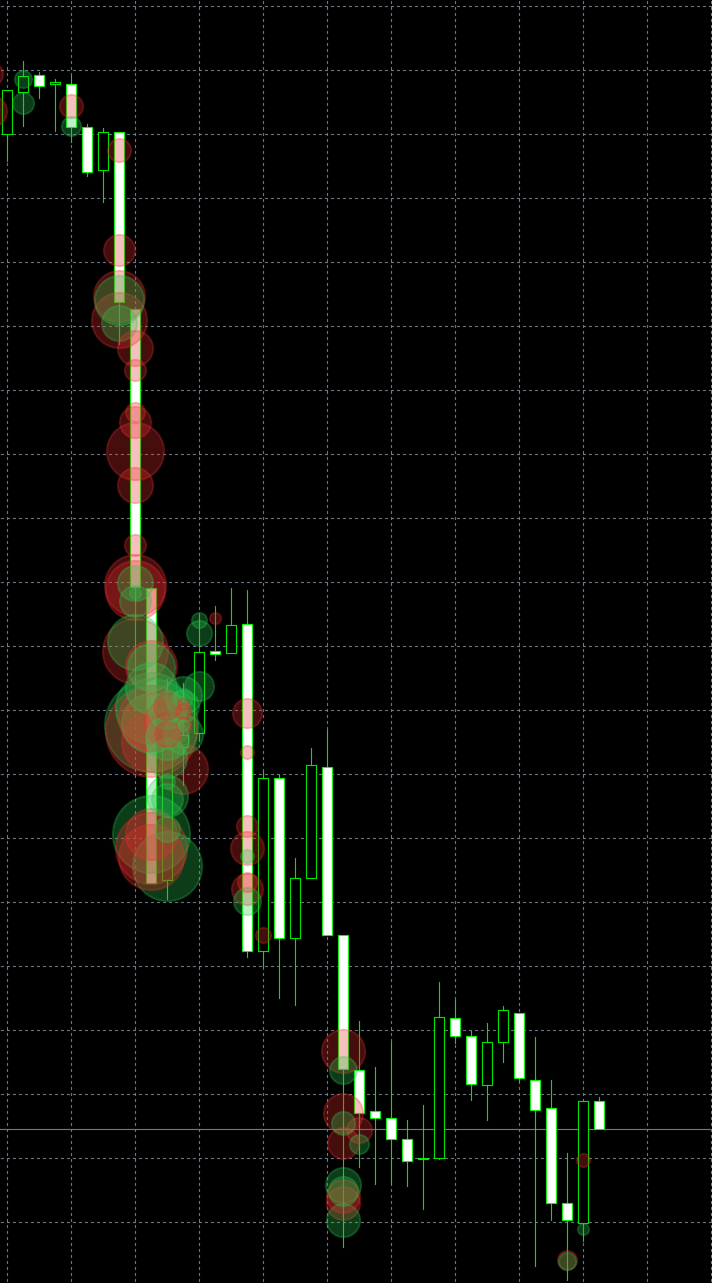
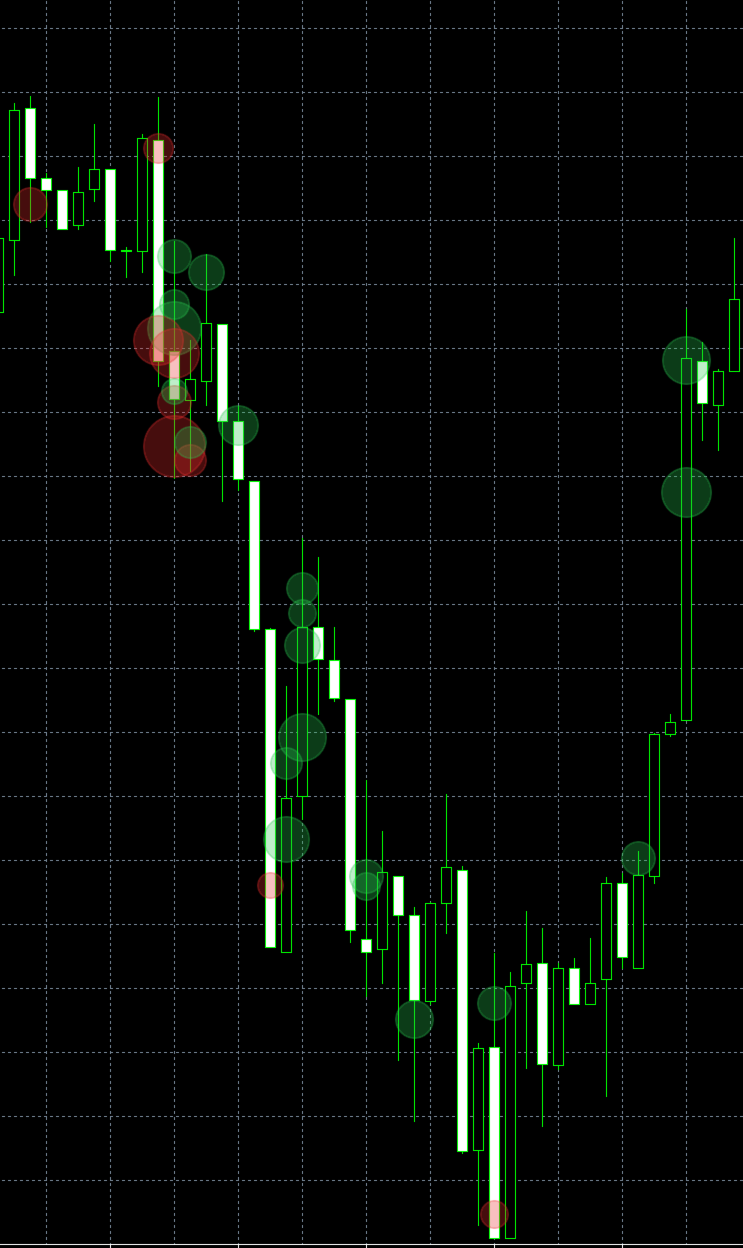
The indicator analyzes tick activity and represents significant activity episodes through dynamically sized bubbles, allowing traders to observe when and where market activity intensifies.
Each bubble provides visual information about the relative strength and estimated direction of market activity.
Key Features
-
Dynamic Volume Bubbles: Visual representation of significant market activity through bubbles of different sizes.
-
Activity Strength Detection: Larger bubbles indicate stronger activity relative to the historical reference.
-
Directional Visualization: Green and red bubbles distinguish estimated bullish and bearish activity.
-
Real-Time Monitoring: Detects new activity episodes as market data becomes available.
-
Historical Analysis: Displays past activity and supports estimates when detailed historical tick data is unavailable.
-
Adjustable Sensitivity: Customize the detection of activity episodes according to your trading preferences.
-
Customizable Appearance: Configure bubble dimensions, transparency and visual settings.
-
Integrated Toolbar: Convenient controls for bubble visibility and sensitivity.
How to Interpret Volume Bubbles
1. Bubble Size
The size of each bubble represents the relative intensity of detected market activity.
-
Large bubble: Unusually high activity compared with the reference baseline.
-
Medium bubble: Moderate activity intensity.
-
Small bubble: Lower relative activity intensity.
A large bubble does not necessarily indicate a large amount of money or contracts traded.
2. Bubble Colors
Green bubbles represent activity associated with upward price movement.
Red bubbles represent activity associated with downward price movement.
The colors are directional estimates and do not directly measure aggressive institutional buying or selling.
3. Large Bubbles Near Support and Resistance
When a large bubble appears near an important price level, it indicates that market activity intensified in that area.
Traders can observe whether price subsequently rejects the level, breaks through it or consolidates around it.
4. Multiple Bubbles in the Same Area
A concentration of bubbles can highlight a region of repeated or sustained activity.
These areas may be useful for further analysis, but they do not automatically represent support, resistance or future reversal points.
5. Sensitivity Settings
Increasing sensitivity allows the indicator to display more activity episodes.
Reducing sensitivity helps focus on stronger activity events.
Practical Trading Example
Suppose XAUUSD approaches a previously identified resistance level.
A large red bubble appears near that level, indicating elevated market activity associated with downward price movement.
The trader can then analyze subsequent candles and market structure to determine whether the price is rejecting resistance or continuing through it.
The bubble itself is not a standalone sell signal.
Important Information
Arixis Volume Bubbles primarily analyzes tick activity on Forex and CFD instruments. Tick activity measures quotation updates and should not be confused with actual traded volume.
When the broker provides suitable trade-tick volume data, the indicator can use that information. Historical estimates may also be displayed when detailed tick data is unavailable.
The indicator does not measure order-book liquidity, identify institutional orders or guarantee future price movements.
Arixis Volume Bubbles is an analytical visualization tool designed to complement price action, technical analysis and market structure.