Arixis Volume Bubbles

Arixis Volume Bubbles

Visualize Market Activity with Dynamic Volume Bubbles

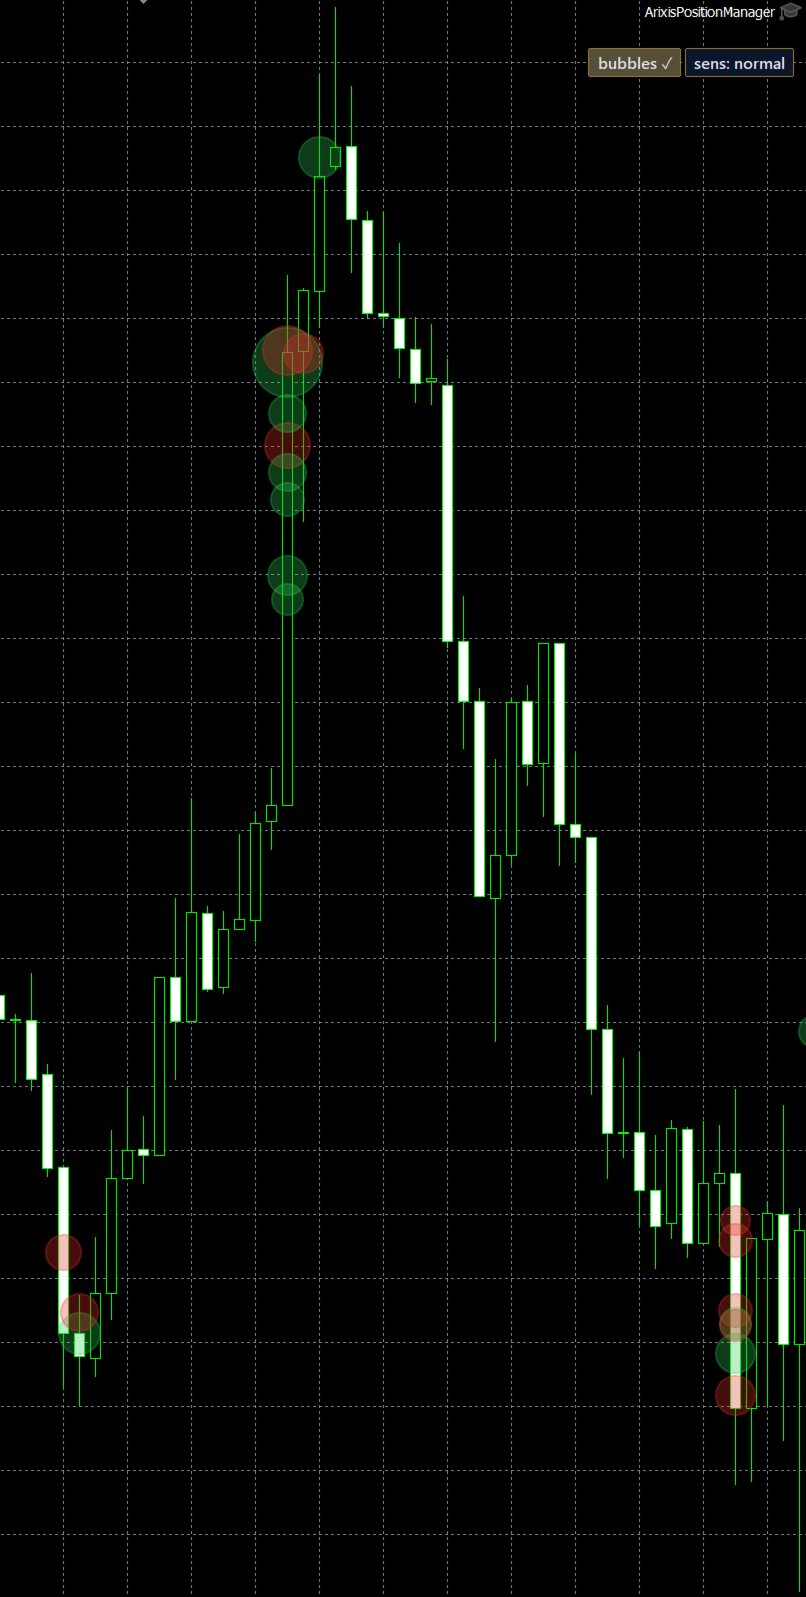
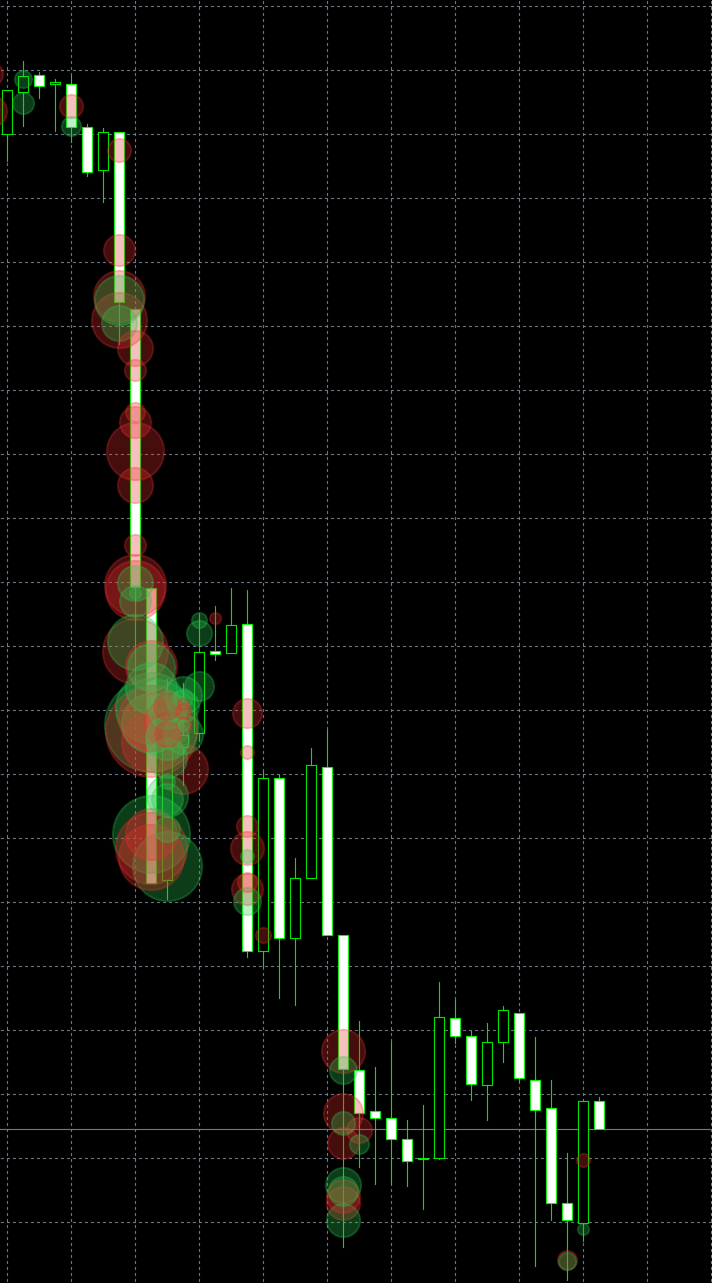
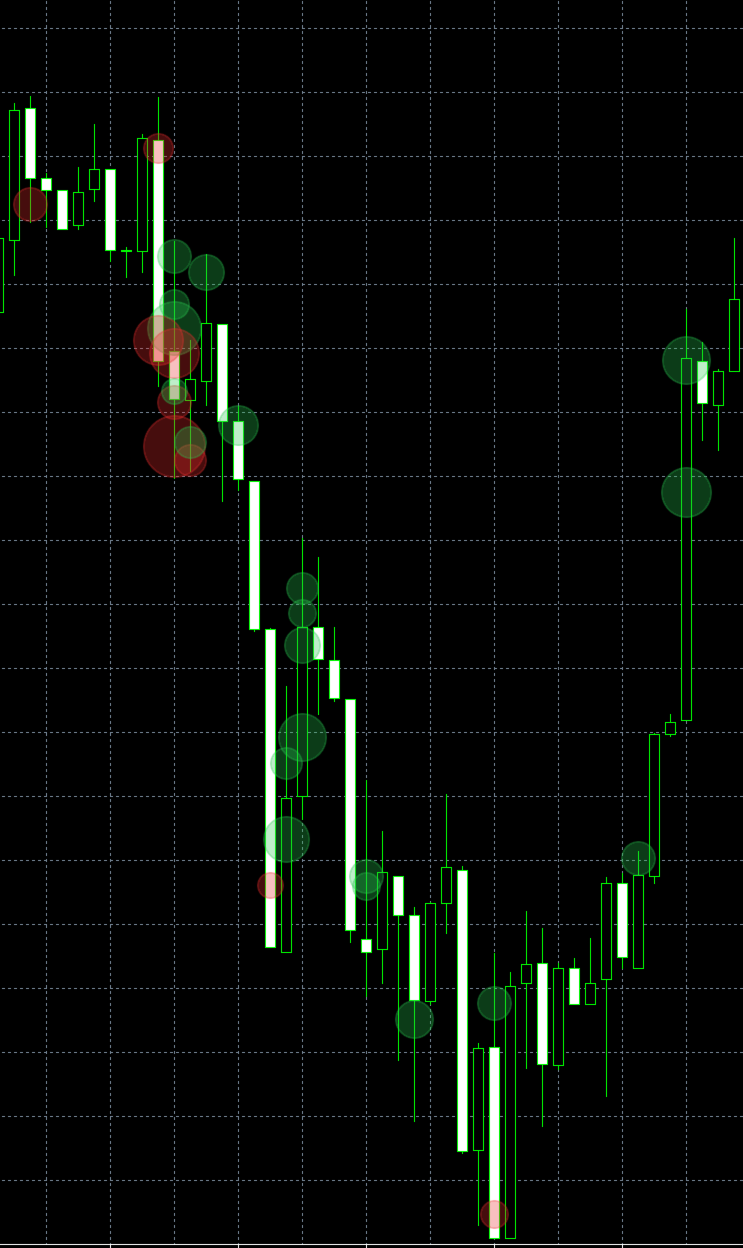
Arixis Volume Bubbles is a professional MetaTrader 5 indicator designed to identify and visualize periods of unusually high market activity directly on your trading chart.

The indicator analyzes tick activity and represents significant activity episodes through dynamically sized bubbles, allowing traders to observe when and where market activity intensifies.

Each bubble provides visual information about the relative strength and estimated direction of market activity.

Key Features

  • Dynamic Volume Bubbles: Visual representation of significant market activity through bubbles of different sizes.

  • Activity Strength Detection: Larger bubbles indicate stronger activity relative to the historical reference.

  • Directional Visualization: Green and red bubbles distinguish estimated bullish and bearish activity.

  • Real-Time Monitoring: Detects new activity episodes as market data becomes available.

  • Historical Analysis: Displays past activity and supports estimates when detailed historical tick data is unavailable.

  • Adjustable Sensitivity: Customize the detection of activity episodes according to your trading preferences.

  • Customizable Appearance: Configure bubble dimensions, transparency and visual settings.

  • Integrated Toolbar: Convenient controls for bubble visibility and sensitivity.

How to Interpret Volume Bubbles

1. Bubble Size

The size of each bubble represents the relative intensity of detected market activity.

  • Large bubble: Unusually high activity compared with the reference baseline.

  • Medium bubble: Moderate activity intensity.

  • Small bubble: Lower relative activity intensity.

A large bubble does not necessarily indicate a large amount of money or contracts traded.

2. Bubble Colors

Green bubbles represent activity associated with upward price movement.

Red bubbles represent activity associated with downward price movement.

The colors are directional estimates and do not directly measure aggressive institutional buying or selling.

3. Large Bubbles Near Support and Resistance

When a large bubble appears near an important price level, it indicates that market activity intensified in that area.

Traders can observe whether price subsequently rejects the level, breaks through it or consolidates around it.

4. Multiple Bubbles in the Same Area

A concentration of bubbles can highlight a region of repeated or sustained activity.

These areas may be useful for further analysis, but they do not automatically represent support, resistance or future reversal points.

5. Sensitivity Settings

Increasing sensitivity allows the indicator to display more activity episodes.

Reducing sensitivity helps focus on stronger activity events.

Practical Trading Example

Suppose XAUUSD approaches a previously identified resistance level.

A large red bubble appears near that level, indicating elevated market activity associated with downward price movement.

The trader can then analyze subsequent candles and market structure to determine whether the price is rejecting resistance or continuing through it.

The bubble itself is not a standalone sell signal.

Important Information

Arixis Volume Bubbles primarily analyzes tick activity on Forex and CFD instruments. Tick activity measures quotation updates and should not be confused with actual traded volume.

When the broker provides suitable trade-tick volume data, the indicator can use that information. Historical estimates may also be displayed when detailed tick data is unavailable.

The indicator does not measure order-book liquidity, identify institutional orders or guarantee future price movements.

Arixis Volume Bubbles is an analytical visualization tool designed to complement price action, technical analysis and market structure.
제작자의 제품 더 보기
Arixis Strategy Analyzer — Understand How Your Trading System Behaves Arixis Strategy Analyzer is a professional MetaTrader 5 analytics tool designed to transform raw trading history into a clear and structured behavioral profile of your trading system. Instead of simply showing profit, loss or basic account statistics, Arixis Strategy Analyzer studies how positions are actually opened, expanded and closed. It reconstructs trading campaigns and baskets from observable MT5 activity and analyzes
FREE
Arixis EA Comparator
Abel Masferrer Vinolas
Arixis EA Comparator — Compare Two Trading Systems Side by Side Arixis EA Comparator is a professional MetaTrader 5 analysis tool designed to compare the observable historical performance and trading behavior of two Expert Advisors or strategies on the same account. Using Magic Numbers, the application separates the activity of two systems and presents their statistics side by side under the same analytical framework. Compare number of trades and campaigns, net results, gross profit and loss, P
FREE
Arixis Trade Replay
Abel Masferrer Vinolas
Arixis Trade Replay — Reconstruct and Understand Your Historical Campaigns Arixis Trade Replay transforms historical MetaTrader 5 trading activity into an interactive visual reconstruction directly on the chart. Instead of examining hundreds of isolated deals in the account history, the application reconstructs observable trading campaigns and allows the trader to review the sequence in which positions were opened, expanded and eventually closed. During replay, entry and exit events can be disp
FREE
Arixis Backtest Inspector — Go Beyond the Final Profit Arixis Backtest Inspector is a professional MetaTrader 5 analysis tool designed to help traders understand the real structure behind historical trading results. Instead of focusing only on net profit, win rate or profit factor, it examines how results are distributed over time and how dependent a strategy may be on a small number of exceptional trades or trading days. The tool analyzes trade performance, winning and losing streaks, closed-e
FREE
Arixis Spread Monitor
Abel Masferrer Vinolas
Arixis Spread Monitor — Understand the Real Cost of Trading Arixis Spread Monitor is a lightweight real-time MetaTrader 5 utility designed to measure, record and analyze the spread of your trading instruments. Instead of showing only the current spread, it builds a historical profile that helps you understand how transaction costs change throughout the trading day. The system records Bid and Ask information and calculates spread statistics including current spread, mean, median, P75, P90, P95,
FREE
Arixis Grid Risk Calculator — Understand Grid Exposure Before Trading Arixis Grid Risk Calculator is a professional mathematical analysis tool for traders who use grid, recovery or progressive position-sizing systems. Configure the initial lot size, distance between entries, maximum number of levels and position-sizing progression to visualize how exposure evolves as additional positions are added. The calculator generates a detailed level-by-level representation including individual lot size,
FREE
Arixis Observer
Abel Masferrer Vinolas
ARIXIS OBSERVER — Real-Time Trading Intelligence for MetaTrader 5 Arixis Observer is a professional read-only trading analytics, risk monitoring and execution intelligence system for MetaTrader 5. Attach it to a single chart and monitor trading activity across your entire MT5 account, including multiple symbols, Expert Advisors, Magic Numbers and manual trades from one unified interface. Arixis Observer does not open, modify or close trades. It is designed exclusively for observation and analys
Arixis News Impact Analyzer
Abel Masferrer Vinolas
Arixis News Impact Analyzer is a professional economic news analysis tool for MetaTrader 5 designed to show not only what economic events are coming , but also how the market reacted to previous releases and how your own trading behaved around them . Instead of being just another economic calendar, Arixis News Impact Analyzer combines the native MetaTrader 5 Economic Calendar , historical price data and your local trading history in a single analytical dashboard. ECONOMIC CALENDAR View upcoming
English — Product description Analyze market structure, liquidity levels and price reactions with greater clarity. Arixis Market Structure & Liquidity is a MetaTrader 5 indicator designed to visualize confirmed market structure events and price-based liquidity concepts. Key features Buy-side and sell-side liquidity zones. Equal highs and equal lows. Liquidity sweep detection. Break of Structure (BOS). Change of Character (CHoCH). Fair Value Gaps (FVG). Higher-timeframe context. Configurable aler
FREE
Arixis Fixed Range Profile
Abel Masferrer Vinolas
English — Product description Explore how market activity is distributed across price levels within a selected range. Arixis Fixed Range Profile allows MetaTrader 5 users to select a specific chart region and visualize its horizontal activity distribution. The indicator calculates and displays a profile with key reference levels. Key features Interactive fixed-range selection. Horizontal activity histogram. Point of Control (POC). Value Area High (VAH) and Value Area Low (VAL). High Volume Nodes
FREE
필터:
리뷰 없음
리뷰 답변