ATR Stops Volatility Range Indicator
- Göstergeler
- Sürüm: 1.24

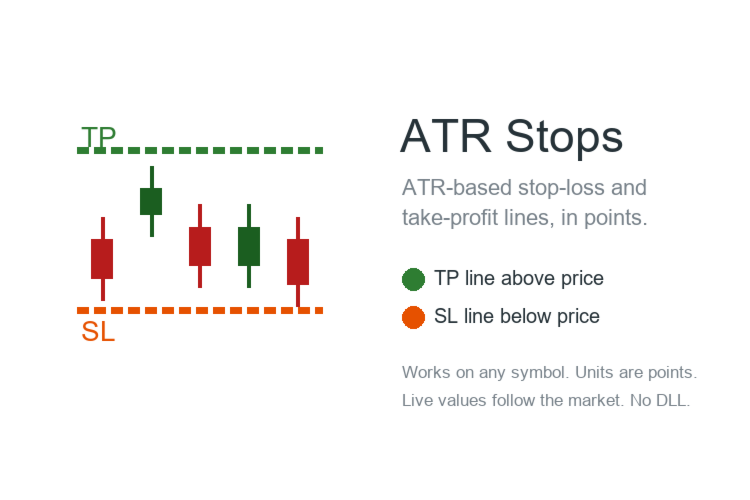
ATR Stops is an MT4 indicator that shows the size of market volatility. It helps you decide where to place your stop-loss and take-profit, so you avoid the loss from an oversized stop or the profit drawdown from an oversized target. A very practical indicator.
Main features
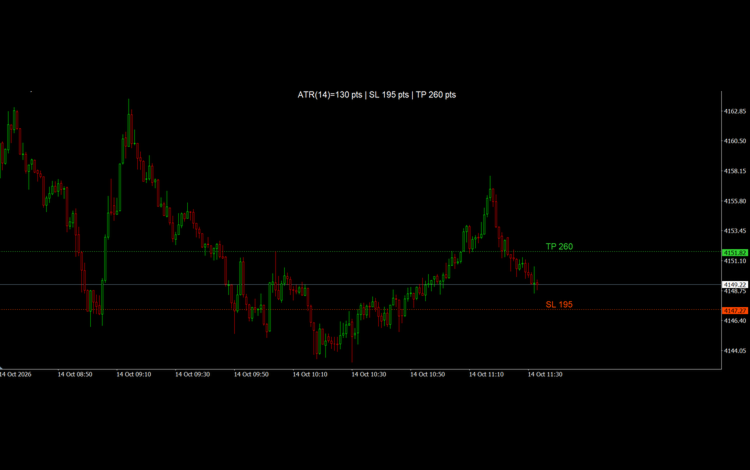
- A one-line data panel that tells you the size of the volatility
- A stop-loss reference line that helps you quickly place your stop
- A take-profit reference line that helps you quickly place your target
Parameters
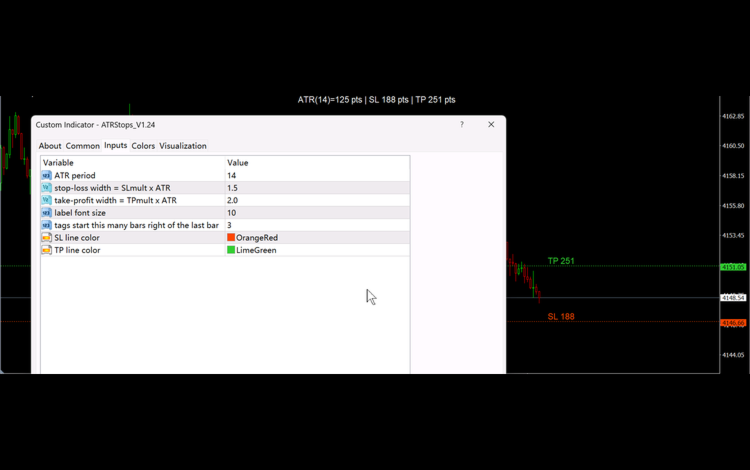
- ATRPeriod - ATR averaging period (default 14)
- SLmult - stop width = SLmult × ATR (default 1.5)
- TPmult - target width = TPmult × ATR (default 2.0)
- FontSize - label font size in points (default 10)
- TagOffsetBars - which bar to the right of the last candle the on-line label starts from (default 3)
- SLColor - SL line color (OrangeRed)
- TPColor - TP line color (LimeGreen)
How to use
Add the indicator to your chart and adjust the inputs in the parameters panel. If you already know your preferred ATR multiples, just set SLmult and TPmult. The on-line label shows the point distance in real time, and the corner label shows the same numbers at a glance. The SL and TP lines are reference levels for you to place your own stops and targets; the indicator does not open or close any trades.