Record Session High Trader
- Göstergeler
- Stephen Reynolds
- Sürüm: 1.2
- Güncellendi: 21 Temmuz 2017
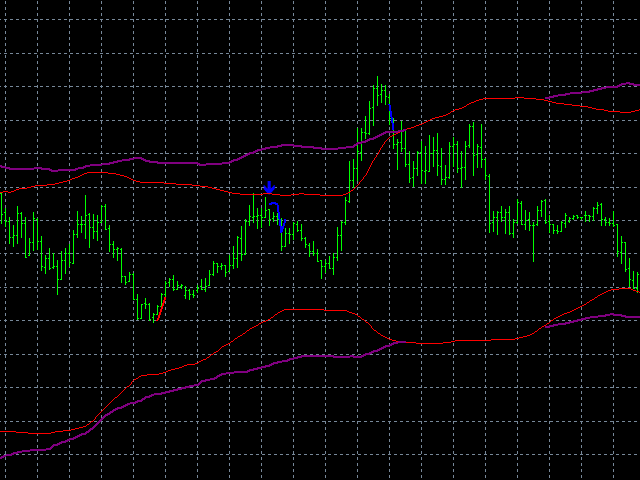
Record Session High Trader uses the concepts of within candlesticks trading to gauge when a trend might be wearing out and therefore ready for reversal or pause simply by looking at the candles. We call it a record session high when we get 8 or more previous candles that have higher closes. We call it a record session low when we get 8 or more previous candles that have lower closes.
We don't rely on the typical Oscillation Indicators for recognizing overbought or oversold but more we rely on looking at the actual price and using the higher high or lower low candles to count when a possible reversal or pause might occur. This is usually when we get to and past the 8th record session high. As far as i see this is a unique way of looking at price and its inevitable oscillation movement.
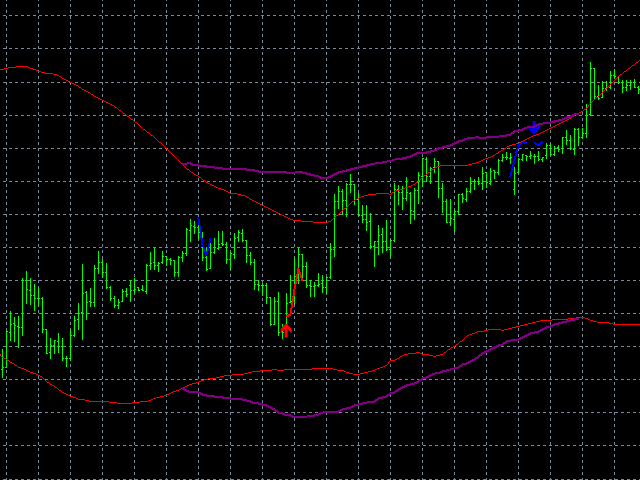
I have since updated this trading method by scraping the original MACD Histogram and instead I have added a few candlestick patterns so that if we get a record session high we only get a confirmed signal when we get a candlestick formation during a record session high. I've made it so that when we use this indicator we get lines and an alarm just to let us know an RSH is formed. I have then made it draw arrow and sound alarm when we get a candlestick signal. The candlestick signals i have chosen are known as either Bull Engulfing/Bear Piercing, Bull Morning Star/Bear Evening Star and Bull Hammer/Bear Shooting Star.
I've added the use of Bollinger and Keltner bands to help spot when the market in question is in an nonvolatile condition which therefore means reversals are more likely and therefore should improve the strike rate. These are set at the larger settings and are recommended. Smaller settings wont spot decent sized nonvolatile periods.
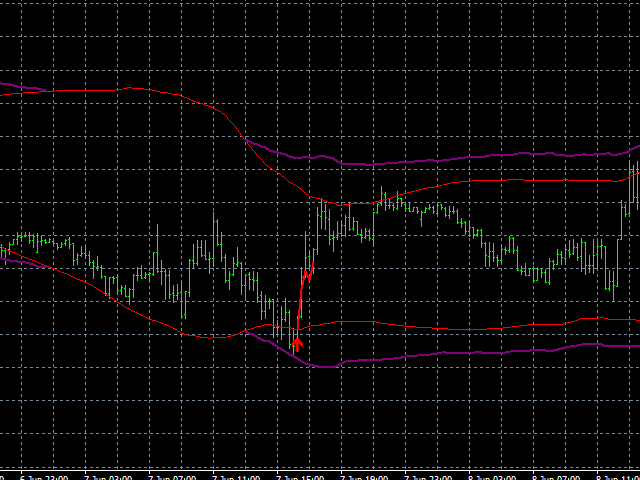
Also i have added a breakout signal as a reversal for if we get a false RSH Signal. This is based on the trading method that uses Bollinger and Keltner bands combined with a few more trend following methods to spot when market goes from nonvolatile to volatile. So if we get a breakout while we get an RSH it will alert the trader and swap directions in favor of breakout.
Features :
- A unique way of recognizing when a trend is wearing out and ready for either reversal or pause
- A way of gauging when market is in an nonvolatile or volatile state
- Choose when you want your record session high to start and when you want it to reset the count
- Choose your favorite arrow color.
- Send alerts to either your PC, eMail or mobile device
- Works on any time frame
Settings :
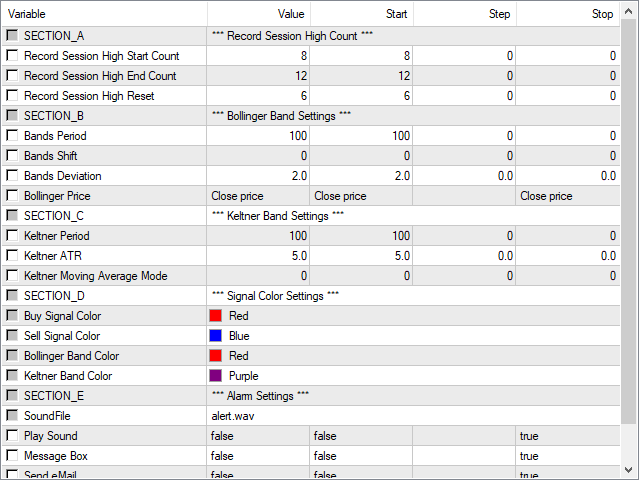
Record Session High Count
- Record Session High Start Count - Here we set when we want the record session high count to start. Recommended settings are between 8th and 10th record session high.
- Record Session High End Count - Here we set when we want the record session high count to end. Recommended settings are between 11th and 12th record session high.
- Record Session High Count Reset - Here we set when we want the record session high count to be reset back to 1 for a new count.
Bollinger Band Settings
- Bands Period - Sets the period of the moving average our Bollinger band is based on. Recommended at 100 SMA this is x5 larger than normal setting.
- Bands Shift - Sets the bar from which we calculate our Bollinger Band. EG 0 = current bar, 1 = previous bar
- Bands Deviation - Sets the deviation calculation for price deviating from average.
- Bollinger Price - Sets the price to which our calculation is based.
Keltner Band Settings
- Keltner Period - Sets the Period of the moving average our Keltner Channel is based on.
- Keltner ATR - Sets the Average True Range.
- Keltner Moving Average Mode - Sets the type of moving average we use. EG 0 = Simple, 1 = Exponential, 2 = Smoothed and 3 = Linear Weighted


Great work