• Genel bakış
  • İncelemeler (1)
  • Yorumlar (2)
  • Yenilikler

Seconds Bars

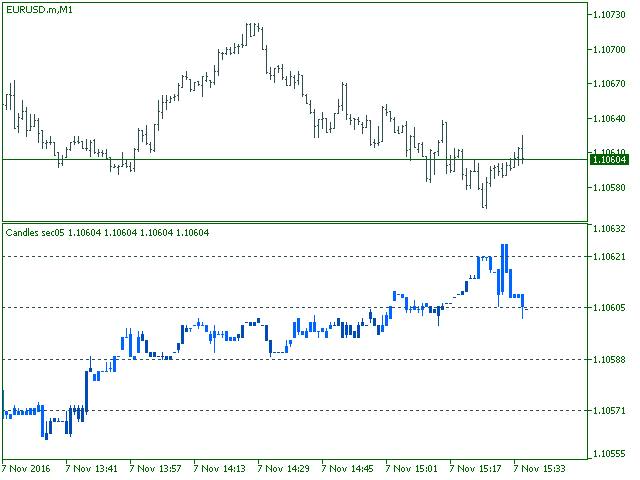
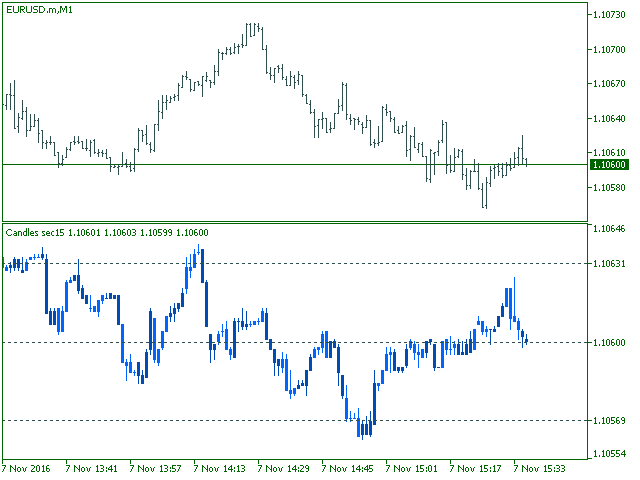
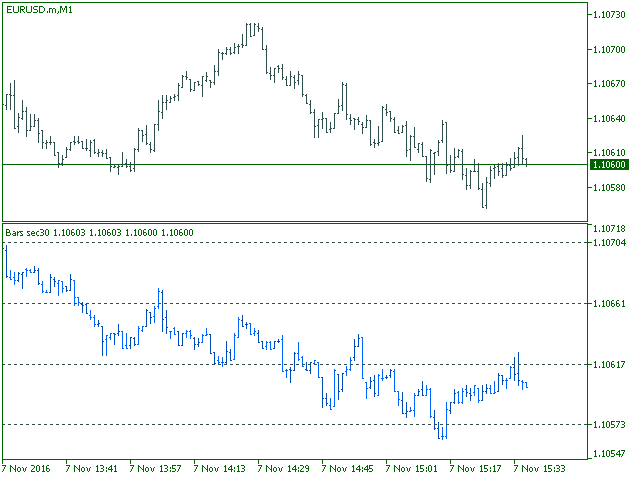
The indicator displays in a separate window a price chart as bars or Japanese candlesticks with a periodicity below a minute.

Available periods (seconds): 30, 20, 15, 12, 10, 6, 5, 4, 3, 2, 1.

The display mode (bars or candlesticks) is switched by clicking on the chart.


Parameters

  • Period in seconds - the period of bars in seconds
  • Price levels count - the number of price levels on a chart

Buffer number: 0 - Open, 1 - High, 2 - Low, 3 - Close, 4 - Color.

Önerilen ürünler
Noize Absorption Index - is the manual trading system that measures the difference of pressure between bears forces and bulls forces. Green line - is a noize free index that showing curent situation. Zero value of index shows totally choppy/flat market.Values above zero level shows how powerfull bullish wave is and values below zero measures bearish forces.Up arrow appears on bearish market when it's ready to reverse, dn arrow appears on weak bullish market, as a result of reverse expectation.
US30NinjaMT5
Satyaseelan Shankarananda Moodley
US30 Ninja is a 5 minute scalping indicator that will let know you when there is a trade set up (buy or sell). Once the indicator gives the trade direction, you can open a trade and use a 30 pip stop loss and a 30 pip to 50 pip take profit. Please trade at own own risk. This indicator has been created solely for the US30 market and may not yield positive results on any other pair. 
Owl Smart Levels MT5
Sergey Ermolov
4.38 (37)
MT4 versiyonu  |  FAQ Owl Smart Levels Indicator , Bill Williams'ın gelişmiş fraktalları , piyasanın doğru dalga yapısını oluşturan Valable ZigZag ve kesin giriş seviyelerini gösteren Fibonacci seviyeleri gibi popüler piyasa analiz araçlarını içeren tek gösterge içinde eksiksiz bir ticaret sistemidir. pazara ve kar elde edilecek yerlere. Stratejinin ayrıntılı açıklaması Gösterge ile çalışma talimatı Baykuş Yardımcısı ticaretinde Danışman Yardımcısı Kullanıcıların özel sohbeti -> Satın aldıktan
Mine Farm
Maryna Kauzova
5 (1)
Mine Farm is one of the most classic and time-tested scalping strategies based on the breakdown of strong price levels. Mine Farm is the author's modification of the system for determining entry and exit points into the market... Mine Farm - is the combination of great potential with reliability and safety. Why Mine Farm?! - each order has a short dynamic Stop Loss - the advisor does not use any risky methods (averaging, martingale, grid, locking, etc.) - the advisor tries to get
Was: $249  Now: $99   Market Profile defines a number of day types that can help the trader to determine market behaviour. A key feature is the Value Area, representing the range of price action where 70% of trading took place. Understanding the Value Area can give traders valuable insight into market direction and establish the higher odds trade. It is an excellent addition to any system you may be using. Inspired by Jim Dalton’s book “Mind Over Markets”, this indicator is designed to suit the
Volality Index Scalper
Lesedi Oliver Seilane
5 (1)
Volality Index scalper indicator  Meant for Volality pairs such as Volality 10, 25, 50, 75 and 100 The indicator works on all timeframes from the 1 minute to the monthly timeframe the indicator is non repaint the indicator has 3 entry settings 1 color change on zero cross 2 color change on slope change 3 color change on signal line cross Orange line is your sell signal Blue line is your buy signal.
Premium seviye, %80'den fazla doğru tahmin doğruluğuna sahip benzersiz bir göstergedir! Bu gösterge en iyi Ticaret Uzmanları tarafından iki aydan uzun süredir test edilmiştir! Yazarın göstergesini başka hiçbir yerde bulamazsınız! Ekran görüntülerinden bu aracın doğruluğunu kendiniz görebilirsiniz! 1, sona erme süresi 1 mum olan ikili opsiyon ticareti için harikadır. 2 tüm döviz çiftleri, hisse senetleri, emtialar, kripto para birimleri üzerinde çalışır Talimatlar: Kırmızı ok görün
HMA Trend Professional MT5
Pavel Zamoshnikov
4.4 (5)
Improved version of the free HMA Trend indicator (for MetaTrader 4) with statistical analysis. HMA Trend is a trend indicator based on the Hull Moving Average (HMA) with two periods. HMA with a slow period identifies the trend, while HMA with a fast period determines the short-term movements and signals in the trend direction. The main differences from the free version: Ability to predict the probability of a trend reversal using analysis of history data. Plotting statistical charts for analyz
Your Trend Friend
Luigi Nunes Labigalini
5 (1)
The trend is your friend! Look at the color of the indicator and trade on that direction. It does not  repaint. After each candle is closed, that's the color of the trend. You can focus on shorter faster trends or major trends, just test what's most suitable for the symbol and timeframe you trade. Simply change the "Length" parameter and the indicator will automatically adapt. You can also change the color, thickness and style of the lines. Download and give it a try! There are big movements
To get access to MT4 version please click here . - This is the exact conversion from TradingView: "Stochastic Momentum Index" By "UCSgears". - This is a popular version of stochastic oscillator on tradingview. - This is a light-load processing and non-repaint indicator. - Buffers are available for the lines on chart. - You can message in private chat for further changes you need. Thanks for downloading
The best time to trade Using this Indicator is when the time reach exactly hour,half,45 minutes,15 minutes and sometimes 5 minutes.. This indicators is helpful to those who trade boom and crash indecies.How to read this indicator first you'll see Blue allow and Red allow all these allows used to indicate or to detect the spike which will happen so the allow happens soon before the spike happen.This indicator works properly only in boom and crash trading thing which you have to consider when
Welcome to the Ultimate Harmonic Patterns recognition indicator that is focused to detect advanced patterns. The Gartley pattern, Bat pattern, and Cypher pattern  are popular technical analysis tools used by traders to identify potential reversal points in the market. Our Ultimate Harmonic Patterns recognition Indicator is a powerful tool that uses advanced algorithms to scan the markets and identify these patterns in real-time. With our Ultimate Harmonic Patterns recognition Indicator, you
Basic Support and Resistance   Göstergimiz, teknik analizinizi artırmak için ihtiyacınız olan çözümdür.Bu gösterge, destek ve direnç seviyelerini grafikte yansıtmanıza olanak tanır/ MT4 sürümü Özellikler Fibonacci seviyelerinin entegrasyonu: Fibonacci seviyelerini destek ve direnç seviyelerinin yanı sıra görüntüleme seçeneğiyle, göstergemiz size piyasa davranışı ve olası tersine dönme alanları hakkında daha derin bir fikir verir. Performans Optimizasyonu: Genişletilmiş satırları yalnızca he
Trading Utility for Forex Currency Pairs Only not for Gold  Functions Auto Lot Calculation based on Risk Auto stoploss  Auto TakeProfit Breakeven Auto Close Half % Close in percentage with respect to the PIPs Pending Orders BuyLimit Sell Limit with distances BuyStop Sell Stop    with distances Trading Informations Risk in percentage For Multiple trades Combine Takeprofit and Combine Stoplosses
Indicator and Expert Adviser  EA Available in the comments section of this product. Download with Indicator must have indicator installed for EA to work. Mt5 indicator alerts for bollinger band and envelope extremes occurring at the same time. Buy signal alerts occur when A bullish candle has formed below both the lower bollinger band and the lower envelope  Bar must open and close below both these indicators. Sell signal occur when A bear bar is formed above the upper bollinger band and upp
Sayı dizilerinden birine "Orman Yangını Dizisi" denir. En güzel yeni dizilerden biri olarak kabul edildi. Başlıca özelliği, bu dizinin lineer trendlerden, hatta en kısa olanlardan kaçınmasıdır. Bu göstergenin temelini oluşturan bu özelliktir. Bir finansal zaman serisini analiz ederken, bu gösterge tüm olası trend seçeneklerini reddetmeye çalışır. Ve ancak başarısız olursa, bir trendin varlığını tanır ve uygun sinyali verir. Bu yaklaşım, yeni trendlerin başladığı anların doğru bir şekilde belirl
An indicator of pattern #31 ("Long Island") from Encyclopedia of Chart Patterns by Thomas N. Bulkowski. The second gap is in the opposite direction. Parameters: Alerts - show alert when an arrow appears   Push - send a push notification when an arrow appears (requires configuration in the terminal) GapSize - minimum gap size in points ArrowType - a symbol from 1 to 17 ArrowVShift - vertical shift of arrows in points   ShowLevels - show levels ColUp - color of an upward line ColDn - color of a
Super Trend Trading View 5
Mohammad Taher Halimi Tabrizi
The SuperTrend indicator is a popular technical analysis tool used by traders and investors to identify trends in the price of a financial instrument, such as a stock, currency pair, or commodity. It is primarily used in chart analysis to help traders make decisions about entering or exiting positions in the market. this version of super trend indicator is exactly converted from trading view to be used in MT5
This indicator allows you to enjoy the two most popular products for analyzing request volumes and market deals at a favorable price: Actual Depth of Market Chart Actual Tick Footprint Volume Chart This product combines the power of both indicators and is provided as a single file. The functionality of Actual COMBO Depth of Market AND Tick Volume Chart is fully identical to the original indicators. You will enjoy the power of these two products combined into the single super-indicator! Below is
To get access to MT4 version please click here . This is the exact conversion from TradingView: "[SHK] Schaff Trend Cycle (STC)" by "shayankm". This is a light-load processing indicator. This is a non-repaint indicator. Buffers are available for processing in EAs. All input fields are available. You can message in private chat for further changes you need. Thanks for downloading
Bu, fiyat etiketleriyle (devre dışı bırakılabilir)   Gelişmiş ZigZag Dinamik   ve/veya   Genişletilmiş Fraktallar   göstergesi ekstremumlarına dayalı destek ve direnç seviyelerinin bir MTF göstergesidir. MTF modu için daha yüksek TF'ler seçilebilir. Varsayılan olarak, seviyeler ZigZag gösterge noktalarına göre oluşturulur. Fraktal gösterge noktaları da ZigZag ile birlikte veya onun yerine kullanılabilir. Kullanımı basitleştirmek ve CPU zamanından tasarruf etmek için, açılışta her çubuk için bir
Laguerre SuperTrend Clouds   adds an Adaptive Laguerre averaging algorithm and alerts to the widely popular SuperTrend indicator. As the name suggests,   Laguerre SuperTrend Clouds (LSC)   is a trending indicator which works best in trendy (not choppy) markets. The SuperTrend is an extremely popular indicator for intraday and daily trading, and can be used on any timeframe. Incorporating Laguerre's equation to this can facilitate more robust trend detection and smoother filters. The LSC uses the
Scanner
Ervand Oganesyan
Çok zaman çerçeveli ve çok simgeli pazar tarayıcısı. Gösterge, seçilen teknik stratejiyi seçtiğiniz tüm araçlarda ve zaman dilimlerinde test edecek ve tarama sonuçlarını saniyeden çok daha kısa bir sürede görüntüleyecektir. Kullanım örneği Göstergeyi başlatın, işlem süresini ve işlem mantıklarını ayarlayın. Tarama sonuçlarının çoğu cihazda karlı olduğundan emin olun, ardından tek fare tıklamasıyla istediğiniz grafiğe geçin. Ticaret sinyalleri hazır. Sinyallerin frekansının size uygun olduğunda
Öncelikle, bu Ticaret Aracının Non-Repainting, Non-Redrawing ve Non-Lagging Gösterge olduğunu vurgulamakta fayda var, bu da onu profesyonel ticaret için ideal hale getiriyor. Çevrimiçi kurs, kullanıcı kılavuzu ve demo. Akıllı Fiyat Hareketi Kavramları Göstergesi, hem yeni hem de deneyimli tüccarlar için çok güçlü bir araçtır. İleri ticaret fikirlerini, Inner Circle Trader Analizi ve Smart Money Concepts Ticaret Stratejileri gibi 20'den fazla kullanışlı göstergeyi bir araya getirerek bir aray
Grafikteki işlem seanslarını vurgular Trading_Sessions_Indicator_Free ürününün ücretli bir sürümü, oturumların başlangıcını /sonunu özel olarak özelleştirebilme özelliğine sahiptir. İşlem Seansları Göstergesi, her işlem seansının başlangıç ve bitişlerini vurgular. [SEÇENEK:] Asian session Open Asian session Close Asian session OpenSummertime Asian session CloseSummertime European session Open European session Close European session Open European session Close Timeshift En iyi sonuçlar i
Gann Kutusu (veya Gann Meydanı), W.D. Gann'ın "Piyasa tahminleri için matematiksel formül" makalesine dayanan bir pazar analiz yöntemidir. Bu gösterge üç Kare modelini çizebilir: 90, 52(104), 144. Altı ızgara çeşidi ve iki yay çeşidi vardır. Bir grafik üzerinde aynı anda birden fazla kare çizebilirsiniz. Parametreler Square — kare modelin seçimi : 90 — 90'ın karesi (veya dokuzun karesi); 52 (104) — 52'nin karesi (veya 104); 144 — 144'ün evrensel karesi; 144 (full) — karenin "tam" versiyonu
Gösterge, olası minimum gecikme ile   yeniden boyama yapmadan   grafikte harmonik desenleri gösterir. Gösterge üstleri arayışı, fiyat analizinin dalga ilkesine dayanmaktadır. Gelişmiş ayarlar, ticaret tarzınız için parametreler seçmenize olanak tanır. Bir mumun (çubuk) açılışında, yeni bir model oluşturulduğunda, fiyat hareketinin olası yönünün değişmeyen bir oku sabitlenir. Gösterge aşağıdaki kalıpları ve çeşitlerini tanır: ABCD, Gartley (Butterfly, Crab, Bat), 3Drives, 5-0, Batman, SHS, One2On
This indicator obeys the popular maxim that: "THE TREND IS YOUR FRIEND" It paints a Blue line for BUY and also paints a RED line for SELL. (you can change the colors). It gives alarms and alerts of all kinds. IT DOES NOT REPAINT COLOR and can be used for all currency pairs and timeframes. Yes, as easy and simple as that. Even a newbie can use it to make great and reliable trades. https://www.mql5.com/en/market/product/115553
Gösterge, tarihsel olanlarla karşılaştırılabilecek güncel teklifler oluşturur ve bu temelde bir fiyat hareketi tahmini yapar. Gösterge, istenen tarihe hızlı navigasyon için bir metin alanına sahiptir. Seçenekler: Sembol - göstergenin göstereceği sembolün seçimi; SymbolPeriod - göstergenin veri alacağı dönemin seçimi; GöstergeRenk - gösterge rengi; Ters - doğru tırnakları tersine çevirir, yanlış - orijinal görünüm; Sonraki, tarihi girebileceğiniz ve 'enter' tuşuna basa
Renko Gold
Ignacio Agustin Mene Franco
Renko Gold! clearly indicates the floors and ceilings where it goes from 4 lines, the line below that marks the floor in green confirming with the thinnest line clarifies the purchase entry, the same is for sale, the top line marks the ceiling and the thinnest red line marks the sale, This indicator works for all temporalities! For Forex and Synthetic Indices markets! It also works for crypto markets! Good profit! World Investor.
Bu ürünün alıcıları ayrıca şunları da satın alıyor
Öncelikle belirtmek gerekir ki bu Ticaret Göstergesi Yeniden Çizim Yapmaz, Gecikmez ve Gecikme Göstermez, bu da hem manuel hem de robot ticareti için ideal hale getirir. Kullanıcı kılavuzu: ayarlar, girişler ve strateji. Atom Analisti, Piyasada Daha İyi Bir Avantaj Bulmak İçin Fiyatın Gücünü ve Momentumunu Kullanan PA Fiyat Hareketi Göstergesidir. Gürültüleri ve Yanlış Sinyalleri Kaldırmaya ve Ticaret Potansiyelini Artırmaya Yardımcı Olan Gelişmiş Filtrelerle Donatılmıştır. Birden fazla katmanl
Öncelikle, bu Ticaret Sistemi'nin Non-Repainting, Non-Redrawing ve Non-Lagging Göstergesi olduğunu vurgulamak önemlidir, bu da hem manuel hem de robot ticareti için ideal hale getirir. Online kurs, kılavuz ve ön ayarları indir. "Smart Trend Trading System MT5", yeni ve deneyimli tüccarlar için özelleştirilmiş kapsamlı bir ticaret çözümüdür. 10'dan fazla premium göstergeyi birleştiriyor ve 7'den fazla sağlam ticaret stratejisi sunuyor, bu da çeşitli piyasa koşulları için esnek bir seçim yapar. Tr
Quantum Trend Sniper
Bogdan Ion Puscasu
5 (42)
Tanıtım       Kuantum Trend Keskin Nişancı Göstergesi   , trend tersine dönmeleri belirleme ve ticaret yapma şeklinizi değiştiren çığır açan MQL5 Göstergesi! 13 yılı aşkın ticaret tecrübesine sahip deneyimli tüccarlardan oluşan bir ekip tarafından geliştirilmiştir.       Kuantum Trend Keskin Nişancı Göstergesi       trend dönüşlerini son derece yüksek doğrulukla belirlemenin yenilikçi yolu ile ticaret yolculuğunuzu yeni zirvelere taşımak için tasarlanmıştır. ***Kuantum Trend Keskin Nişancı Gö
Reversal First Impulse levels (RFI)      INSTRUCTIONS        RUS       -       ENG              R ecommended to use with an indicator   -   TREND PRO -  Version MT4                 A key element in trading is zones or levels from which decisions to buy or sell a trading instrument are made. Despite attempts by major players to conceal their presence in the market, they inevitably leave traces. Our task was to learn how to identify these traces and interpret them correctly. Main functions:: Di
Trend Screener Pro MT5
STE S.S.COMPANY
4.88 (64)
Trend Göstergesi, Trend Alım Satım ve Filtreleme için Çığır Açan Benzersiz Çözüm, Tüm Önemli Trend Özellikleriyle Tek Bir Araç İçinde Yerleştirildi! Forex, emtialar, kripto para birimleri, endeksler ve hisse senetleri gibi tüm sembollerde/araçlarda kullanılabilen %100 yeniden boyamayan çoklu zaman çerçevesi ve Çoklu para birimi göstergesidir. Trend Screener, grafikte noktalarla ok trend sinyalleri sağlayan etkili bir trend trend göstergesidir. Trend analizörü göstergesinde bulunan özellikler: 1.
Gold Stuff mt5
Vasiliy Strukov
4.89 (175)
Gold Stuff mt5, özellikle altın için tasarlanmış bir trend göstergesidir ve herhangi bir finansal enstrümanda da kullanılabilir. Gösterge yeniden çizilmez ve gecikmez. Önerilen zaman dilimi H1. Ayarları ve kişisel bir bonusu almak için satın alma işleminden hemen sonra benimle iletişime geçin!  Güçlü Destek ve Trend Tarayıcı göstergemizin ücretsiz bir kopyasını pm'den alabilirsiniz. Ben!   AYARLAR Ok Çiz - açık kapalı. grafik üzerinde oklar çizmek. Uyarılar - sesli uyarılar kapalı. E-post
FxaccurateLS
Shiv Raj Kumawat
WHY IS OUR FXACCCURATE LS MT5 THE PROFITABLE ? PROTECT YOUR CAPITAL WITH RISK MANAGEMENT Gives entry, stop and target levels from time to time. It finds Trading opportunities by analyzing what the price is doing during established trends. POWERFUL INDICATOR FOR A RELIABLE STRATEGIES We have made these indicators with a lot of years of hard work. It is made at a very advanced level. Established trends provide dozens of trading opportunities, but most trend indicators completely ignore them!
FX Power MT5 NG
Daniel Stein
5 (5)
Sabah Brifingimiz burada mql5 ve on Telegram! FX Power MT5 NG , uzun zamandır çok popüler olan döviz gücü ölçerimiz FX Power'ın yeni neslidir. Peki bu yeni nesil güç ölçer ne sunuyor? Orijinal FX Power hakkında sevdiğiniz her şey PLUS GOLD/XAU güç analizi Daha da hassas hesaplama sonuçları Ayrı ayrı yapılandırılabilir analiz dönemleri Daha da iyi performans için özelleştirilebilir hesaplama limiti Özel çokluDaha fazlasını görmek isteyenler için örnek ayarlar Her grafikte en sevdiğiniz renkler i
ICT, SMC, SMART MONEY CONCEPTS, SMART MONEY, Smart Money Concept, Support and Resistance, Trend Analysis, Price Action, Market Structure, Order Blocks, BOS/CHoCH,   Breaker Blocks ,  Momentum Shift,   Supply&Demand Zone/Order Blocks , Strong Imbalance,   HH/LL/HL/LH,    Fair Value Gap, FVG,  Premium  &   Discount   Zones, Fibonacci Retracement, OTE, Buy Side Liquidity, Sell Side Liquidity, BSL/SSL Taken, Equal Highs & Lows, MTF Dashboard, Multiple Time Frame, BigBar, HTF OB, HTF Market Structure
IVISTscalp5
Vadym Zhukovskyi
5 (5)
We present you the iVISTscalp5 indicator, which is not only unique, but also effective in the analysis of trading operations. This indicator is based on time data and is the result of many years of experience and deep analysis of financial markets. The iVISTscalp5 indicator is an excellent assistant for manual trading. Convenience, simplicity and visualization. All the most difficult is hidden inside. We have simplified the settings and use of the iVISTscalp5 indicator as much as possible. The i
Top indicator for MT5   providing accurate signals to enter a trade without repainting! It can be applied to any financial assets:   forex, cryptocurrencies, metals, stocks, indices .  Watch  the video  (6:22) with an example of processing only one signal that paid off the indicator! MT4 version is here It will provide pretty accurate trading signals and tell you when it's best to open a trade and close it. Most traders improve their trading results during the first trading week with the help of
TPSproTREND PrO MT5
Roman Podpora
4.86 (7)
TPSpro TRENDPRO  - is a trend indicator that automatically analyzes the market and provides information about the trend and each of its changes, as well as giving signals for entering trades without redrawing! The indicator uses each candle, analyzing them separately. referring to different impulses - up or down impulse. Exact entry points into transactions for currencies, crypto, metals, stocks, indices!  -  Version MT4               DETAILED DESCRIPTION               R ecommended to use with
Fiyat tersine döndükçe ve geri çekildikçe piyasa yapısından elde edilen kâr değişir. Piyasa yapısını tersine çevirme uyarısı göstergesi, bir trendin veya fiyat hareketinin ne zaman tükenmeye yaklaştığını ve tersine dönmeye hazır olduğunu tanımlar. Genellikle bir geri dönüş veya büyük bir geri çekilme meydana gelmek üzereyken meydana gelen piyasa yapısındaki değişiklikler konusunda sizi uyarır. Gösterge, olası bir tükenme noktasının yakınında her yeni yüksek veya düşük oluştuğunda, başlangıçta
Introducing the South African Sniper indicator created by a small group of traders with a few years trading trading the financial market profitably . This is a plug and play indicator that provides you with  BUY and SELL (SNIPER ENTRY) signals with TARGET and trail stops. The indicator Works with all MT5 trading instruments. The indicator uses previous  chart data as receipt to speculate on future market moves.  "The South African Sniper indicator community are very happy with the indicator an
The Volume by Price Indicator for MetaTrader 5 features Volume Profile and Market Profile TPO (Time Price Opportunity). Volume and TPO histogram bar and line charts. Volume Footprint charts. TPO letter and block marker collapsed and split structure charts. Session filtering and grouping. Static, dynamic and flexible range segmentation and compositing methods with relative and absolute visualizations. Graphical layering, positioning and styling options to suit the user's analytic and aesthetic n
FX Volume MT5
Daniel Stein
4.94 (17)
Sabah Brifingimiz aracılığıyla ayrıntılar ve ekran görüntüleri ile günlük piyasa güncellemenizi alın burada mql5 ve on Telegram ! FX Volume, bir brokerin bakış açısından piyasa duyarlılığı hakkında GERÇEK bir fikir veren İLK ve TEK hacim göstergesidir. COT raporlarından çok daha hızlı bir şekilde, brokerlar gibi kurumsal piyasa katılımcılarının Forex piyasasında nasıl konumlandıklarına dair harika bilgiler sağlar. Bu bilgileri doğrudan grafiğinizde görmek, ticaretiniz için gerçek oyun değiştir
Introducing the Power Trade Plus indicator designed by a small group of traders with a few years of experience trading the market profitably.  The Power Trade Plus is derived from the Power Trade indicator,  the indicator strive in powerful sniper entries and take profit levels,  with an algorithm that's can determine the markets volatility and Provides entries based on the current market volatility. This indicator is much more effective in stock ,currencies and indices.
Advanced Supply Demand MT5
Bernhard Schweigert
4.53 (15)
Herhangi bir Acemi veya Uzman Tüccar için En İyi Çözüm! Bu gösterge benzersiz, yüksek kaliteli ve uygun fiyatlı bir ticaret aracıdır çünkü bir dizi tescilli özelliği ve yeni bir formülü bir araya getirdik. Bu güncelleme ile çift zaman dilimi dilimlerini gösterebileceksiniz. Yalnızca daha yüksek bir TF gösteremeyeceksiniz, aynı zamanda TF grafiğini ve ARTIK daha yüksek TF'yi de gösterebileceksiniz: YUVARLAK BÖLGELERİ GÖSTERMEK. Tüm Arz Talebi tüccarları buna bayılacak. :) Önemli Bilgiler Açıkland
Bill Williams Advanced
Siarhei Vashchylka
5 (5)
Bill Williams Advanced is designed for automatic chart analysis using Bill Williams' "Profitunity" system. The indicator analyzes four timeframes at once. Manual (Be sure to read before purchasing) Advantages 1. Automatically analyzes the chart using the "Profitunity" system of Bill Williams. The found signals are placed in a table in the corner of the screen. 2. Equipped with a trend filter based on the Alligator indicator. Most of the system signals are recommended to be used only accordi
Quantum Heiken Ashi PRO MT5
Bogdan Ion Puscasu
4.5 (8)
Quantum Heiken Ashi PRO ile   tanışın Pazar eğilimleri hakkında net bilgiler sağlamak üzere tasarlanan Heiken Ashi mumları, gürültüyü filtreleme ve yanlış sinyalleri ortadan kaldırma yetenekleriyle ünlüdür. Kafa karıştırıcı fiyat dalgalanmalarına veda edin ve daha sorunsuz, daha güvenilir bir grafik sunumuna merhaba deyin. Quantum Heiken Ashi PRO'yu gerçekten benzersiz kılan şey, geleneksel şamdan verilerini okunması kolay renkli çubuklara dönüştüren yenilikçi formülüdür. Kırmızı ve yeşil çubukl
Tanıtım       Quantum Breakout PRO   , Breakout Bölgeleri ile ticaret yapma şeklinizi değiştiren çığır açan MQL5 Göstergesi! 13 yılı aşkın ticaret tecrübesine sahip deneyimli tüccarlardan oluşan bir ekip tarafından geliştirilmiştir.       Kuantum Breakout PRO       yenilikçi ve dinamik koparma bölgesi stratejisiyle ticaret yolculuğunuzu yeni zirvelere taşımak için tasarlanmıştır. Kuantum Breakout Göstergesi, size 5 kar hedefi bölgesi ile kırılma bölgelerinde sinyal okları ve kırılma kutusuna
AW Trend Predictor MT5
AW Trading Software Limited
4.78 (58)
Tek bir sistemde trend ve kırılma seviyelerinin kombinasyonu. Gelişmiş bir gösterge algoritması piyasa gürültüsünü filtreler, trendi, giriş noktalarını ve olası çıkış seviyelerini belirler. Gösterge sinyalleri, sinyal geçmişinin etkinliğini gösteren en uygun enstrümanların seçilmesine izin veren bir istatistiksel modüle kaydedilir. Gösterge Kâr Al ve Zararı Durdur işaretlerini hesaplar. Kılavuz ve talimatlar ->   BURAYA   / MT4 versiyonu ->   BURAYA Gösterge ile nasıl ticaret yapılır: Trend Pre
ADR Ters Çevirme Göstergesi, normal ortalama günlük aralığına göre fiyatın şu anda nerede işlem gördüğünü bir bakışta size gösterir. Fiyat, ortalama aralığı ve seçtiğiniz seviyenin üzerindeki seviyeleri aştığında, açılır pencere, e-posta veya push yoluyla anında uyarılar alacaksınız, böylece hızlı bir şekilde geri çekilmelere ve geri dönüşlere atlayabilirsiniz. Gösterge, grafikte ortalama günlük aralık uç noktalarında yatay çizgiler ve ayrıca fiyatları aşan matematiksel olasılıkları olan seviye
RelicusRoad Pro MT5
Relicus LLC
4.83 (23)
Şimdi 147 $ (birkaç güncellemeden sonra 499 $ 'a yükseliyor) - Sınırsız Hesaplar (PC'ler veya Mac'ler) RelicusRoad Kullanım Kılavuzu + Eğitim Videoları + Özel Discord Grubuna Erişim + VIP Durumu PİYASAYA BAKMAK İÇİN YENİ BİR YOL RelicusRoad, forex, vadeli işlemler, kripto para birimleri, hisse senetleri ve endeksler için dünyanın en güçlü ticaret göstergesidir ve yatırımcılara kârlı kalmaları için ihtiyaç duydukları tüm bilgileri ve araçları sağlar. Başlangıç ​​seviyesinden ileri seviyey
** All Symbols x All Timeframes scan just by pressing scanner button ** ***Contact me after purchase to send you instructions and add you in "123 scanner group" for sharing or seeing experiences with other users. After 17 years of experience in the markets and programming, Winner indicator is ready. I would like to share with you! Introduction The 123 Pattern Scanner indicator with a special enhanced algorithm is a very repetitive common pattern finder with a high success rate . Interestingly,
Bu gösterge paneli, seçilen semboller için mevcut en son   harmonik kalıpları   gösterir, böylece zamandan tasarruf edersiniz ve daha verimli olursunuz /   MT4 sürümü . Ücretsiz Gösterge:   Basic Harmonic Pattern Gösterge sütunları Symbol :   seçilen semboller görünecektir Trend:   yükseliş veya düşüş Pattern :   desen türü (gartley, kelebek, yarasa, yengeç, köpekbalığı, cypher veya ABCD) Entry :   giriş fiyatı SL:   zararı durdur fiyatı TP1:   1. kar alma fiyatı TP2:   2. kar alma fiyatı
MetaBands M5
Vahidreza Heidar Gholami
4.67 (3)
MetaBands uses powerful and unique algorithms to draw channels and detect trends so that it can provide traders with potential points for entering and exiting trades. It’s a channel indicator plus a powerful trend indicator. It includes different types of channels which can be merged to create new channels simply by using the input parameters. MetaBands uses all types of alerts to notify users about market events. Features Supports most of the channel algorithms Powerful trend detection algorith
Blahtech Supply Demand MT5
Blahtech Limited
4.57 (14)
Was: $299  Now: $99   Supply Demand uses previous price action to identify potential imbalances between buyers and sellers. The key is to identify the better odds zones, not just the untouched ones. Blahtech Supply Demand indicator delivers functionality previously unavailable on any trading platform. This 4-in-1 indicator not only highlights the higher probability zones using a multi-criteria strength engine, but also combines it with multi-timeframe trend analysis, previously confirmed swings
XQ Indicator MetaTrader 5
Marzena Maria Szmit
5 (1)
Step into the realm of Forex trading with confidence and precision using XQ, a cutting-edge Forex indicator designed to elevate your trading game to unprecedented heights. Whether you're a seasoned trader or just stepping into the world of currency exchange, XQ Forex Indicator empowers you with the insights and signals needed to make informed trading decisions. The signal conditions are a combination of three indicators, and XQ Forex Indicator only display  medium and long-term trends . The ind
Malaysian SNR Levels
Matthias Horst Pieroth
This indicator can be used to display Support and Resistance levels according to  the  Malaysian SNR concept , in which Support and Resistance are exact levels of a line chart. Malaysian SNR There are 3 different horizontal levels in Malaysian SNR: A-Level : This level is located at the peak of this line chart. (shape looks like the letter A) V-Level : Level at the valley of a line chart, (shape looks like the letter V) Gap-Leve l: This level is located at the Close/Open gap between two cand
Yazarın diğer ürünleri
The script creates account summary report in a separate window. The report can be created for all deals and on deals for selected financial instruments. It is possible to specify a time interval of calculation and save report to htm-file. The script creates account summary report in a separate window. The report can be created for all deals and for deals of the selected financial instruments. It is possible to specify a time interval of calculation and save report to htm-file. Input paramet
The Bollinger Bands indicator drawn using a tick chart. After launching it, wait for enough ticks to come. Parameters: Period - period of averaging. Deviation - deviation from the main line. Price levels count - number of displayed price levels (no levels are displayed if set to 0). Bar under calculation - number of bars on the chart for the indicator calculation. Buffer indexes: 0 - BASE_LINE, 1 - UPPER_BAND, 2 - LOWER_BAND, 3 - BID, 4 - ASK.
Ticks RSI
Andrej Nikitin
The Relative Strength Index indicator drawn using a tick chart. After launching it, wait for enough ticks to come. Parameters: RSI Period - period of averaging. overbuying level - overbought level. overselling level - oversold level. calculated bar - number of bars on the chart for the indicator calculation. The following parameters are intended for adjusting the weight of RSI signals (from 0 to 100). You can find their description in the Signals of the Oscillator Relative Strength Index section
Ticks Bars
Andrej Nikitin
4 (6)
This tick indicator draws synthetic bars/candlesticks that contain a definite number of ticks. Parameters: option prices - price option. It can be Bid, Ask or (Ask+Bid)/2. the number of ticks to identify Bar - number of ticks that form OHLC. price levels count - number of displayed price levels (no levels are displayed if set to 0 or a lower value). calculated bar  - number of bars on the chart. Buffer indexes: 0 - OPEN, 1 - HIGH, 2 - LOW, 3 - CLOSE.
FREE
Ticks
Andrej Nikitin
4 (6)
A simple tick indicator of Bid and Ask prices. The period separator (1 minute) is displayed as a histogram. Parameters Show Bid Line - show/hide the Bid line; Show Ask Line - show/hide the Ask line; Show Labels - show/hide the last price values.
FREE
The script creates account summary report in a separate window. The report can be created for all deals and for deals on selected financial instruments. It is possible to specify a time interval of calculation and save report to an htm file. Script inputs report starting date - initial report generation date. symbols selection for report - select a method of choosing tools for a report generation. allSymbol - report is generated for deals performed on all symbols. onlyCurrentSymbol - report
This utility is used to visually choose an indicator for trailing stop and select its parameters. The Expert Advisor modifies the Stop Loss order position opened for the instrument of the current chart based on indicator values. Uses indicators Parabolic SAR , NRTR (Nick Rypock Trailing Reverse) , Moving Average or linear regression channel. The indicators are added to or removed from the chart using the 'show' checkbox. The following options are available: Parabolic - trailing stop based on t
TrailingStop MA
Andrej Nikitin
3.8 (5)
The indicator draws two simple moving averages using High and Low prices. The MA_High line is displayed when the moving average is directed downwards. It can be used for setting a stop order for a sell position. The MA_Low line is displayed when the moving average is directed upwards. It can be used for setting a stop order for a buy position. The indicator is used in the TrailingStop Expert Advisor. Parameters Period - period of calculation of the moving average. Deviation - rate of convergence
FREE
Tick
Andrej Nikitin
4.33 (3)
A simple tick indicator of Bid and Ask prices. The period separator (1 minute) is displayed as a histogram. Parameters Price_levels_count - number of price levels to be displayed. Bar_under_calculation - number of bars of the indicator to be displayed on the chart.
FREE
TrailingStop MA 4
Andrej Nikitin
4 (3)
The indicator draws two simple moving averages using High and Low prices. The MA_High line is displayed when the moving average is directed downwards. It can be used for setting a stop order for a sell position. The MA_Low line is displayed when the moving average is directed upwards. It can be used for setting a stop order for a buy position. The indicator is used in the TrailingStop Expert Advisor. Parameters Period - period of calculation of the moving average. Deviation - rate of convergence
FREE
The Relative Strength Index indicator drawn using a tick chart. After launching it, wait for enough ticks to come. Parameters: RSI Period - period of averaging. overbuying level - overbought level. overselling level - oversold level. calculated bar - number of bars on the chart for the indicator calculation. The following parameters are intended for adjusting the weight of RSI signals (from 0 to 100). You can find their description in the Signals of the Oscillator Relative Strength Index section
The Envelopes indicator drawn using a tick chart. After launching it, wait for enough ticks to come. Parameters: Averaging period - period of averaging. Smoothing type - type of smoothing. Can have any values of the enumeration ENUM_MA_METHOD . Option prices - price to be used. Can be Ask, Bid or (Ask+Bid)/2. Deviation of boundaries from the midline (in percents) - deviation from the main line in percentage terms. Price levels count - number of displayed price levels (no levels are displayed if
The Stochastic Oscillator indicator is drawn on the tick price chart. After launching it, wait for enough ticks to come. Parameters: K period - number of single periods used for calculation of the stochastic oscillator; D period - number of single periods used for calculation of the %K Moving Average line; Slowing - period of slowing %K; Calculated bar - number of bars in the chart for calculation of the indicator. The following parameters are intended for adjusting the weight of signals of the
The Moving Average Convergence/Divergence(MACD) indicator drawn using a tick chart. After launching it, wait for enough ticks to come. Parameters: Fast EMA period - indicator drawn using a tick chart. Slow EMA period - slow period of averaging. Signal SMA period - period of averaging of the signal line. calculated bar - number of bars on the chart for the indicator calculation. The following parameters are intended for adjusting the weight of MACD signals (from 0 to 100). You can find their desc
The Bollinger Bands indicator drawn using a tick chart. After launching it, wait for enough ticks to come. Parameters: Period - period of averaging. Deviation - deviation from the main line. Price levels count - number of displayed price levels (no levels are displayed if set to 0). Bar under calculation - number of bars on the chart for the indicator calculation. Buffer indexes: 0 - BASE_LINE, 1 - UPPER_BAND, 2 - LOWER_BAND, 3 - BID, 4 - ASK.
The Moving Average of Oscillator(OsMA) indicator drawn using a tick chart. After launching it, wait for enough ticks to come. Parameters: Fast EMA period - fast period of averaging. Slow EMA period - slow period of averaging. Signal SMA period - period of averaging of the signal line. calculated bar - number of bars for the indicator calculation.
The Commodity Channel Index(CCI) indicator drawn using a tick chart. After launching it, wait for enough ticks to come. Parameters: period - number of single periods used for the indicator calculation. calculated bar - number of bars for the indicator calculation. The following parameters are intended for adjusting the weight of CCI signals (from 0 to 100). You can find their description in the Signals of the Commodity Channel Index section of MQL5 Reference. The oscillator has required directio
The Average Directional Movement Index indicator drawn using a tick chart. After launching it, wait for enough ticks to come. Parameters: Period - period of averaging. Сalculated bar - number of bars on the chart for the indicator calculation. Buffer indexes: 0 - MAIN_LINE, 1 - PLUSDI_LINE, 2 - MINUSDI_LINE.
The Standard Deviation (StdDev) indicator drawn using a tick chart. After launching it, wait for enough ticks to come. Parameters: Period - period of averaging. Method - method of averaging. calculated bar - number of bars for the indicator calculation.
The Momentum indicator drawn using a tick chart. After launching it, wait for enough ticks to come. Parameters: period - period of the indicator calculation. levels count - number of displayed levels (no levels are displayed if set to 0) calculated bar - number of bars for the indicator calculation.
The Bulls Power indicator drawn using a tick chart. After launching it, wait for enough ticks to come. Parameters: Period - period of averaging. The number of ticks to identify high/low - number of single ticks for determining high/low. Calculated bar - number of bars for the indicator calculation. The following parameters are intended for adjusting the weight of Bulls Power signals (from 0 to 100). You can find their description in the Signals of the Bulls Power oscillator section of MQL5 Refer
The  Bears Power indicator drawn using a tick chart. After launching it, wait for enough ticks to come. Parameters: Period - period of averaging. The number of ticks to identify high/low - number of single ticks for determining high/low. Calculated bar - number of bars for the indicator calculation. The following parameters are intended for adjusting the weight of Bears Power signals (from 0 to 100). You can find their description in the Signals of the Bears Power oscillator section of MQL5 Refe
Tiks ATR 4
Andrej Nikitin
The  Average True Range (ATR)  indicator drawn using a tick chart. After launching it, wait for enough ticks to come. Parameters: ATR Period  - number of single periods used for the indicator calculation. The number of ticks to identify Bar  - number of single ticks that form OHLC. Price levels count  - number of displayed price levels (no levels are displayed if set to 0 or a lower value). price mode  - choice of prices under calculation (can be bid, ask or average). Сalculated bar  - number of
Tiks WPR 4
Andrej Nikitin
The  Williams' Percent Range (%R)  indicator drawn using a tick chart. After launching it, wait for enough ticks to come. Parameters: WPR Period  - period of the indicator. Overbuying level  - overbought level. Overselling level  - oversold level. price mode  - choice of prices under calculation (can be bid, ask or average). Сalculated bar  - number of bars for the indicator calculation. The following parameters are intended for adjusting the weight of WPR signals (from 0 to 100). You can find t
The  Price Channel  indicator drawn using a tick chart. After launching it, wait for enough ticks to come. Parameters: Period  - period for determining the channel boundaries. Price levels count  - number of displayed price levels (no levels are displayed if set to 0). price mode  - choice of prices under calculation (can be bid, ask or average). Bar under calculation  - number of bars on the chart for the indicator calculation. Buffer indexes: 0 - Channel upper, 1 - Channel lower, 2 - Channel m
Description: Abigail is a medium-term trading system making profit during the price rollback. The Expert Advisor has been optimized for working on EURUSD. However, it can successfully work with other currency pairs as well. You can examine the Expert Advisor's trading statistics for different brokers and symbols at MetaTrader 4 and MetaTrader 5 Trading Signals sections. Parameters: Risk management: enter volume - market entry volume. If the value is greater than 0 - number of lots, if less than
TimeFilter indicator allows you to visually select bit masks (GoodHourOfDay, BadHoursOfDay, GoodDayOfWeek, BadDaysOfWeek) for the  Intraday Time Filter  module of trading signals of the Standard Library. The use of time filters allows you to take into account the particulars of each trading session in performing trading operations.
The indicator is an inter-week hourly filter. When executing trading operations, the indicator allows considering time features of each trading session. Permissive and restrictive filter intervals are set in string form. The used format is [first day]-[last day]:[first hour]-[last hour]. See the screenshots for examples. Parameters: Good Time for trade - intervals when trading is allowed. Bad Time for trade - intervals when trading is forbidden. time filter shift (hours) - hourly shift. percent
TrailingStop 4
Andrej Nikitin
4.83 (6)
The Expert Advisor modifies the Stop Loss order position opened for the instrument of the current chart based on indicator values. Uses indicators Parabolic SAR ,  NRTR (Nick Rypock Trailing Reverse) ,  Moving Average  or linear regression channel. Switchable modes: Trailing stop only when in profit; Trailing stop only following the price; On every teak or on formed bars; Trailing for each order separately or for a total position. Has an option of "hidden stop", also you can exclude individual
The EA performs trade operations of closing position groups. Positions are grouped by type. It is possible to select orders by the profit (loss) value. It is possible to form the closure groups manually. You can set a value for automatic closure of a positions group after reaching a certain profit/loss level or price level. The additional functions of the EA are called using the hot keys: SHIFT+A - show/hide Auto exit options. SHIFT+S - show/hide Settings panel. SHIFT+V - sound ON/OFF. SHIFT+I -
Filtrele:
Andrei
836
Andrei 2017.05.28 08:08 
 

Kullanıcı incelemeye herhangi bir yorum bırakmadı

İncelemeye yanıt
Sürüm 1.12 2021.11.17
Compile application in the latest platform build.
Sürüm 1.10 2017.01.20
Added downloading of bars from available tick history.
Added the ability to select the base price.