Quasar X
- Göstergeler
- Yuki Miyake
- Sürüm: 8.44
- Güncellendi: 11 Mayıs 2026
- Etkinleştirmeler: 5
The Ultimate MTF Sync System "Quasar X" Complete Manual
"Quasar X" is a professional-grade market analysis and trading assistant system built on the core principle of market structure: "Dow Theory."
It consolidates complex market analysis into a sleek dashboard, allowing you to instantly identify where the market edge lies with simple, intuitive operations.
🌟 3 Main Features of Quasar X
1. The Royal Road & Strongest Logic: "Dow Theory" Based
This system internally and automatically calculates the basic market structure (higher highs, lower lows based on Dow Theory). It strictly extracts only the highest probability setups where the higher timeframe (long-term trend) and lower timeframe (short-term trend) perfectly align (SYNC).
2. "Easy Operation Panel" Completed with One Click
No more tedious chart switching. From the stylish on-screen panel, you can instantly switch timeframes and currency pairs with a single click. It also features a "Scanner Function" that allows you to monitor the trend status (SYNC state) of multiple assets in real-time right on the panel.
3. The Perfect Filter for Your Favorite "Arrow Indicators"!
While Quasar X is incredibly powerful on its own, it truly shines when combined with your favorite "Arrow (Signal) Indicators."
-
Quasar X's Role: Determines the overall market "Direction" (Trend).
-
Arrow Indicator's Role: Pinpoints the "Timing" (Trigger) for entry.
By simply following the rule: "Only take UP arrows when Quasar X shows 'SYNC BUY'," you can drastically reduce losing trades caused by false signals and whipsaws.
🖥️ Panel Guide & How to Use
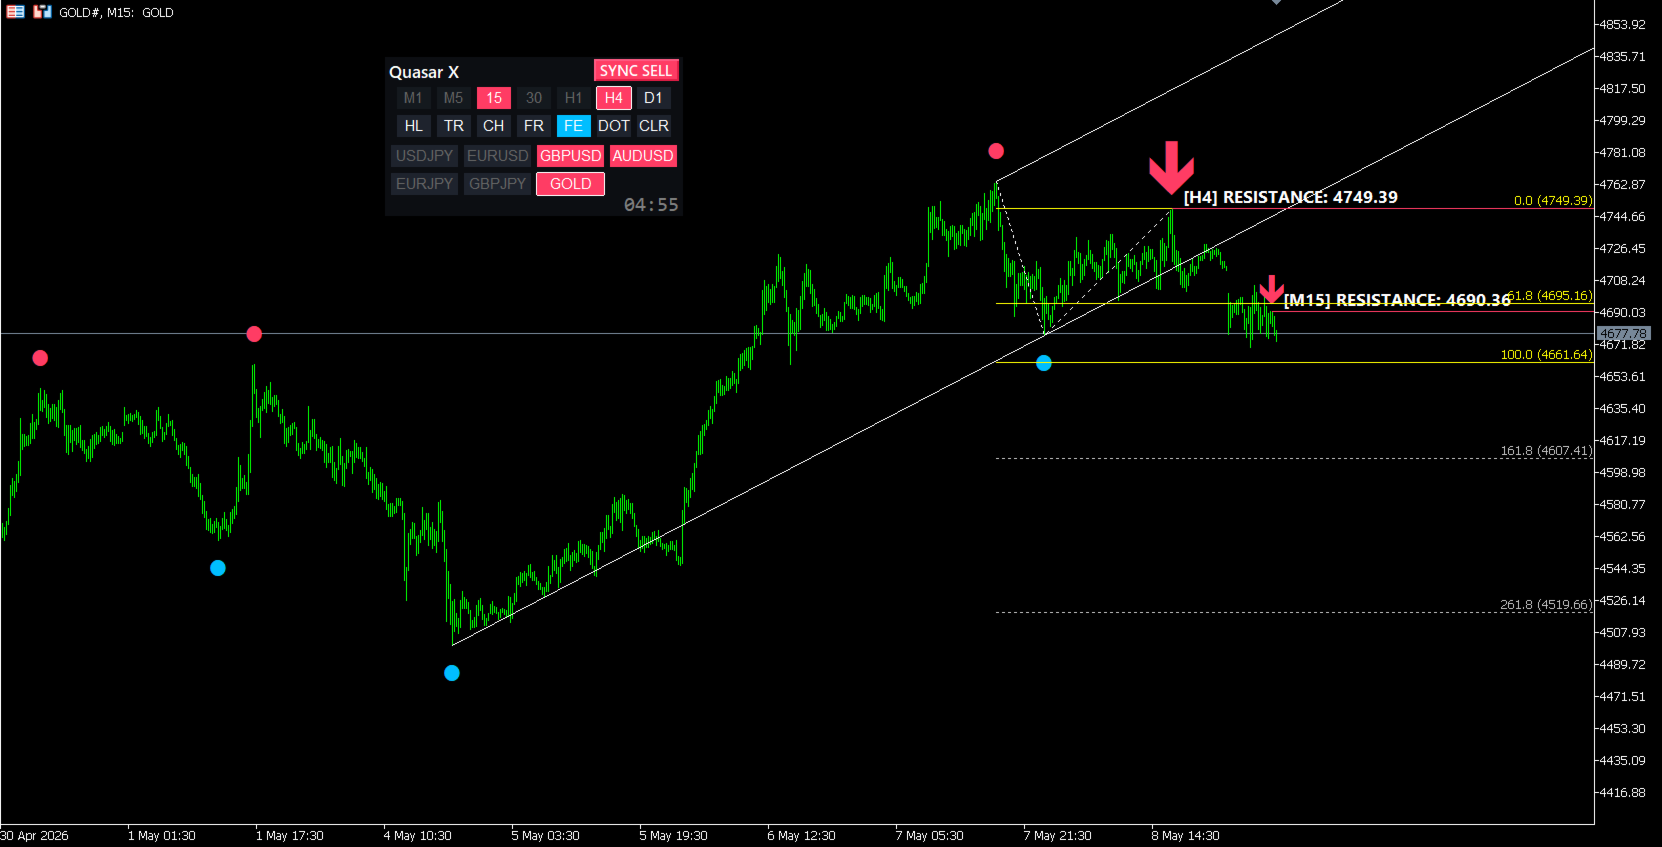
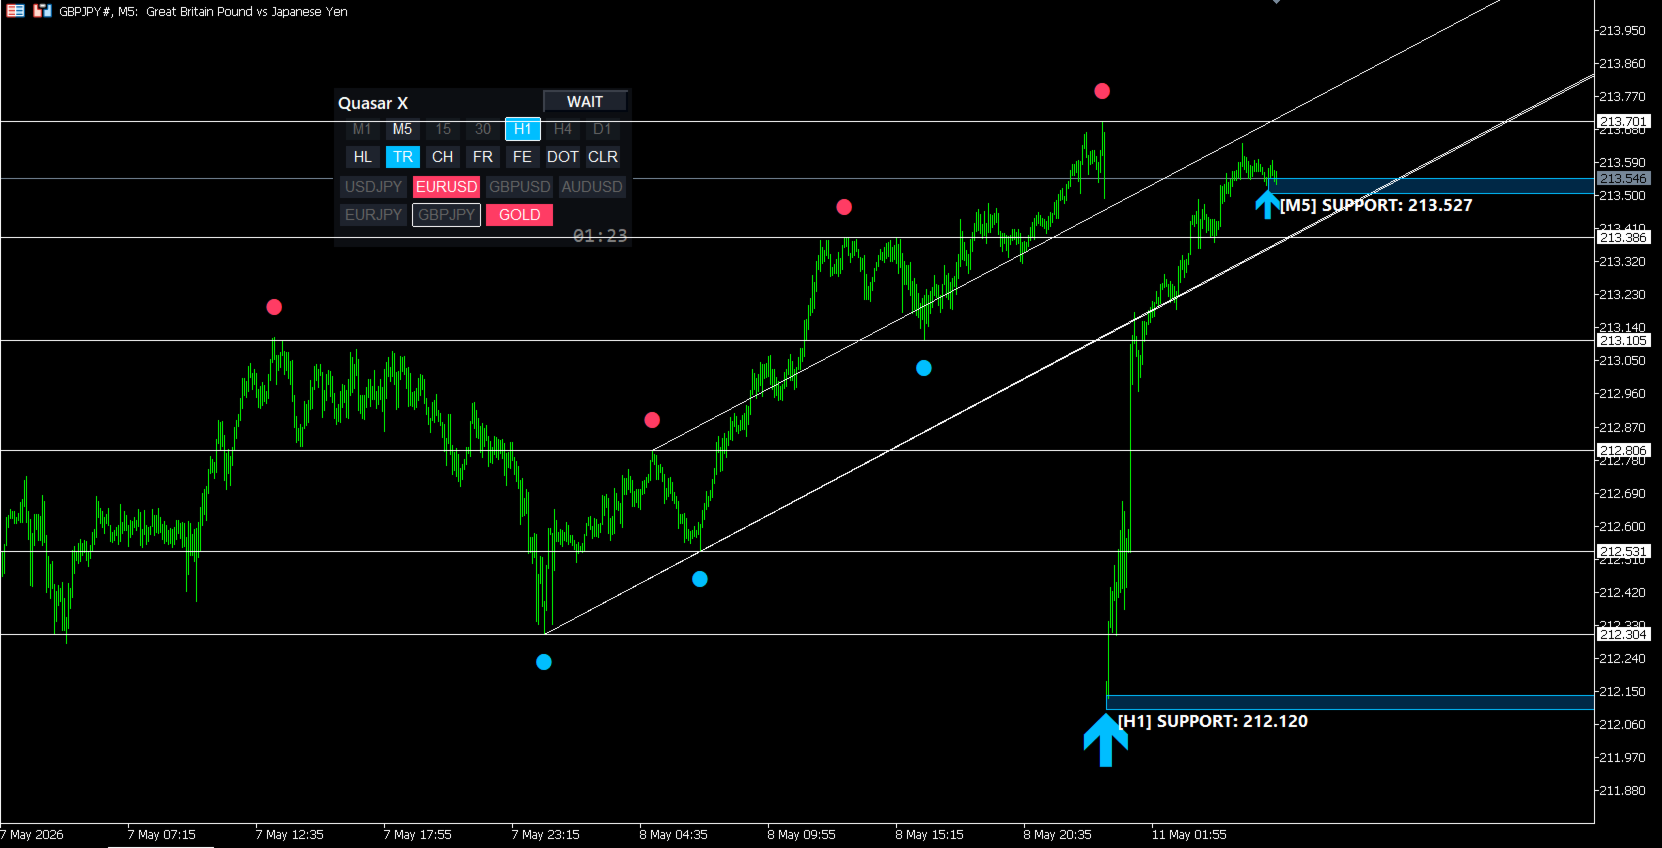
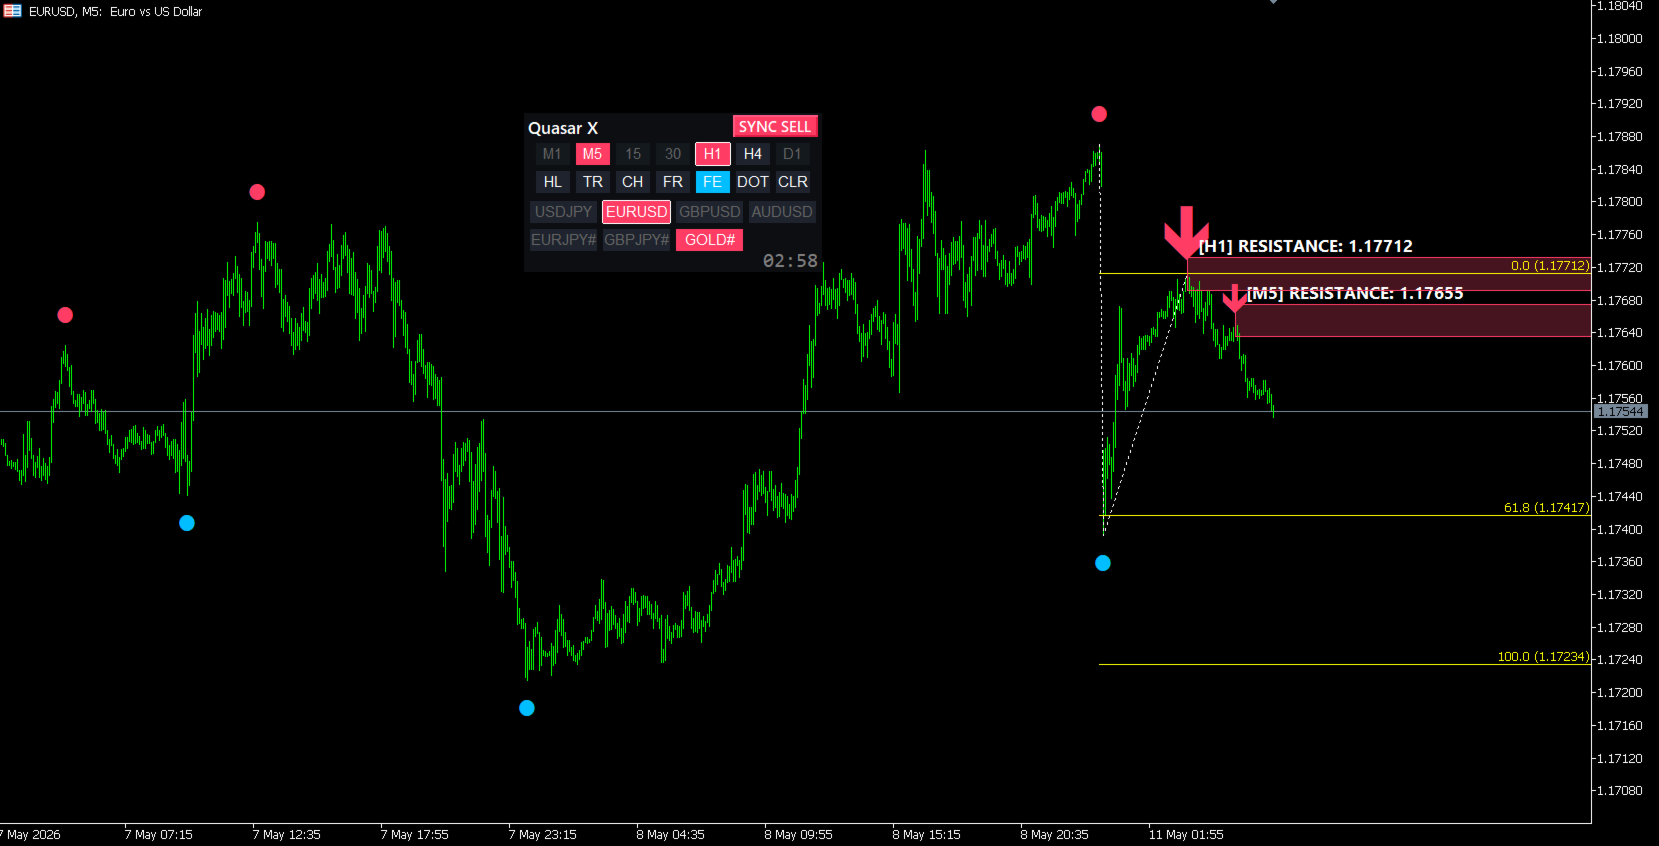
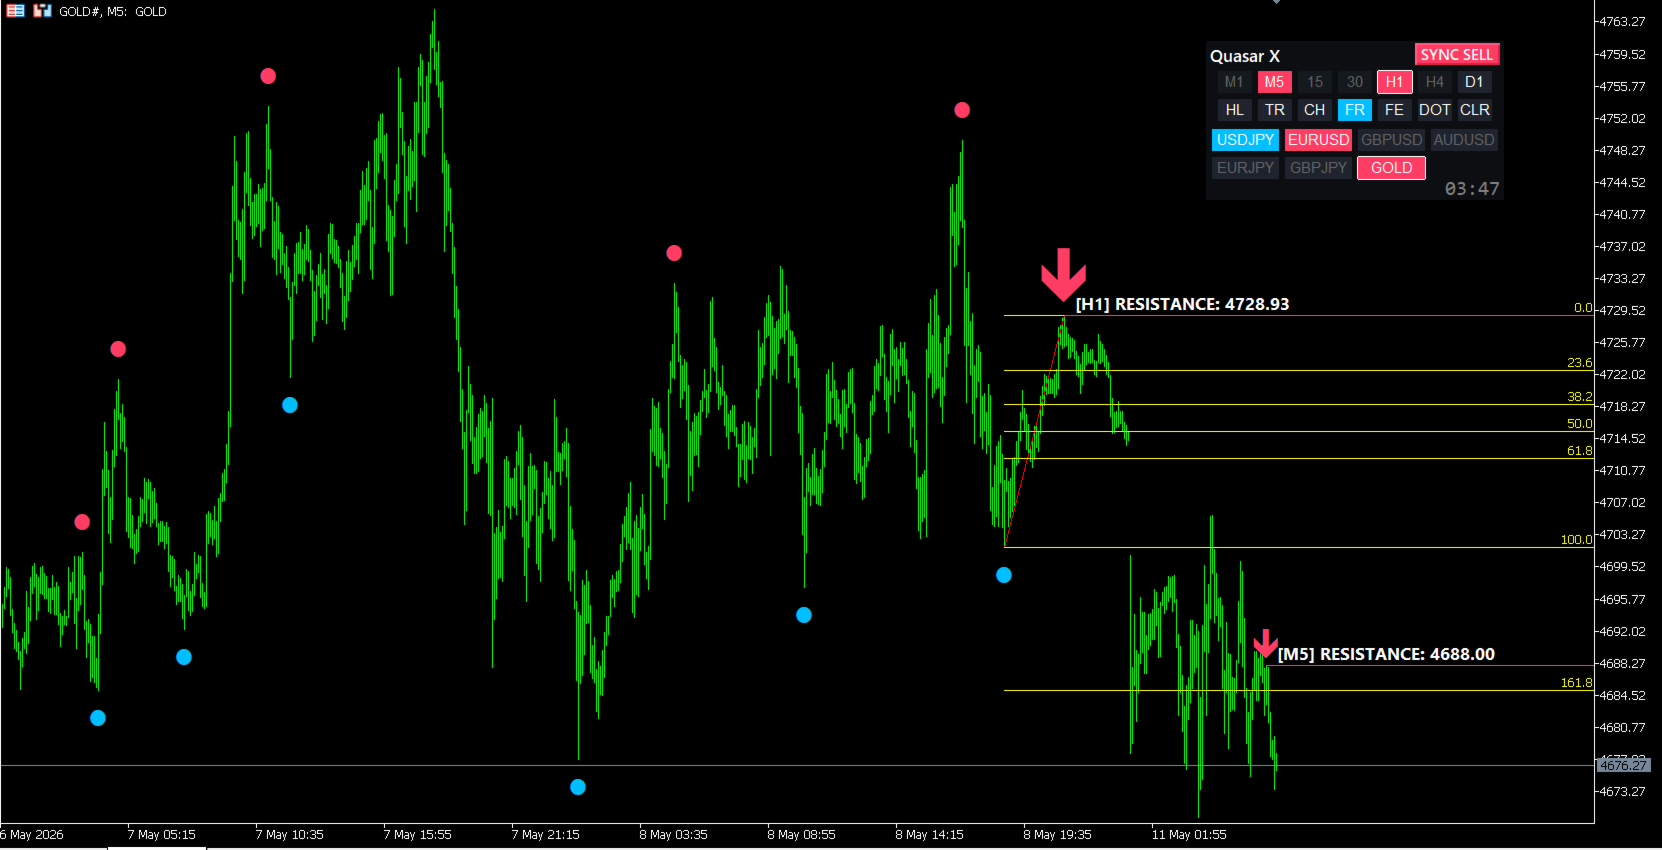
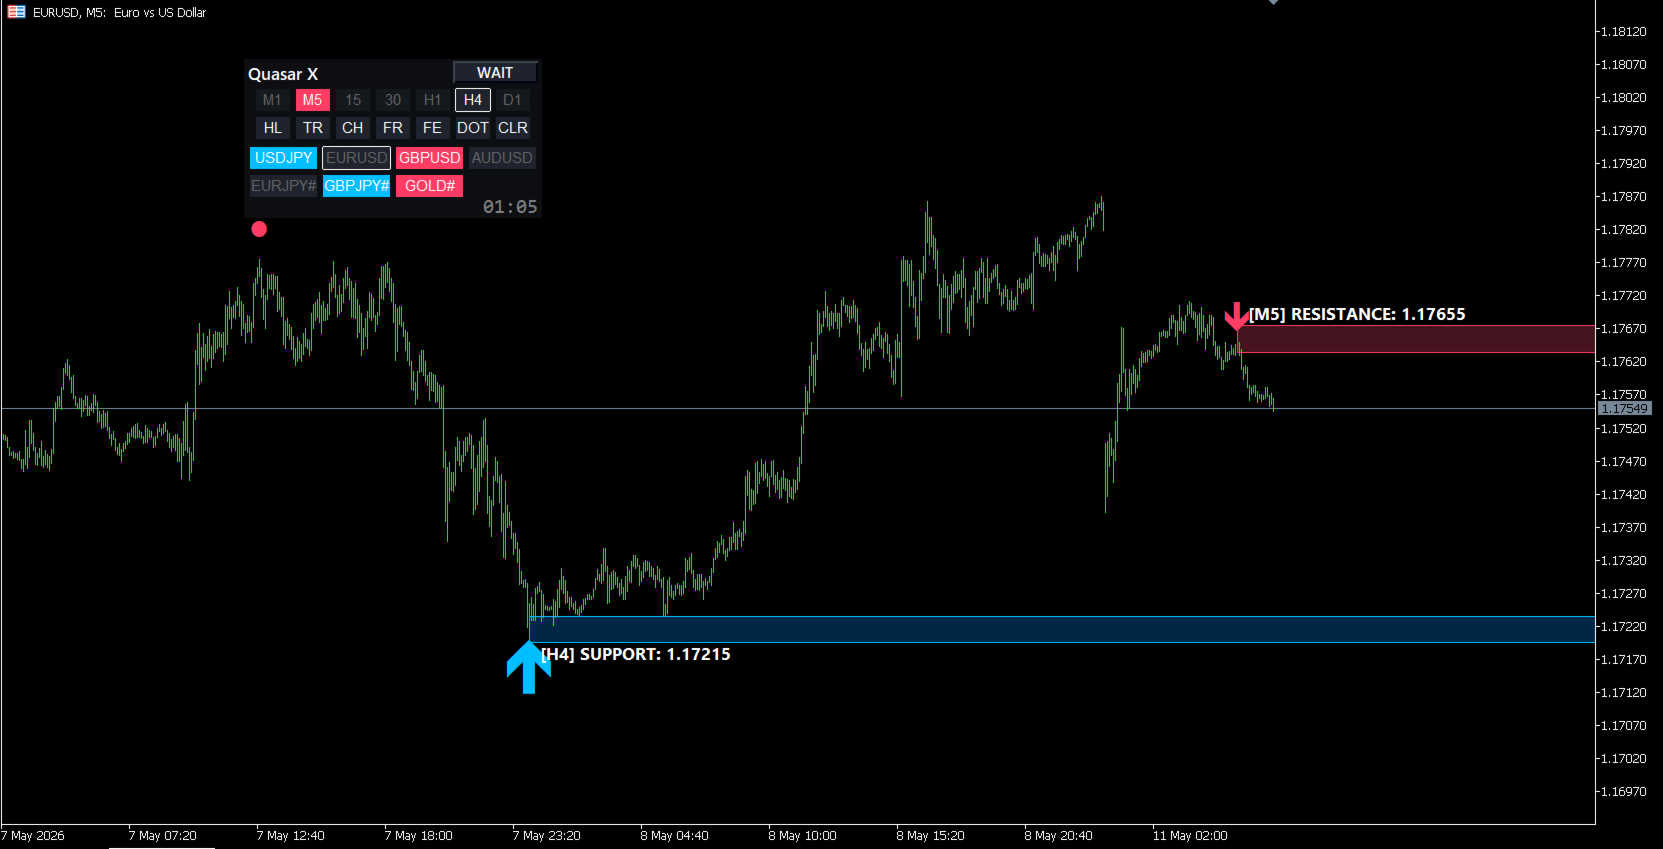
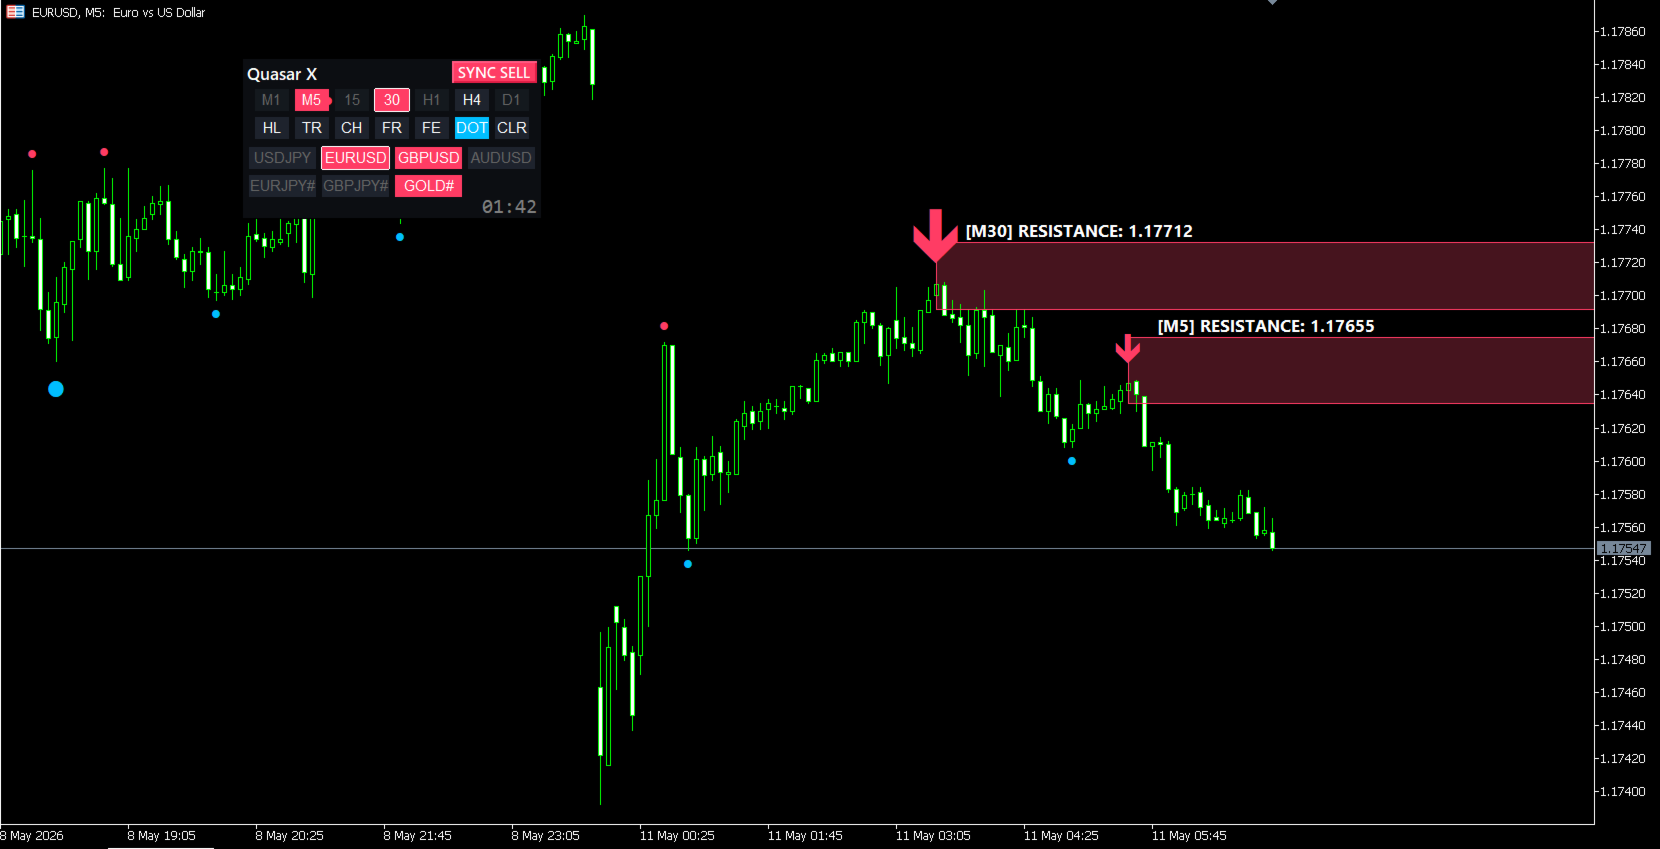
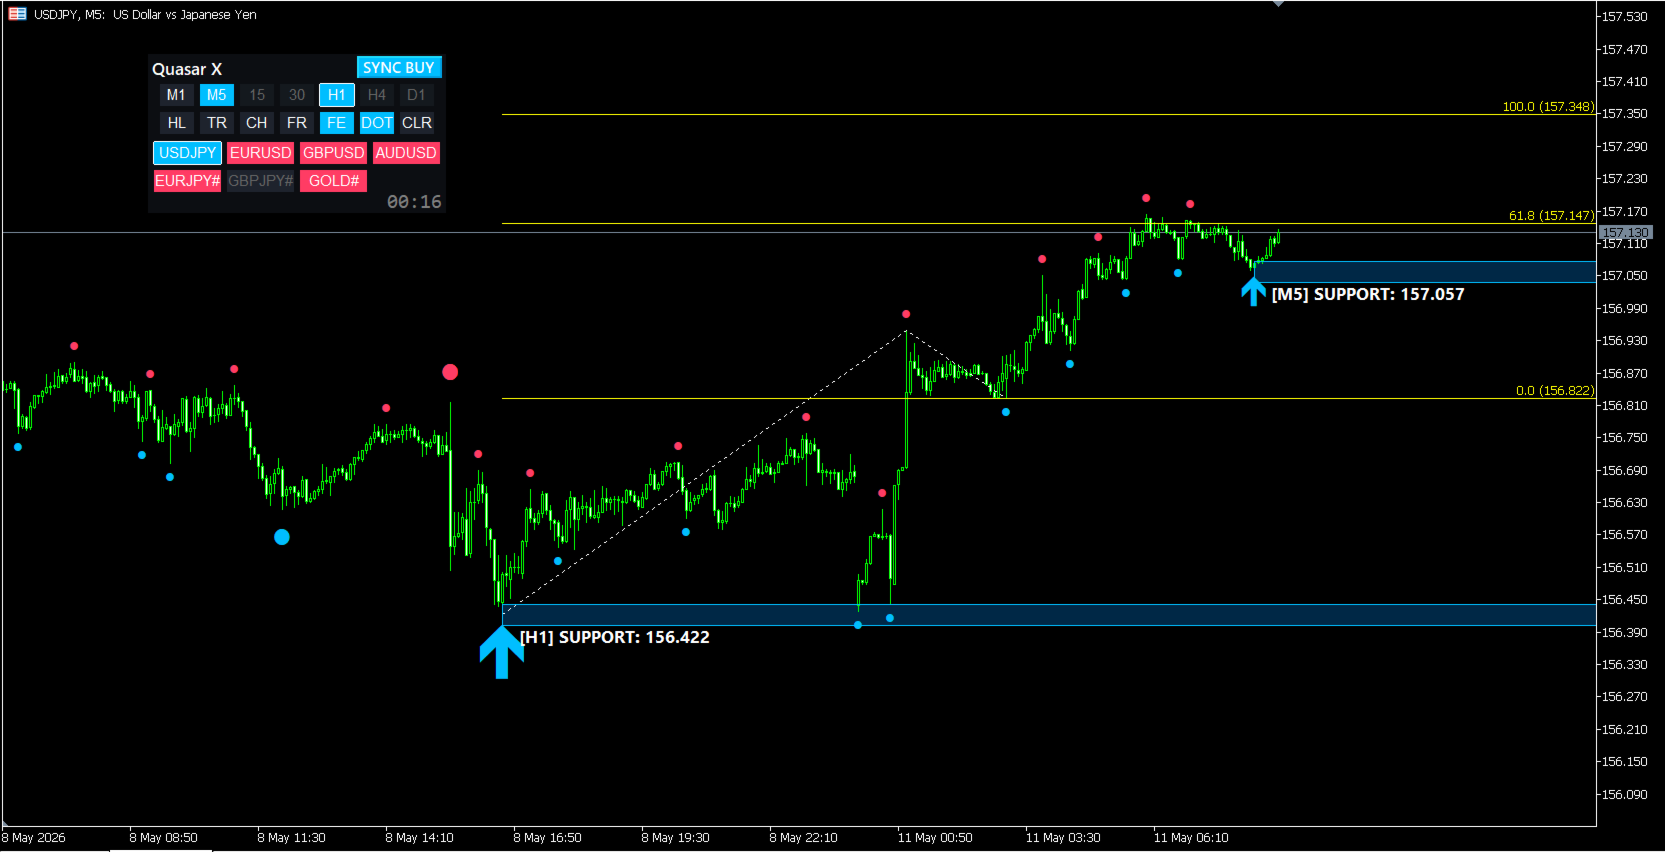
When you apply Quasar X to your chart, a dedicated dashboard panel will appear.
-
Trend Status (DirLabel)
-
SYNC BUY (Blue): Higher and lower timeframes are aligned in an uptrend. Look for buying opportunities.
-
SYNC SELL (Red): Higher and lower timeframes are aligned in a downtrend. Look for selling opportunities.
-
WAIT (Gray): Timeframes are conflicting or the market is ranging. Stay out of the market.
-
-
Timeframe Buttons (M1, M5, 15, 30...)
-
Shows the trend status of each timeframe by color. Click to instantly switch the chart's timeframe.
-
-
Currency Pair Buttons (Scanner)
-
Displays the assets registered in your watchlist (e.g., EURUSD, GOLD). Colored buttons indicate that the trends are currently aligned for that specific asset (an opportunity is forming). Click to jump directly to that chart.
-
-
Drawing Assist Buttons (HL, TR, CH, FR, FE, DOT)
-
By simply clicking the dots (wave peaks) drawn on the chart, you can automatically and accurately draw Horizontal Lines (HL), Trendlines (TR), Channels (CH), and Fibonacci tools (FR/FE). This heavily assists with tedious chart markups.
-
💡 Recommended Trading Steps (Basic Strategy)
-
Find Opportunities Look at the "Currency Pair Buttons" at the bottom of the panel. Click on a symbol that is lit up in Blue (Buy) or Red (Sell).
-
Check the Environment Confirm that the status on the top-left of the panel shows SYNC BUY or SYNC SELL .
-
Aim for Entry Following the direction of Quasar X, enter the market when your favorite oscillator turns or your arrow indicator fires a signal.
-
Exit (Take Profit / Stop Loss) Use the "Support/Resistance Zones" (colored bands) dynamically drawn by Quasar X as your target price (Take Profit), or place your Stop Loss just outside of these zones.
How to Use the Drawing Assist Tools
By clicking the buttons in the middle of the panel, you can easily and accurately draw lines and Fibonacci tools based on the "Dots" (wave peaks) generated by Quasar X.
-
HL (Horizontal Line)
-
How to use: Click the HL button, then click 1 Dot on the chart.
-
Effect: A horizontal line is drawn, snapping perfectly to the exact price (high or low wick) of the selected dot.
-
-
TR (Trend Line)
-
How to use: Click the TR button, then click 2 Dots (start point and end point) in sequence.
-
Effect: An accurate trendline connecting the two peaks is drawn and extended to the right.
-
-
CH (Channel)
-
How to use: Click the CH button, then click 3 Dots in sequence (e.g., Low 1 → Low 2 → High 3).
-
Effect: An accurate equidistant channel is drawn based on the selected points.
-
-
FR (Fibonacci Retracement)
-
How to use: Click the FR button, then click 2 Dots (start of the wave → end of the wave).
-
Effect: A Fibonacci Retracement is drawn to help you identify potential pullbacks or bounce levels.
-
-
FE (Fibonacci Expansion / Extension)
-
How to use: Click the FE button, then click 3 Dots in sequence (start of wave → end of wave → pullback point).
-
Effect: A Fibonacci Expansion is drawn to predict how far the 3rd wave might travel (Take profit targets: 61.8%, 100%, 161.8%, etc.).
-
-
DOT (Toggle Dots)
-
How to use: Click to toggle the visibility of the "Dots" (wave peaks) on the chart. Useful when you want a cleaner chart view.
-
-
CLR (Clear)
-
How to use: Clicking this button will instantly delete all manual drawings (HL, TR, CH, FR, FE) you have made using these assist tools. (Note: This will not delete the zones or arrows automatically generated by Quasar X.)
-
-
【Disclaimer & Notes】
-
While this system provides a high statistical edge, it does not guarantee a 100% win rate. Always practice proper risk management and use Stop Losses.
-
It is highly recommended to avoid trading during major economic news releases, as technical analysis becomes less reliable during extreme volatility.