Price Break
- Göstergeler
- Miguel Antonio Rojas Martinez
- Sürüm: 1.20
- Güncellendi: 17 Kasım 2021
- Etkinleştirmeler: 15
The "Price Break" indicator is a powerful tool for any trader. If the price breaks the levels the indicator shows, there is a 77% chance it will go in the same direction.
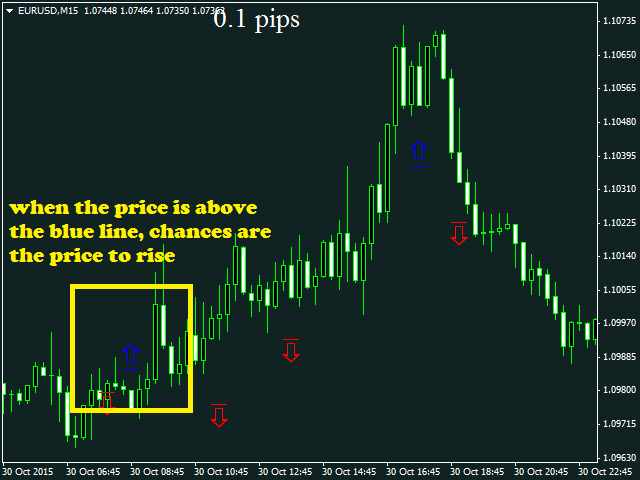
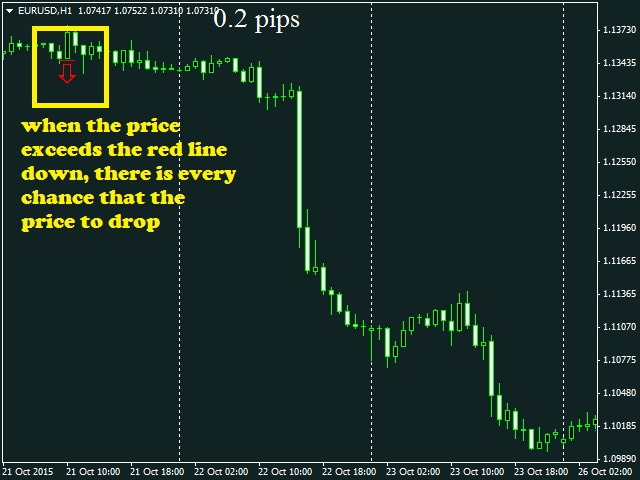
If it exceeds the blue line, there are many possibilities for the price to rise. On the contrary, if it passes down the red line, it means that there are many possibilities for the price to drop.
We should always consider the latest indicator signal, so we should rely only on the last blue arrow and the last red arrow.
The indicator has only one input.
- SPACES: increasing this value, the input is more refined, but of course, it will have less signals, by default, you should use the value 3.
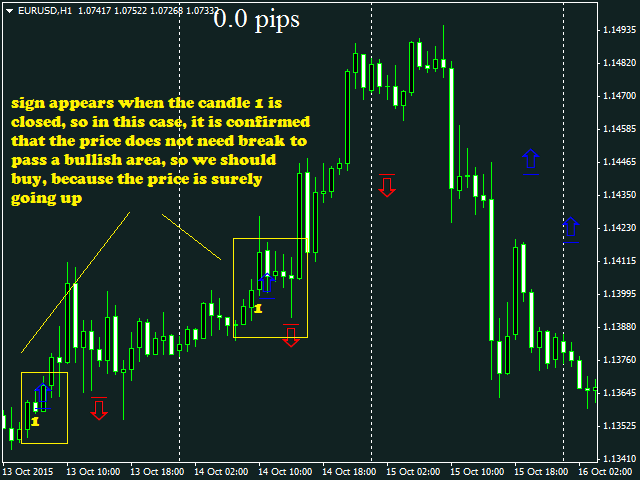
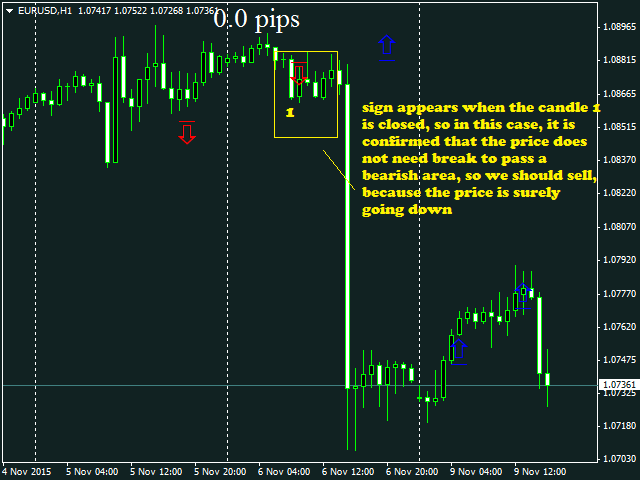
The strategy is to place a pending order in each of these levels, and update whenever the indicator generates a new signal (arrow). When the indicator is shown on the very price, a pending order cannot be set. Execute the purchase or sale immediately.
Señor Rojas, le escribo desde España. Le felicito por este brillante indicador, lo estoy usando y estoy asombrado de lo bien que va y lo preciso que es. No obstante me gustaría hacerle una pregunta que sólo el creador del indicador me puede responder con exactitud y me sería de gran ayuda para su mejor aprovechamiento. Cuando aparece una flecha encima de una vela que cierra en sentido contrario, o sea una flecha roja de venta, encima de una vela que cierra en compra ¿debo cambiar de direccion, o seguir como estaba? Le acompaño un gráfico para mejor comprensión. Gracias por su tiempo Mr. Rojas, I am writing to you from Spain. I congratulate you for this brilliant indicator, I am using it and I am amazed at how well it works and how accurate it is. However, I would like to ask you a question that only the creator of the indicator can answer me exactly and it would be of great help for me to make the best use of it. When an arrow appears above a candle that closes in the opposite direction, i.e. a red sell arrow, above a candle that closes as a buy, should I change direction or continue as I was? I am enclosing a chart for better understanding. Thank you for your time