Keltner Enhanced
- Göstergeler
- David Ben Svaiter
- Sürüm: 2.0
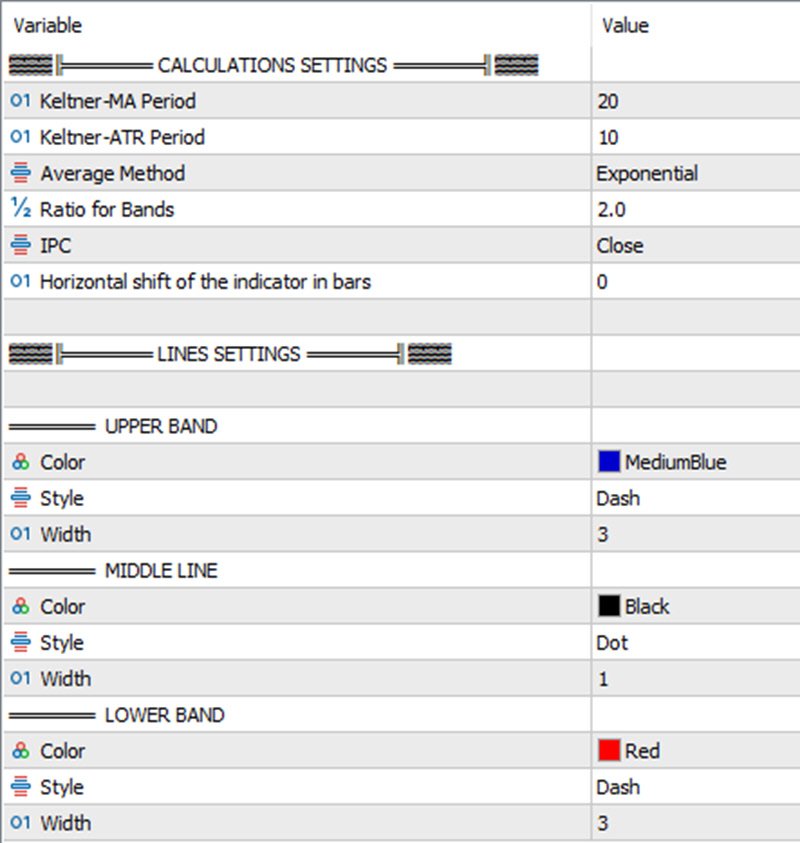
Keltner-Enhanced, Keltner Kanallarının doğruluğunu ve okunabilirliğini, bunları ayarlamak için birçok seçenek ve META varsayılanının ötesinde daha fazla beş fiyat hesaplaması ile geliştirir.
Keltner-E göstergesi, Bollinger Bantları ve Hareketli Ortalama Zarflarına benzer bantlı bir göstergedir. Bir orta çizginin üzerinde bir üst zarf ve orta çizginin altında bir alt zarftan oluşurlar.
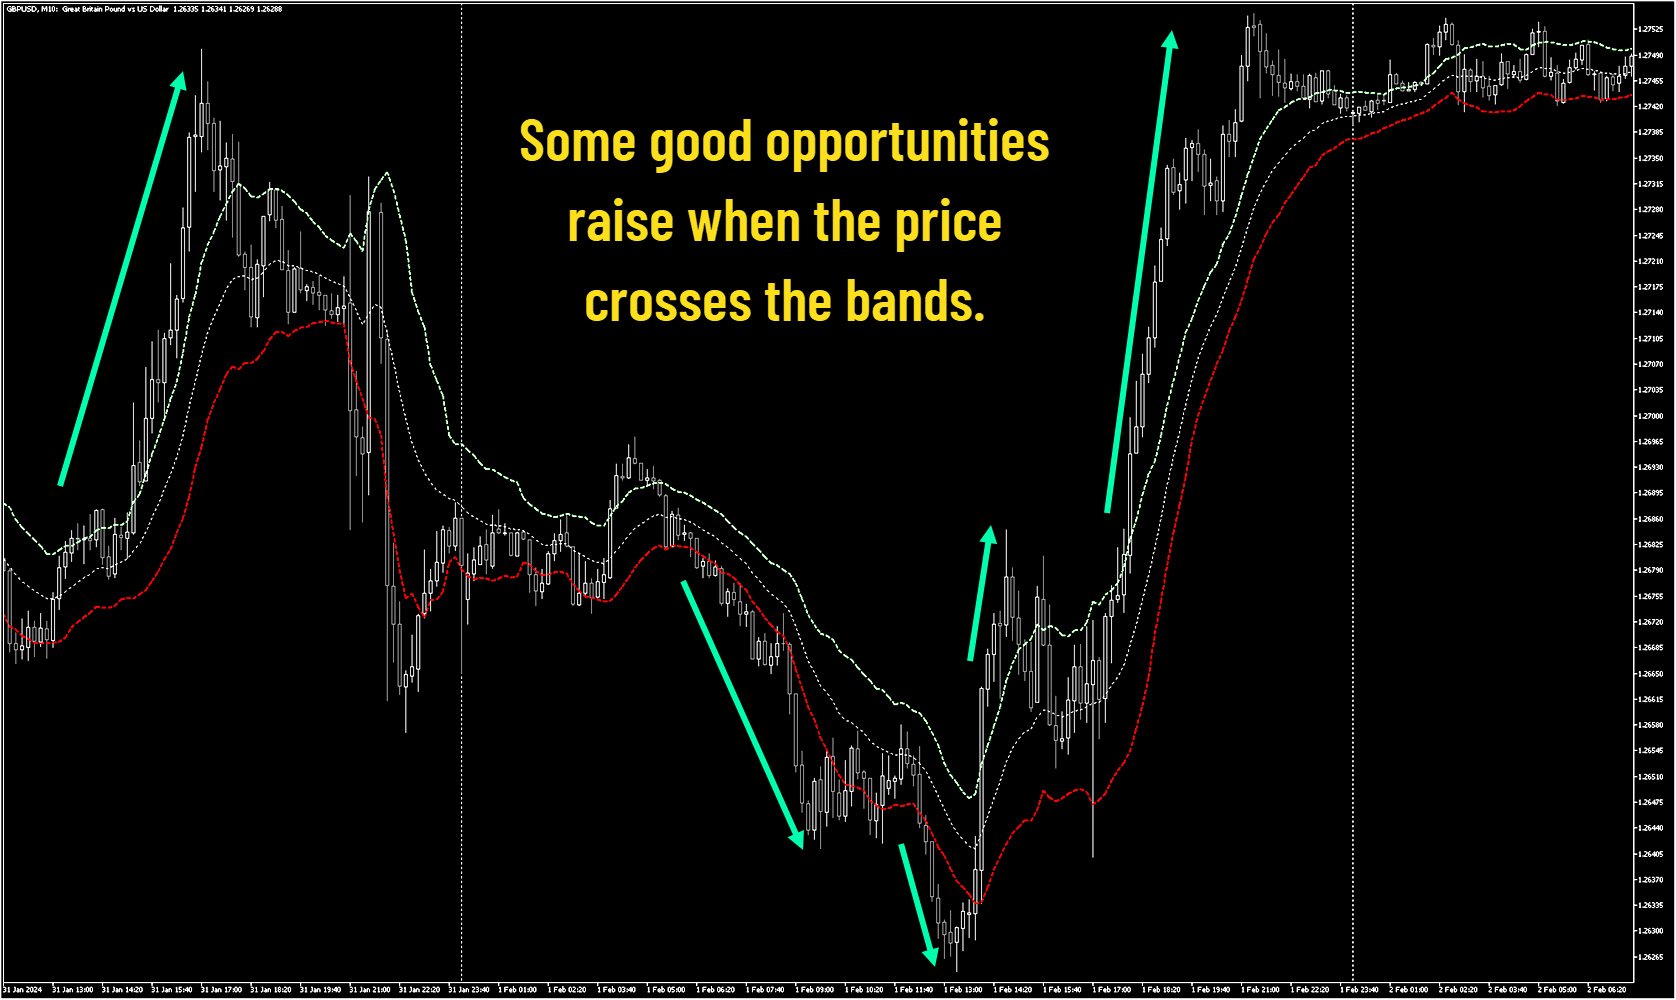
Keltner Kanallarını kullanırken dikkat edilmesi gereken ana olaylar, Üst Zarfın üstünde veya Alt Zarfın altında kırılmalardır. Üst Zarfın üzerindeki bir kırılma aşırı alım koşullarına işaret eder. Alt Zarfın altında bir kırılma aşırı satım koşulları anlamına gelir.
Bununla birlikte, Keltner Kanallarını kullanırken, aşırı alım ve aşırı satım koşullarının genellikle bir güç işareti olduğunu unutmayın.
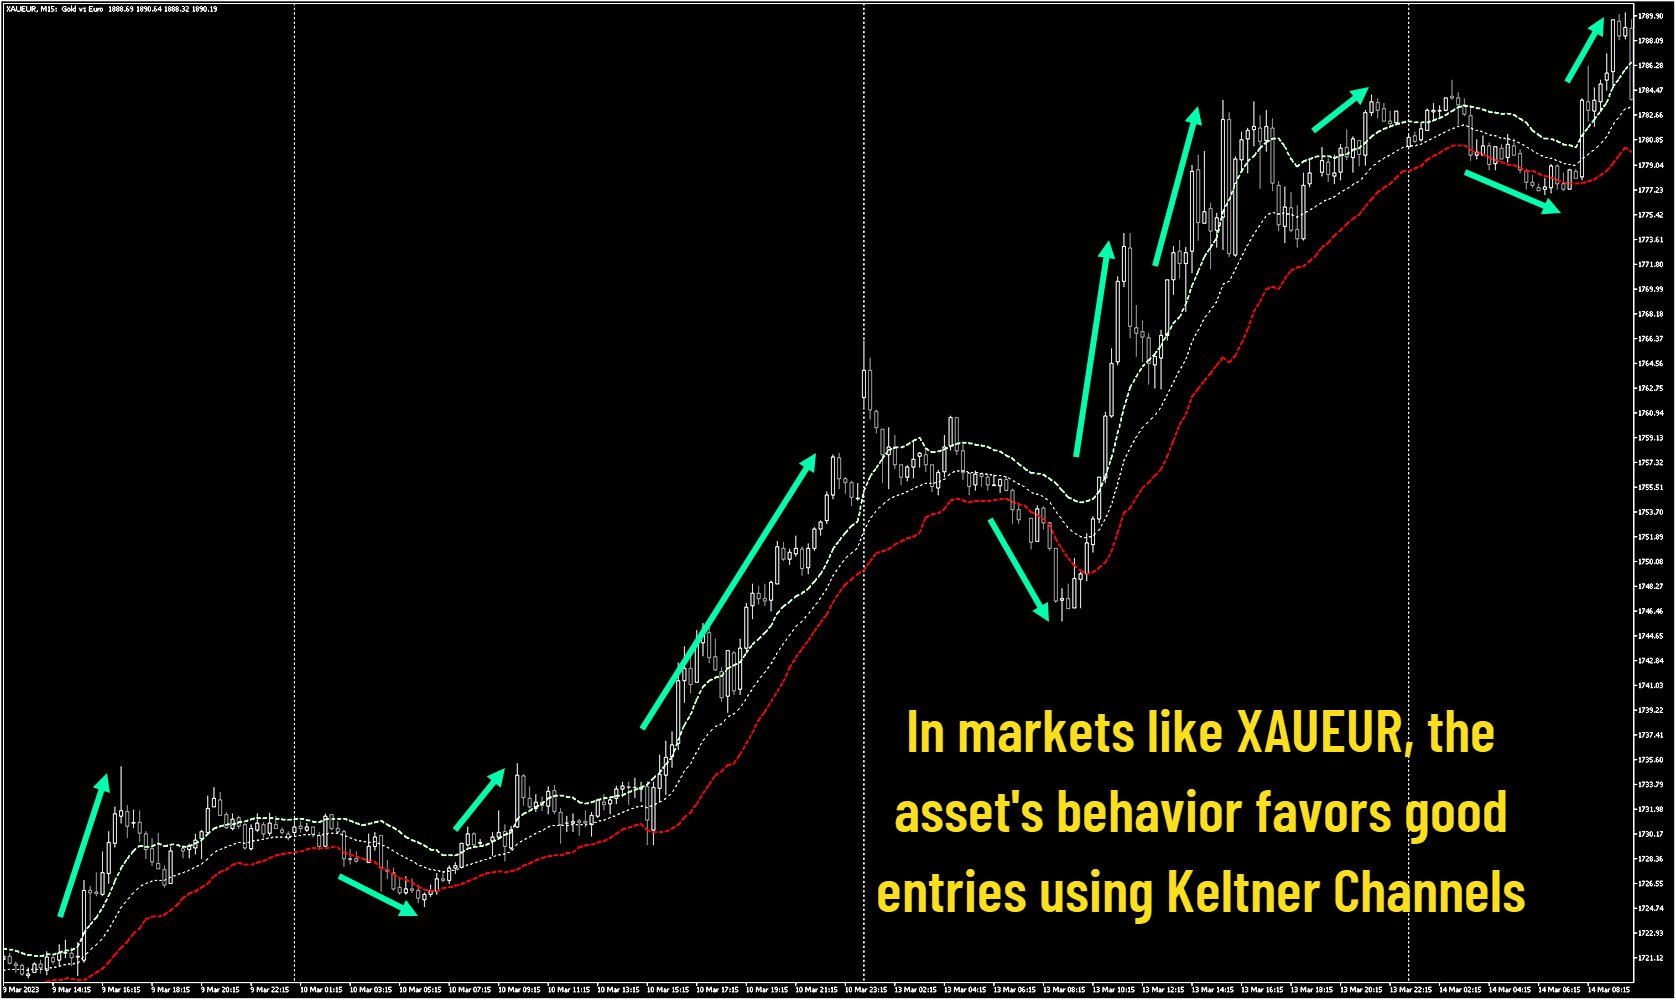
Açıkça tanımlanmış bir trend sırasında, aşırı alım ve aşırı satım koşulları güç anlamına gelebilir. Bu durumda, mevcut trend güçlenecek ve nihayetinde devam edecektir. Bu durum yatay bir piyasada biraz daha farklı işler. Piyasa yatay bir trend içindeyken, aşırı alım ve aşırı satım değerlerini genellikle fiyatın hareketli ortalamaya (orta çizgi) doğru bir dönüş hareketi izler.
Umarım iyi işlemler yapmanız için faydalı olur.

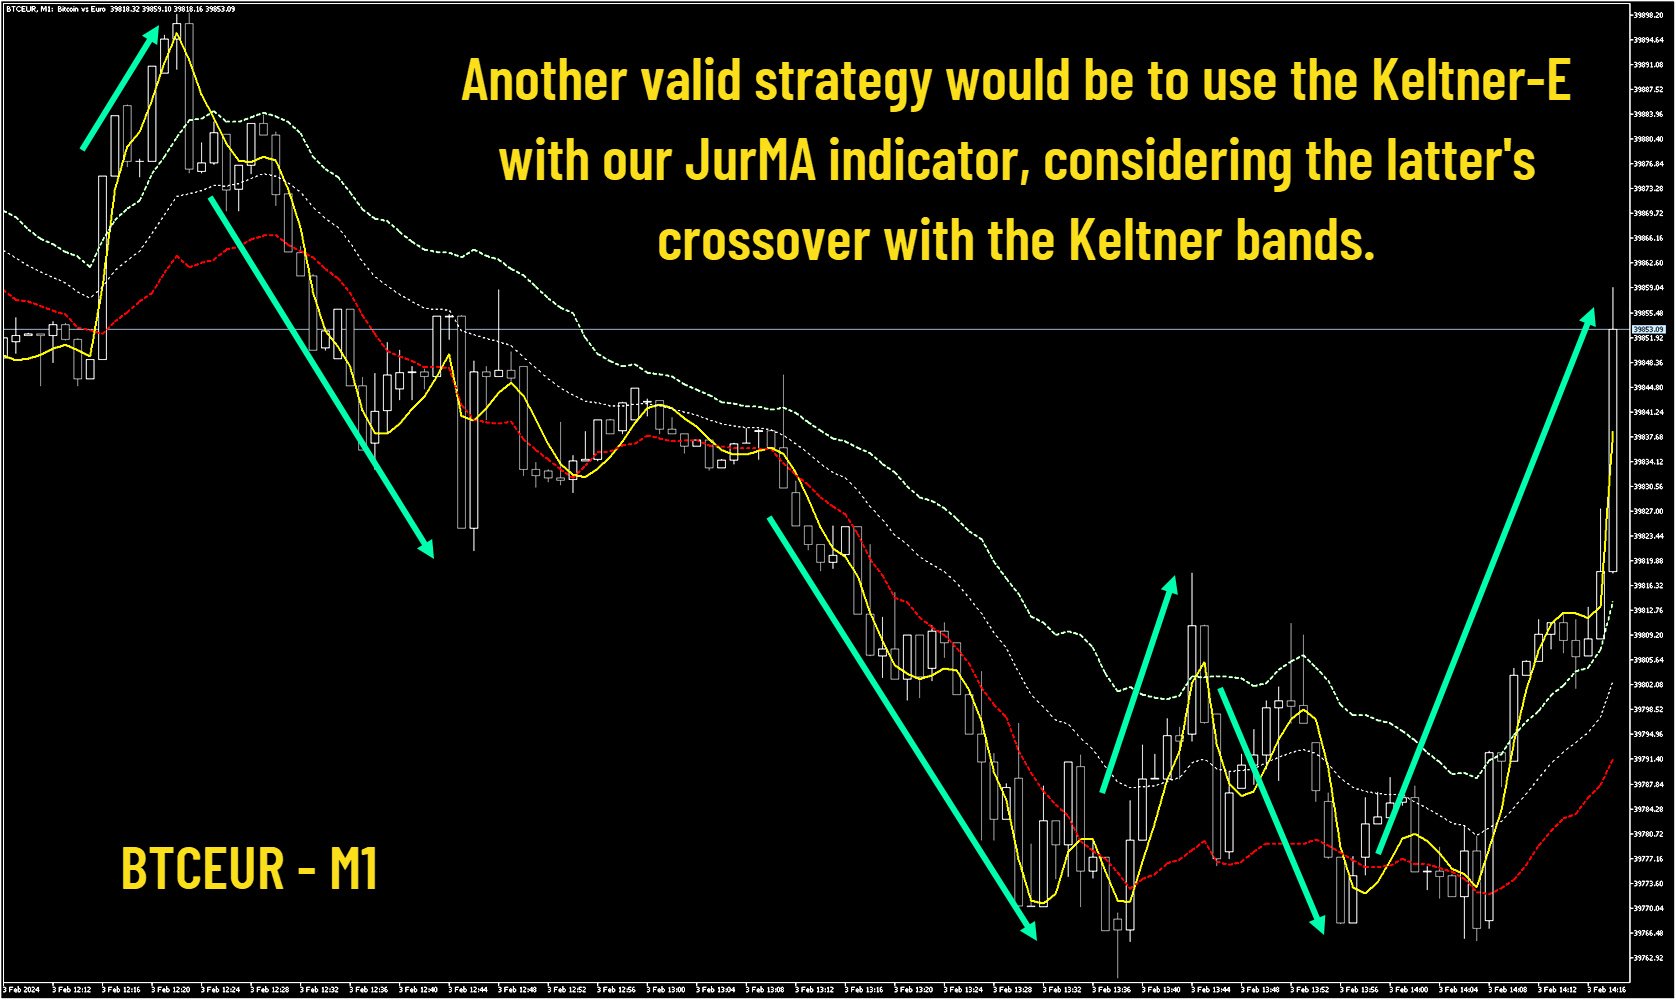

Excelente para tendencia... ainda mais se utilizado com uma media rapida para confirmar as entradas