Keltner Enhanced
- Indicatori
- David Ben Svaiter
- Versione: 2.0
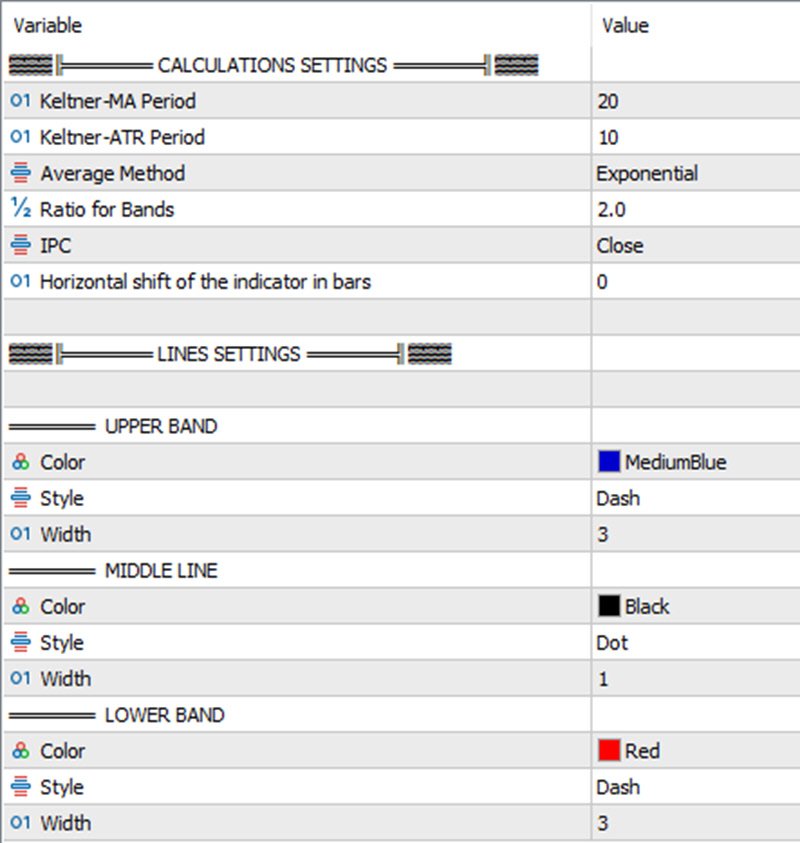
Keltner-Enhanced migliora l'accuratezza e la leggibilità dei canali Keltner con molte opzioni di regolazione e cinque calcoli di prezzo in più rispetto al META predefinito.
L'indicatore Keltner-E è un indicatore a bande simile alle Bande di Bollinger e agli Inviluppi delle medie mobili. Consiste in un inviluppo superiore al di sopra di una linea mediana e in un inviluppo inferiore al di sotto della linea mediana.
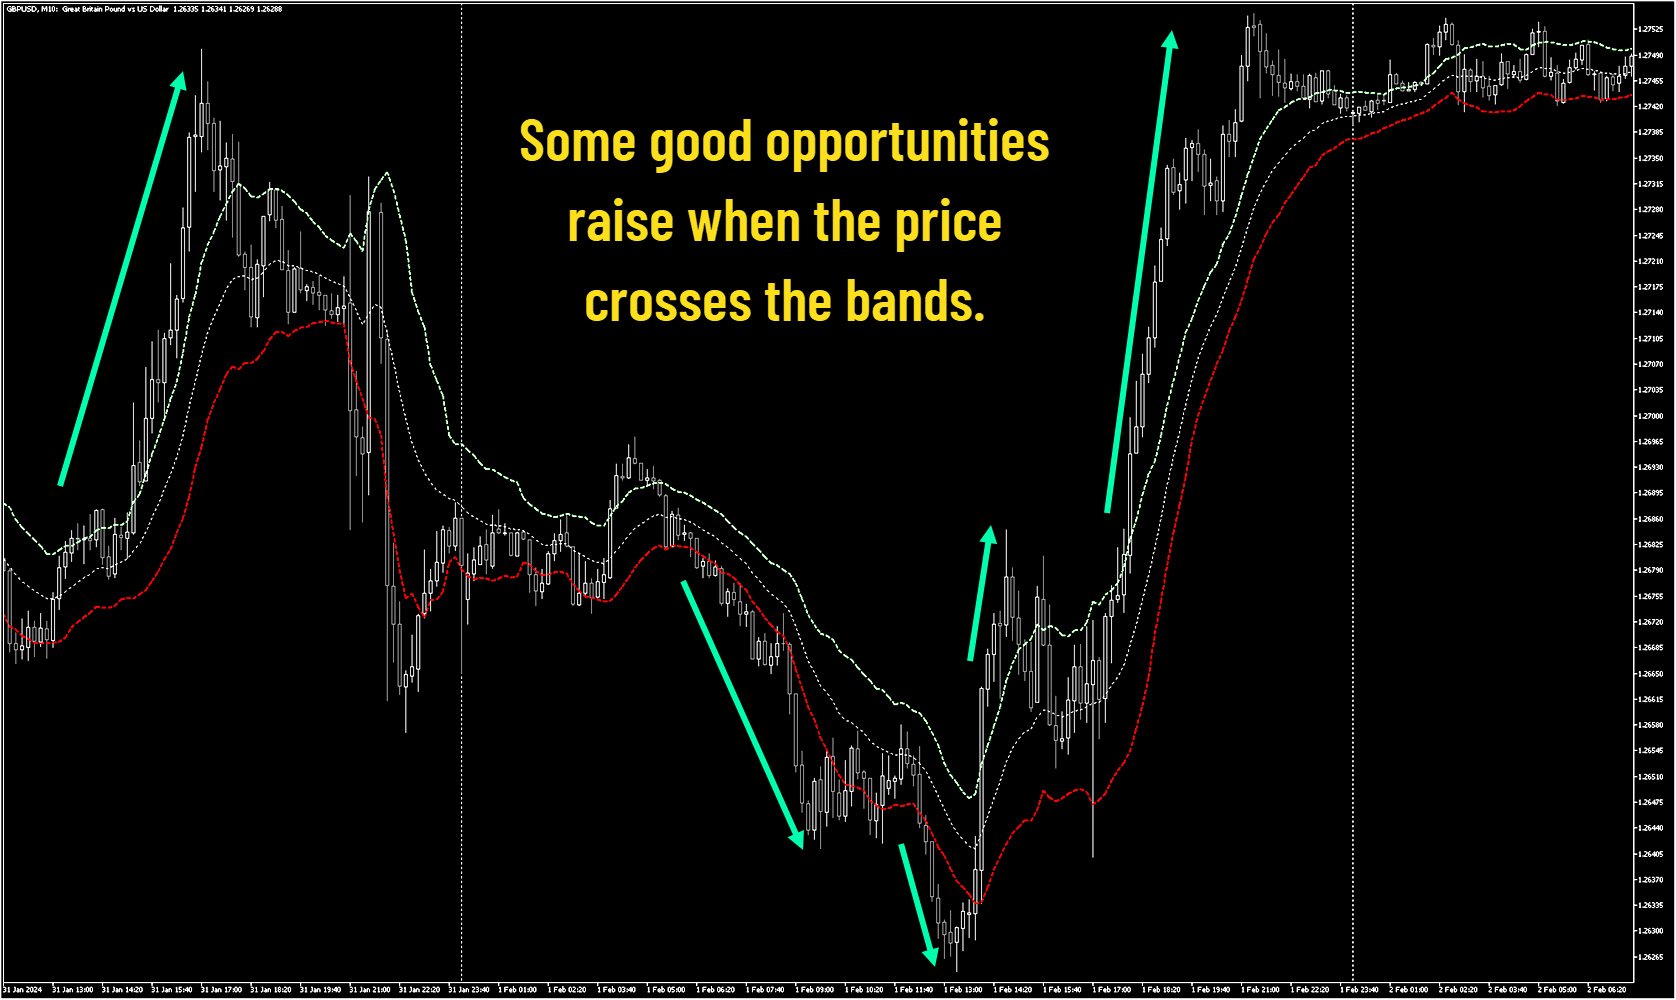
I principali eventi a cui prestare attenzione quando si utilizzano i canali Keltner sono i breakout al di sopra dell'inviluppo superiore o al di sotto dell'inviluppo inferiore. Un breakout al di sopra dell'involucro superiore indica condizioni di ipercomprato. Un breakout al di sotto dell'Inviluppo inferiore indica condizioni di ipervenduto.
Tuttavia, quando si utilizzano i canali di Keltner, bisogna tenere presente che le condizioni di ipercomprato e ipervenduto sono spesso un segnale di forza.
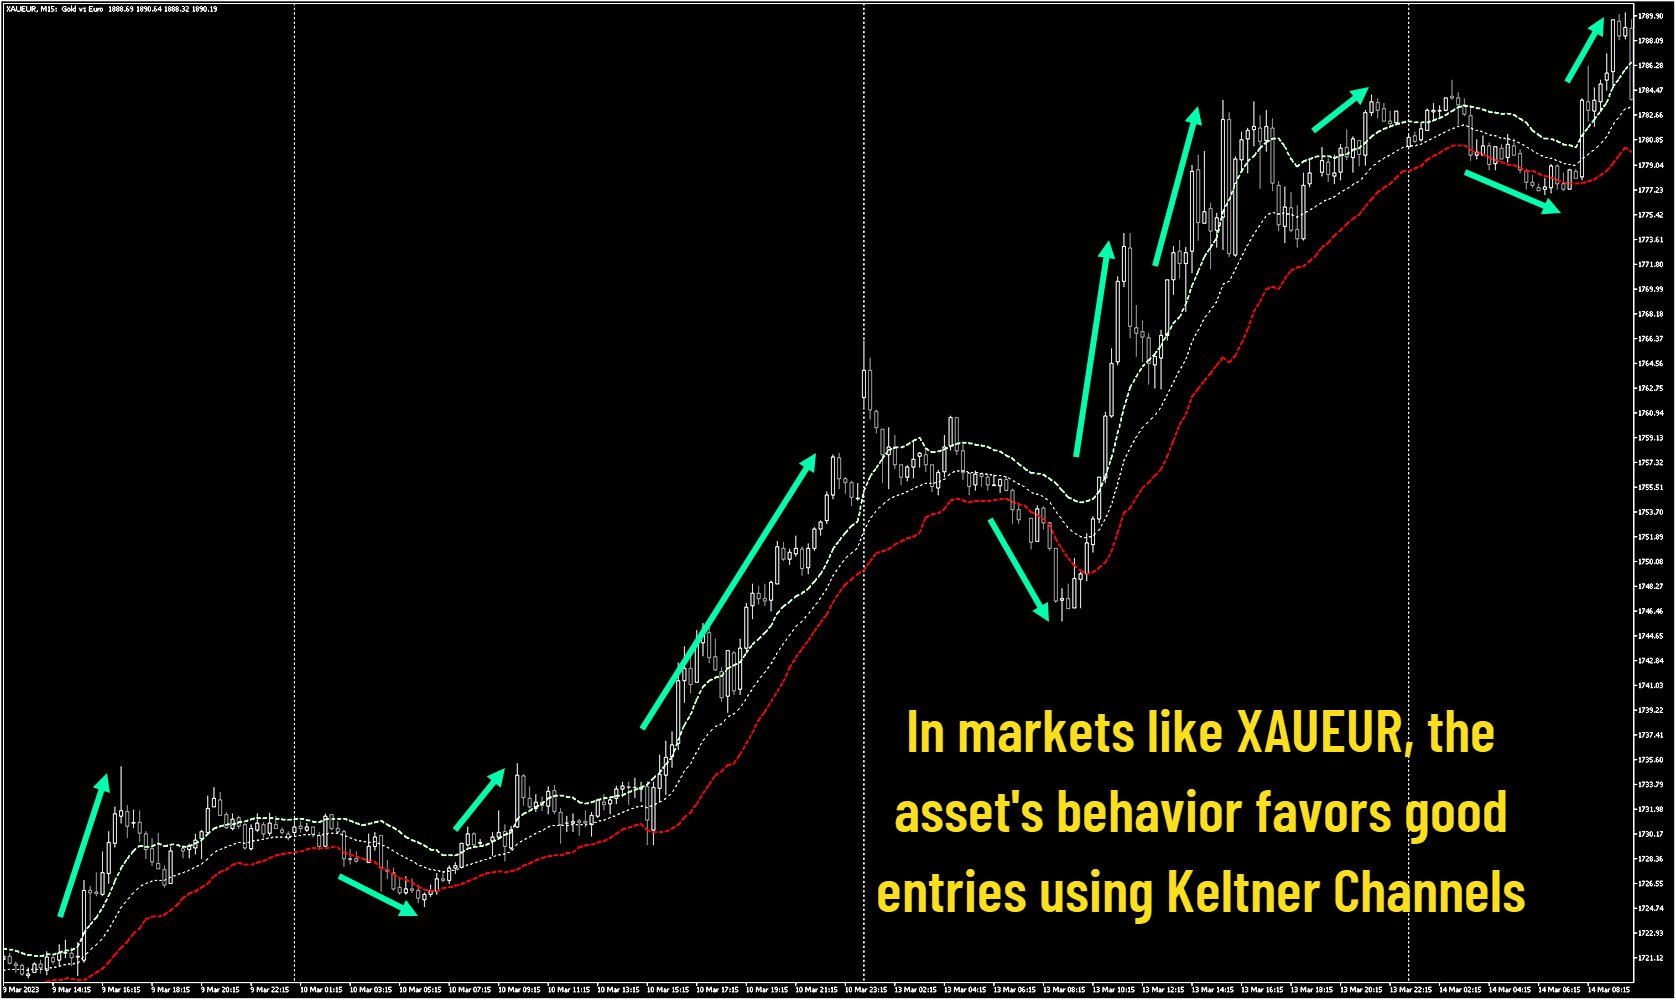
Durante una tendenza chiaramente definita, le condizioni di ipercomprato e ipervenduto possono indicare forza. In questo caso, la tendenza attuale si rafforzerebbe e alla fine continuerebbe. In un mercato laterale il funzionamento è un po' diverso. Quando il mercato è in una tendenza laterale, le letture di ipercomprato e ipervenduto sono spesso seguite da un movimento di ritorno del prezzo verso la media mobile (linea mediana).
Spero che vi sia utile per fare buone operazioni.

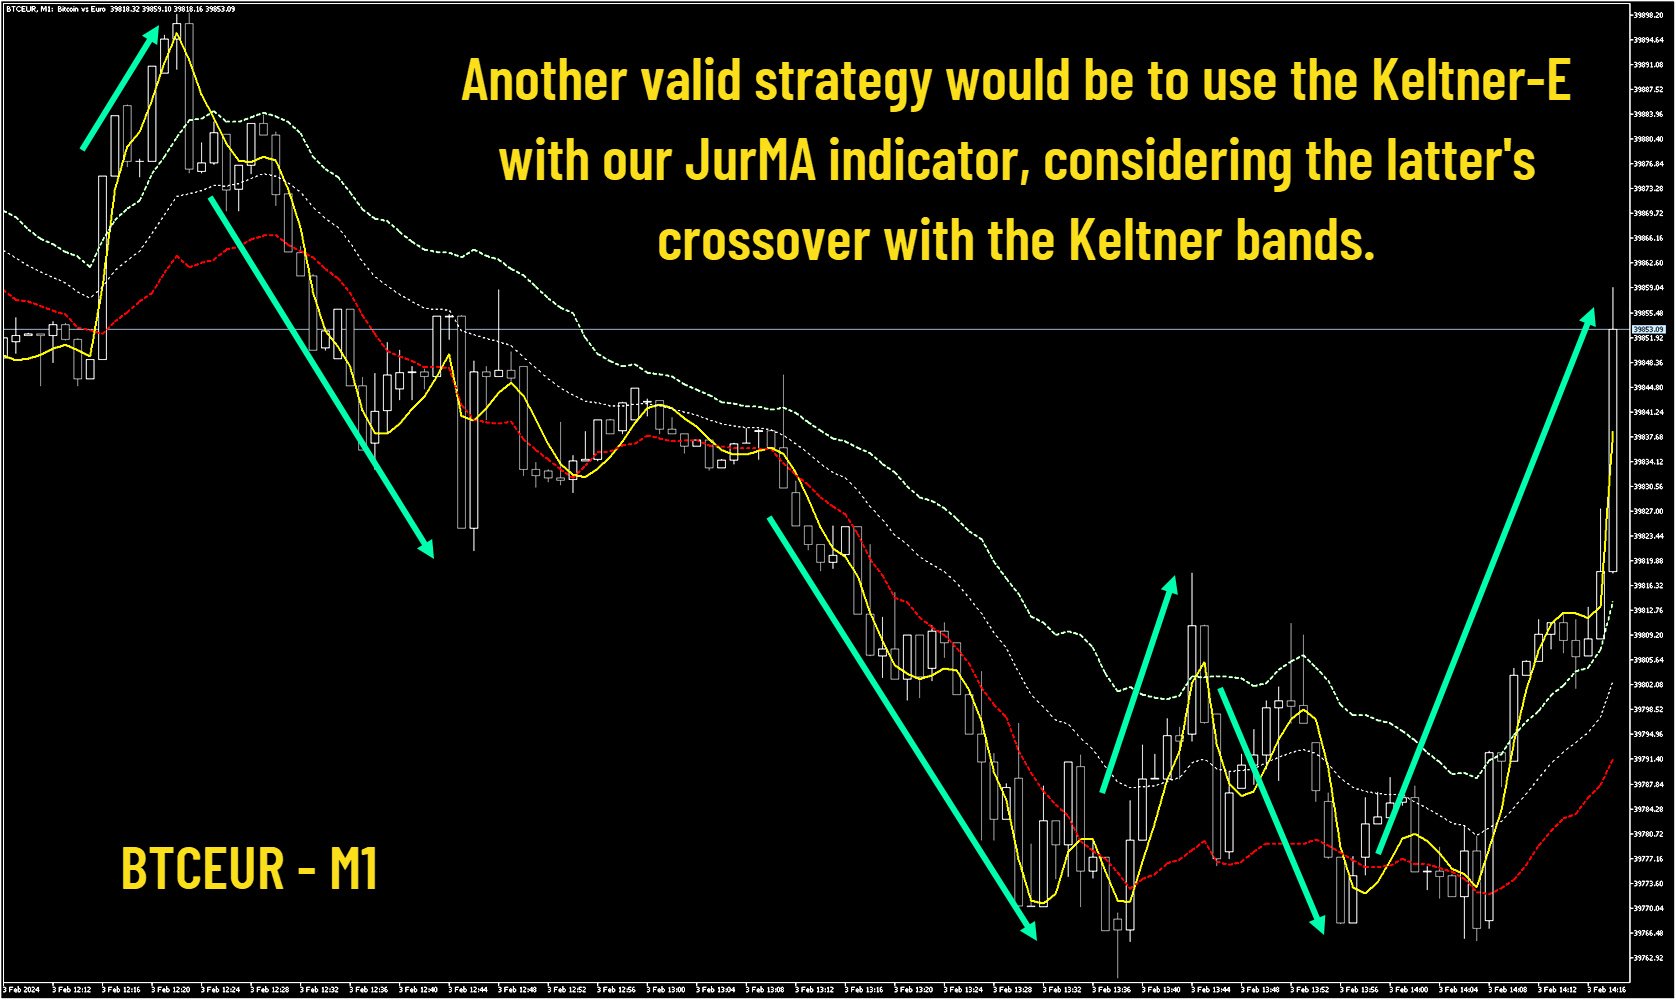

Excelente para tendencia... ainda mais se utilizado com uma media rapida para confirmar as entradas