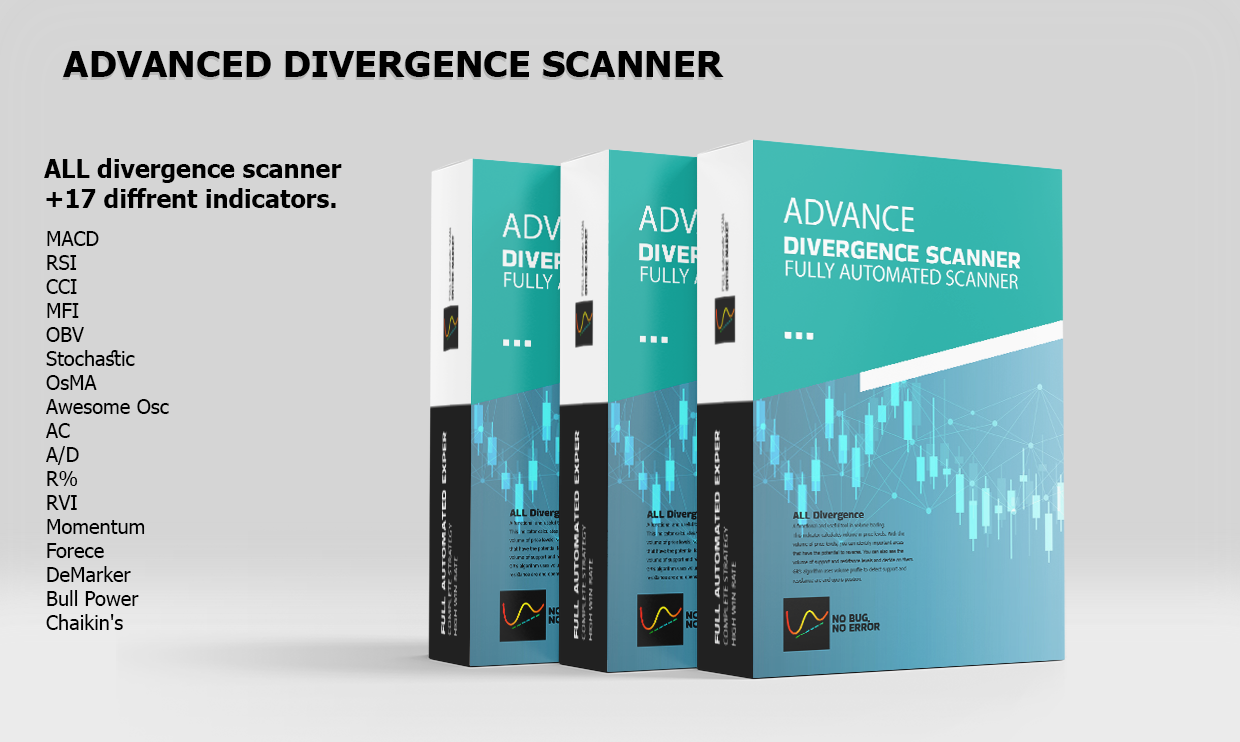
Advanced Divergence Scanner
- Göstergeler
- Mihails Babuskins
- Sürüm: 1.0
- Etkinleştirmeler: 19
- Contact me after payment to send you the user manual PDF file.
- Download the MT4 version here.
Unlocking Trading Insights
Dive into the heart of market dynamics with Advance Divergence Scanner designed for traders seeking a competitive edge. The Divergence Indicator is your key to identifying crucial divergences across various charts, empowering you to make informed decisions in the dynamic world of financial markets.
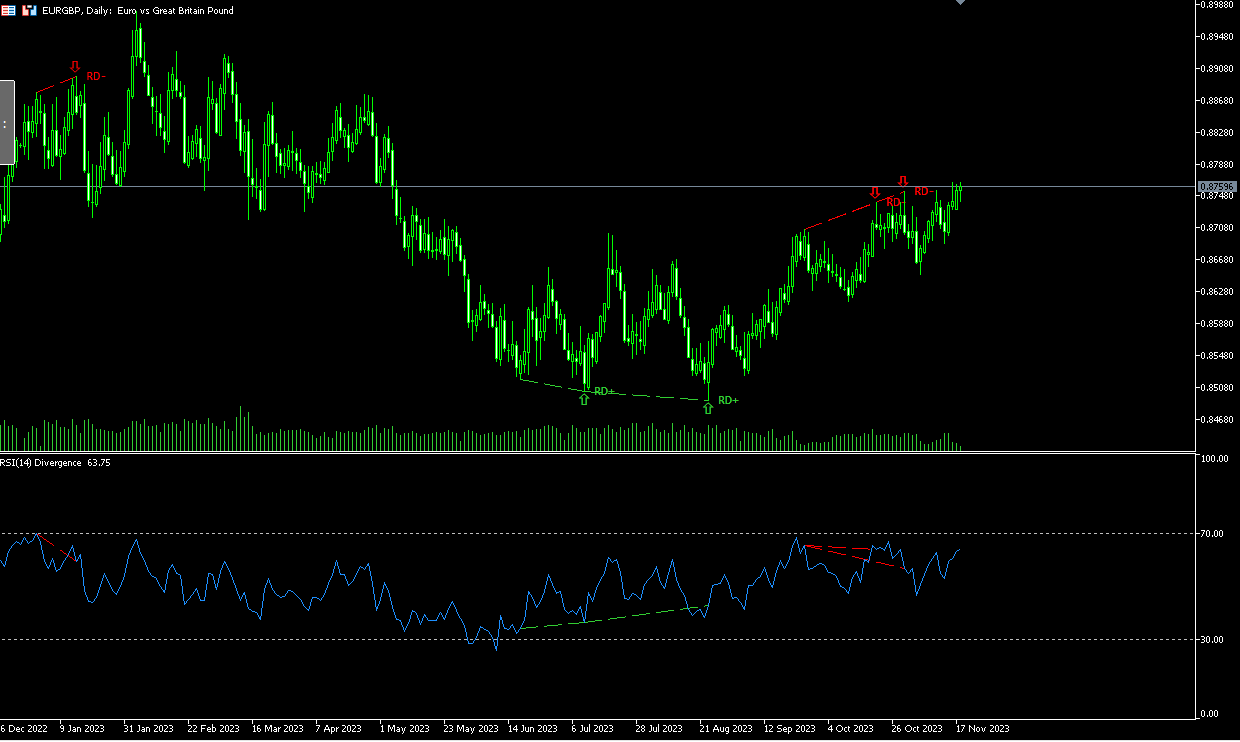
The Divergence
A Divergence signals a potential reversal point because directional momentum does not confirm the price. A bullish divergence occurs when the underlying security makes a lower low and CCI forms a higher low, which shows less downside momentum. A bearish divergence forms when the security records a higher high and CCI forms a lower high, which shows less upside momentum.
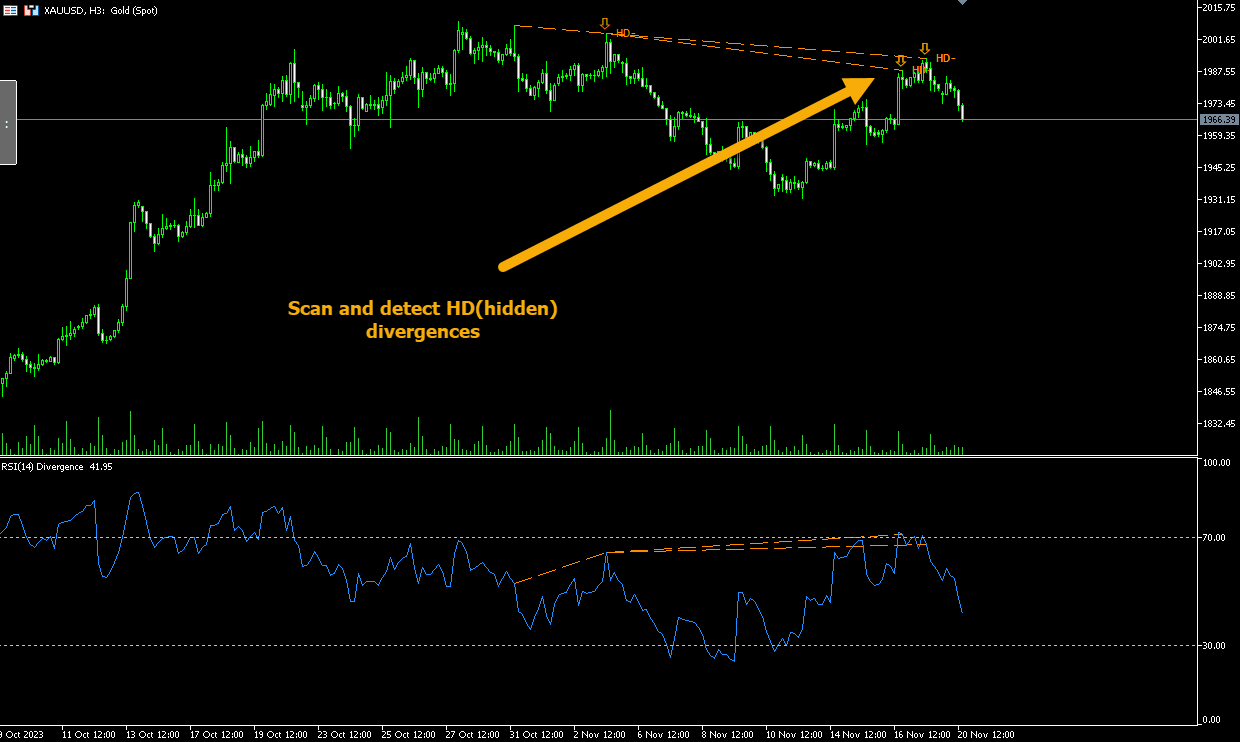
The indicator also finds hidden divergences (HD). Hidden divergences are created in the direction of the trend, and are often strong signals for the trading.
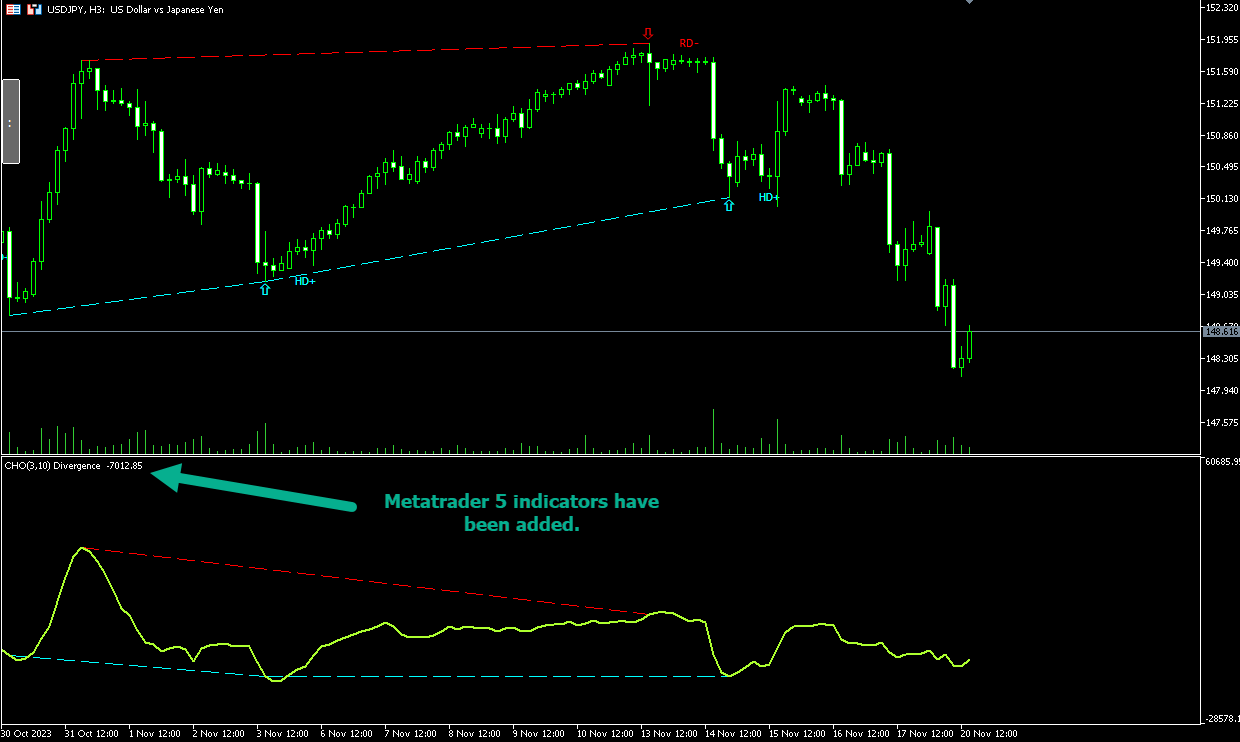
This indicator is very functional and can greatly improve the outcome of your trading.
How the indicator works?
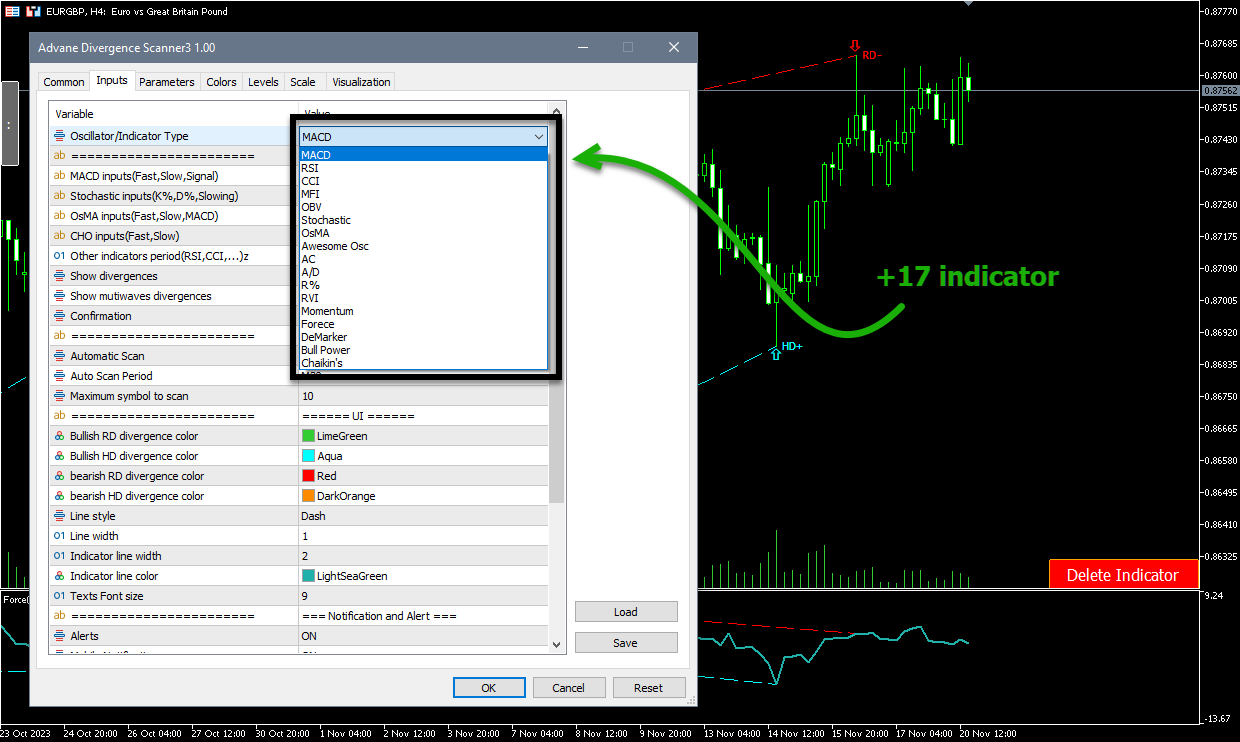
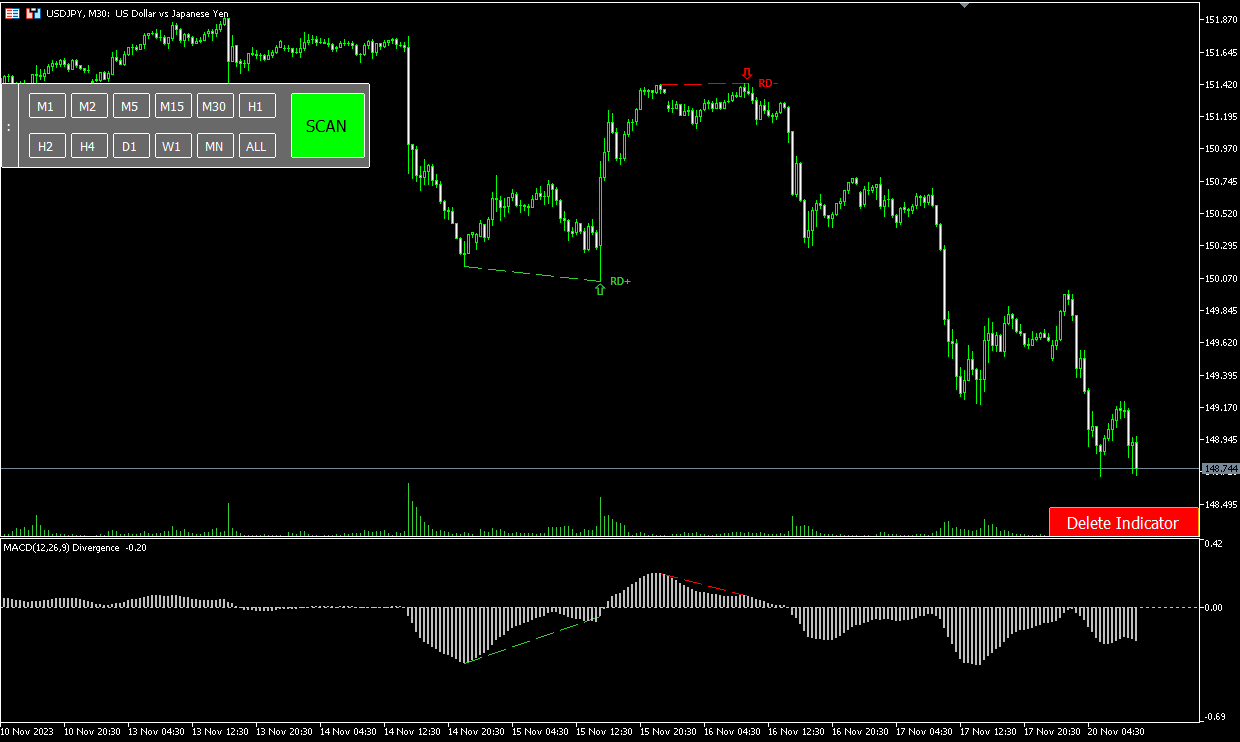
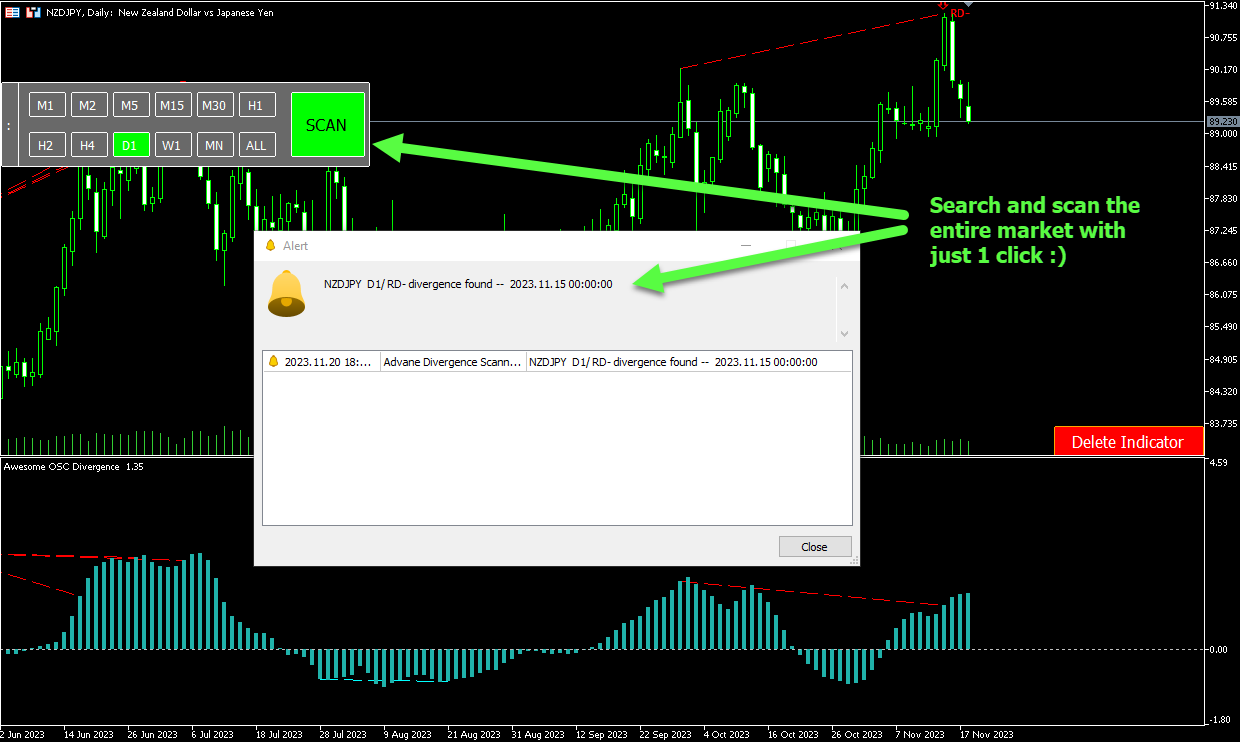
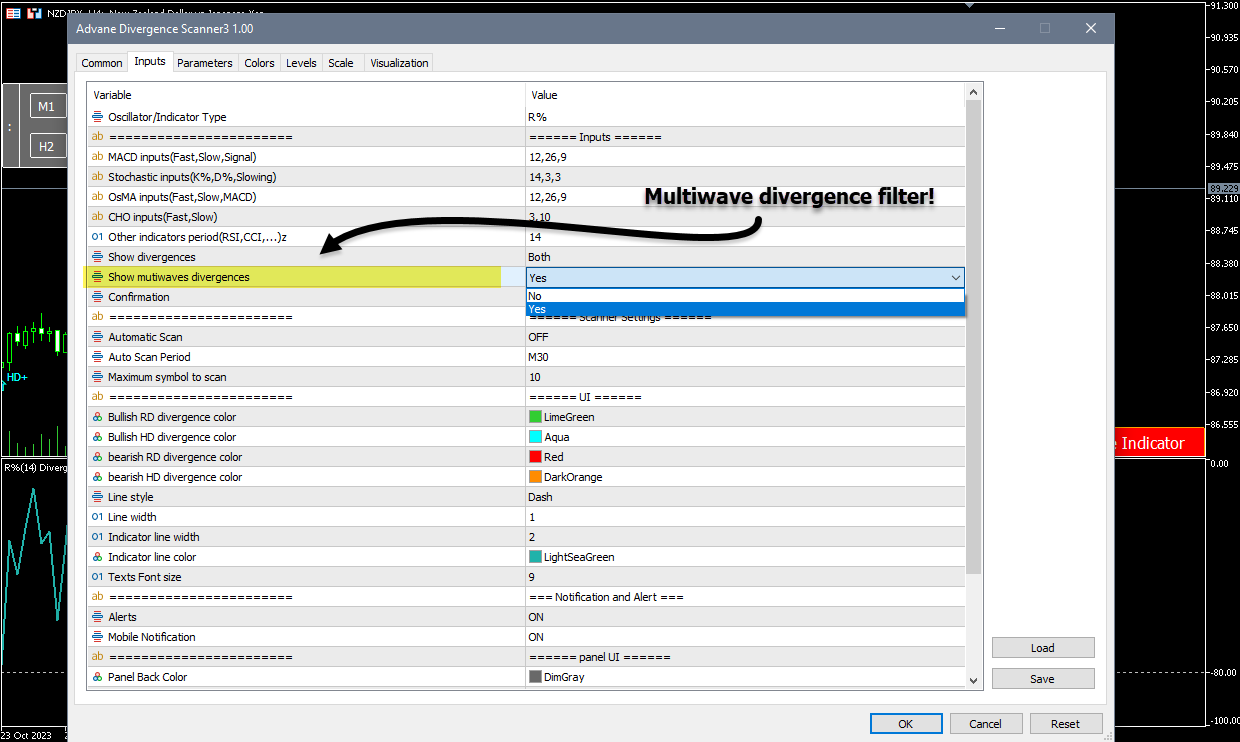
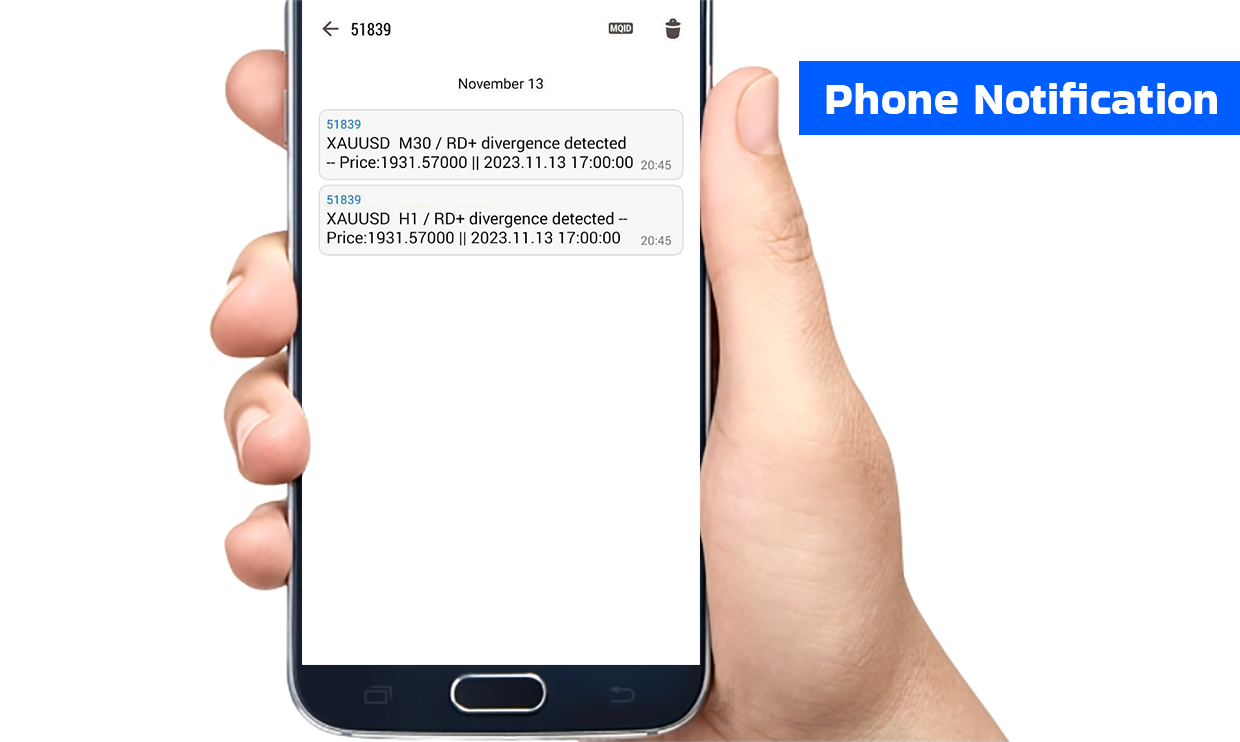
The Advanced Divergence Scanner empowers traders with precision and flexibility. Featuring a user-friendly panel, traders can tailor their experience by selecting specific timeframes for the indicator to scour for divergences. Whether you're eyeing short-term movements or long-term trends, the choice is yours. But the power doesn't stop there – the Advance Divergence Scanner takes it a step further by offering mobile notifications. Imagine being alerted on your phone when a lucrative divergence is detected. The scan operation seamlessly combines user customization with the convenience of timely notifications, ensuring that you stay in control and ahead of market shifts.
Capabilities:
- Not repainted.
- Automatic scanning of all charts and time frames in a few seconds
- Has a panel and a simple user interface to use
- Alert and send mobile phone notifications
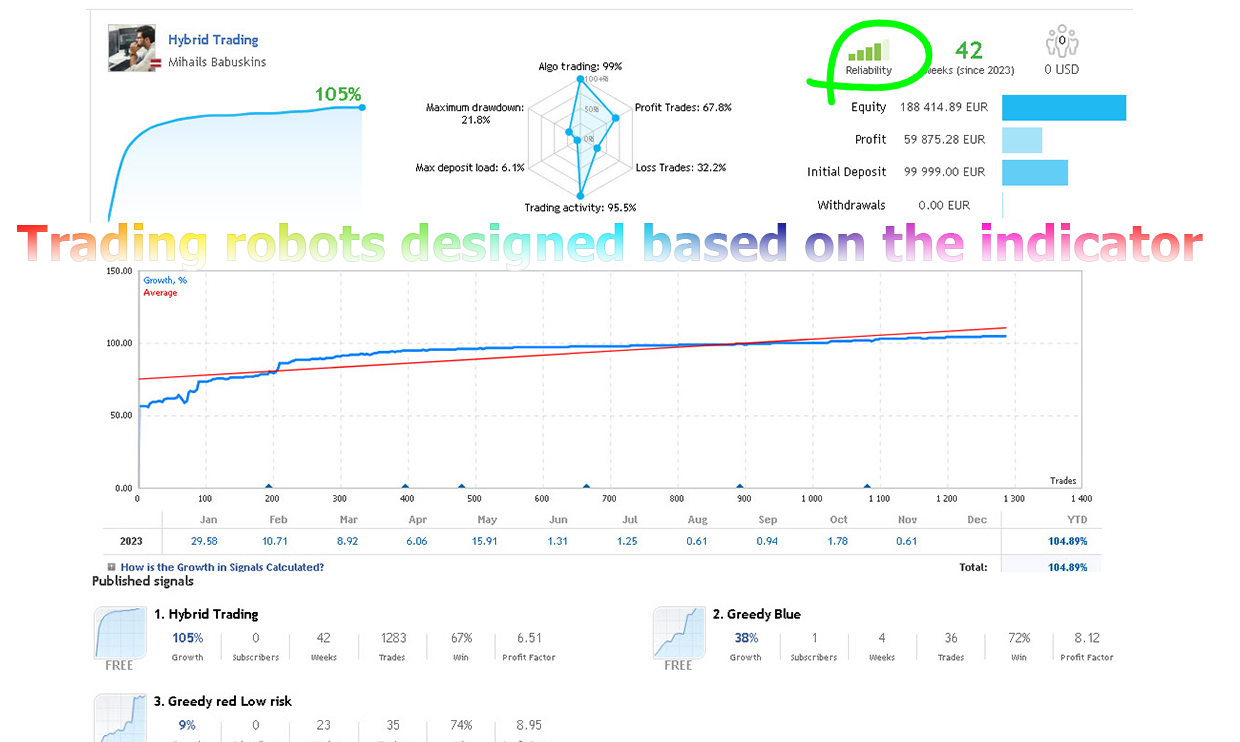
- Tested and in use on several trading robots