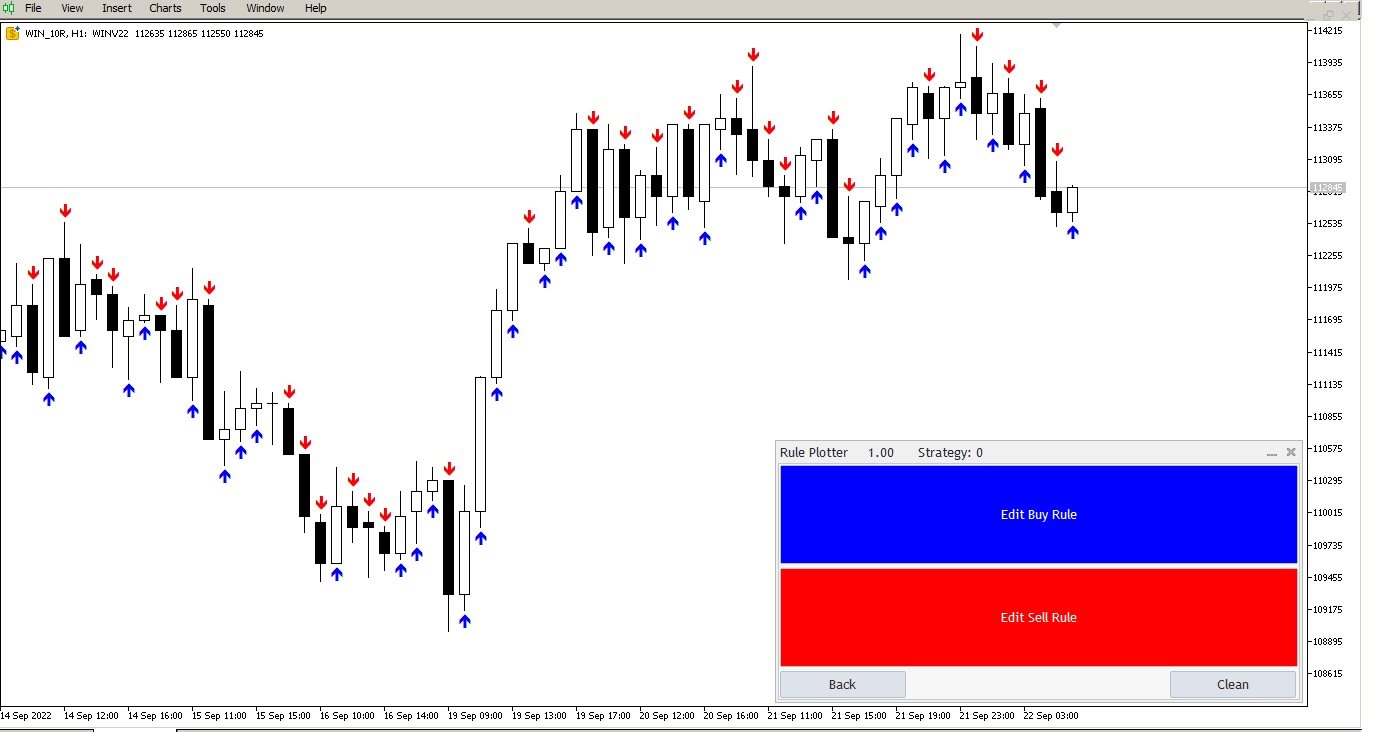
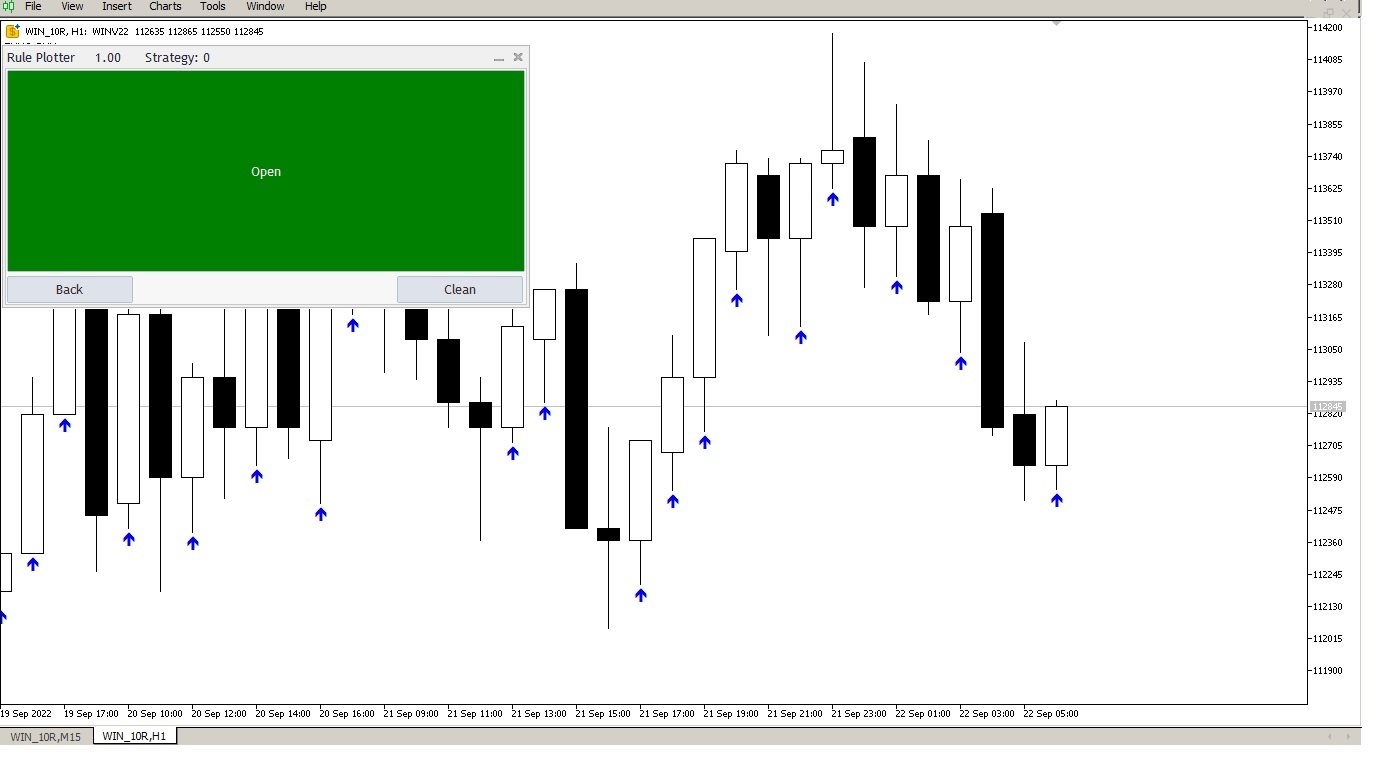
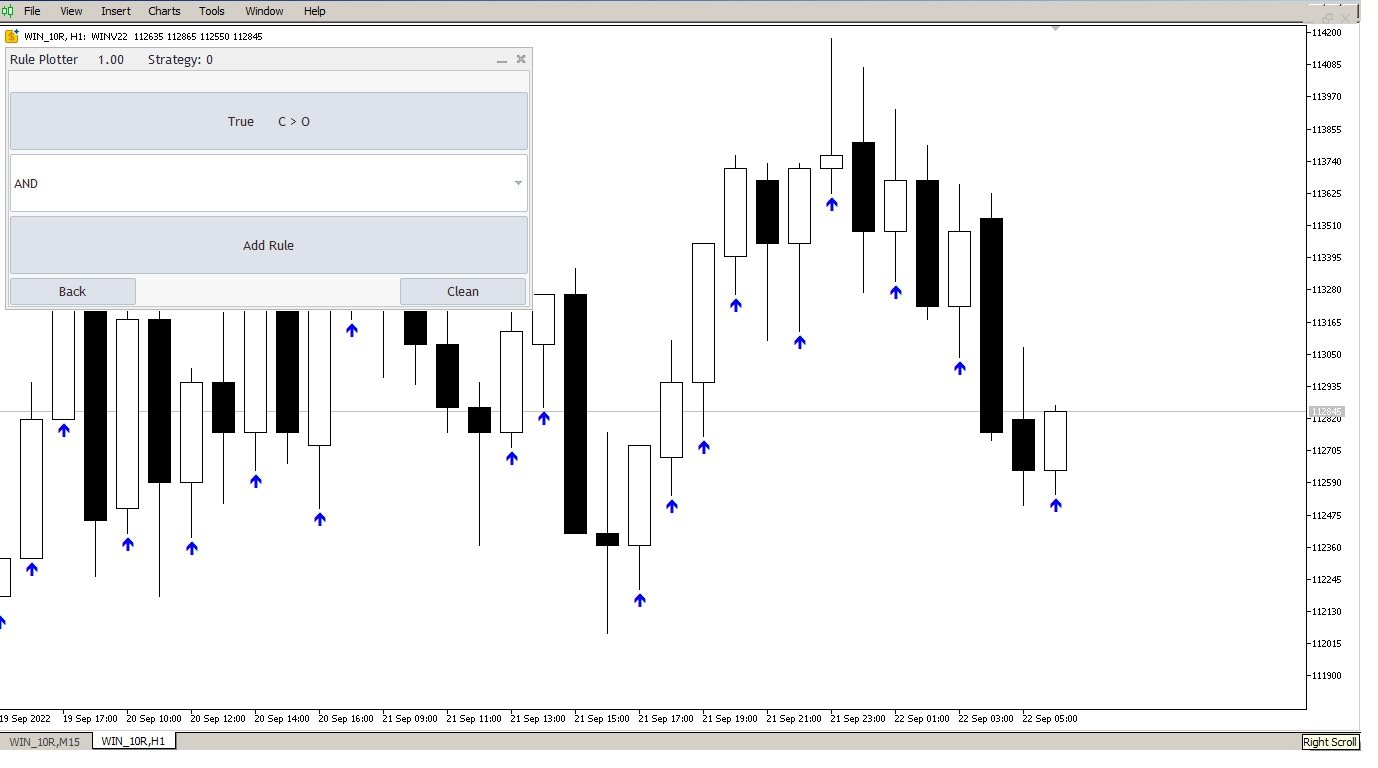
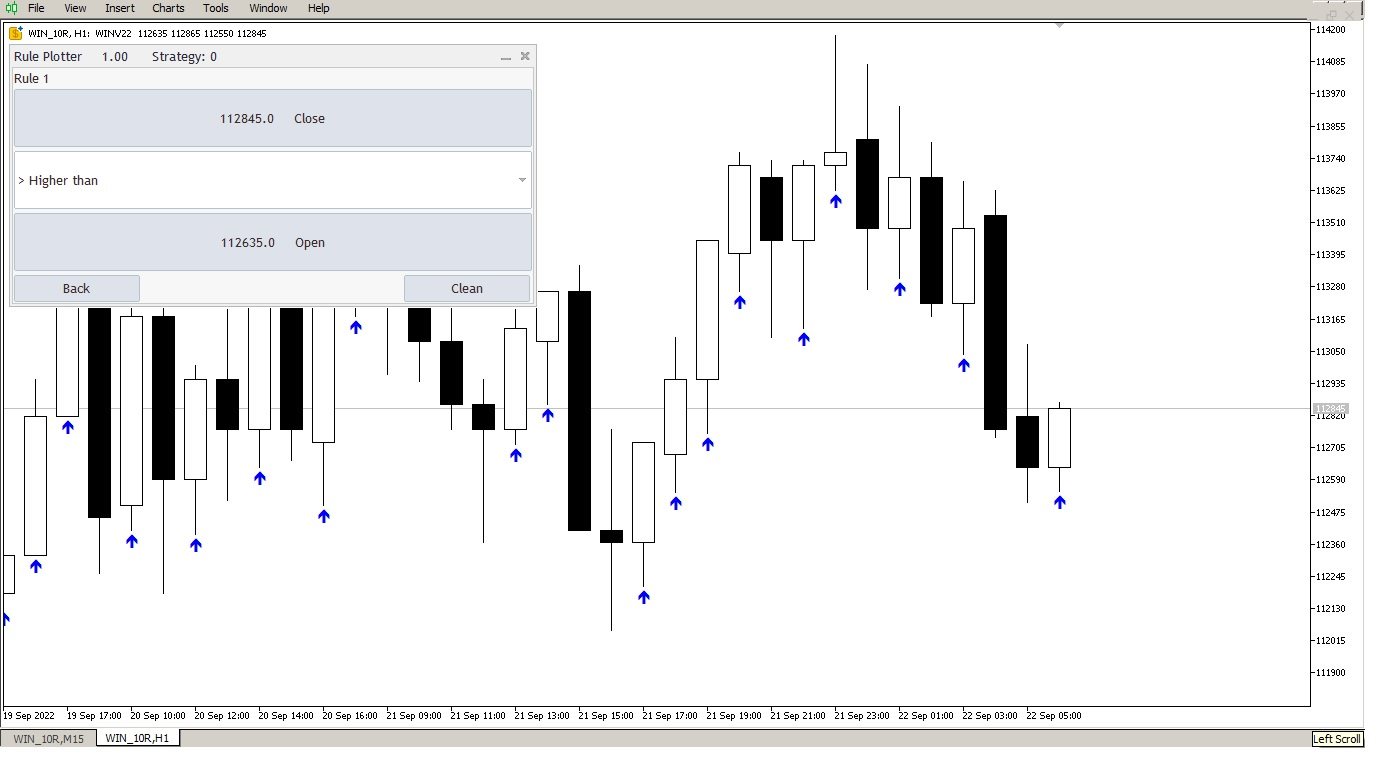
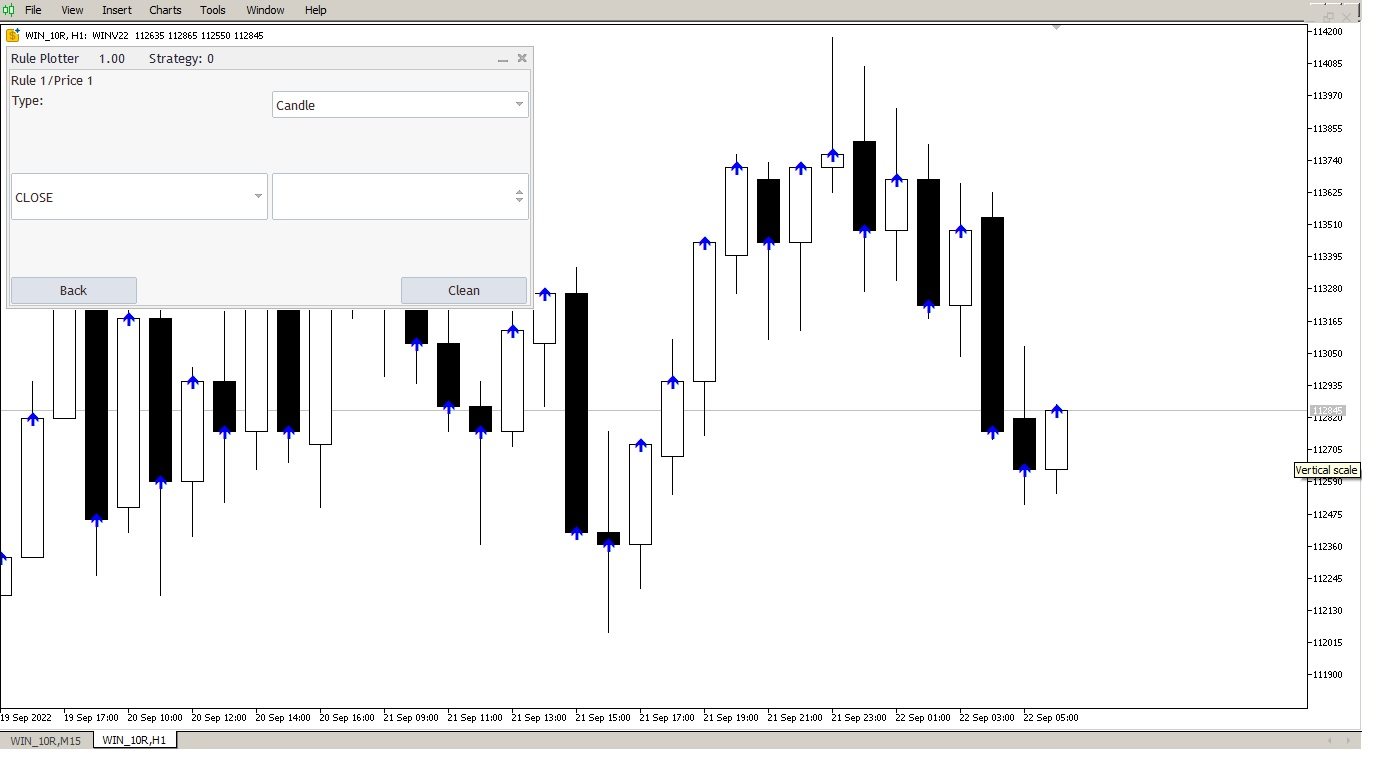
• Genel bakış
  • İncelemeler (4)
  • Yorumlar (1)
  • Yenilikler

Rule Plotter

5

Kendi Stratejinizi Kendiniz Oluşturun

Bu araç, MetaTrader'da doğal olarak kullanılabilen tüm göstergeleri ve internetten indirilen göstergeleri kullanarak stratejilerinizi geliştirmenizi sağlar. Bu göstergeler, verileri ekranda göstermek için bufferları kullanan göstergeleri içerir.

Bu araç, ticaret stratejilerinizi otomatikleştirmek için MetaTrader'ı düşünmeniz için başka bir neden sunar. Bu araç sayesinde, herhangi bir MetaTrader göstergesini kullanarak strateji sinyallerinizi basit ve sezgisel bir şekilde oluşturabilirsiniz.

İnternetten İndirilen Göstergimin Buffer Kullandığını Nasıl Anlarım?

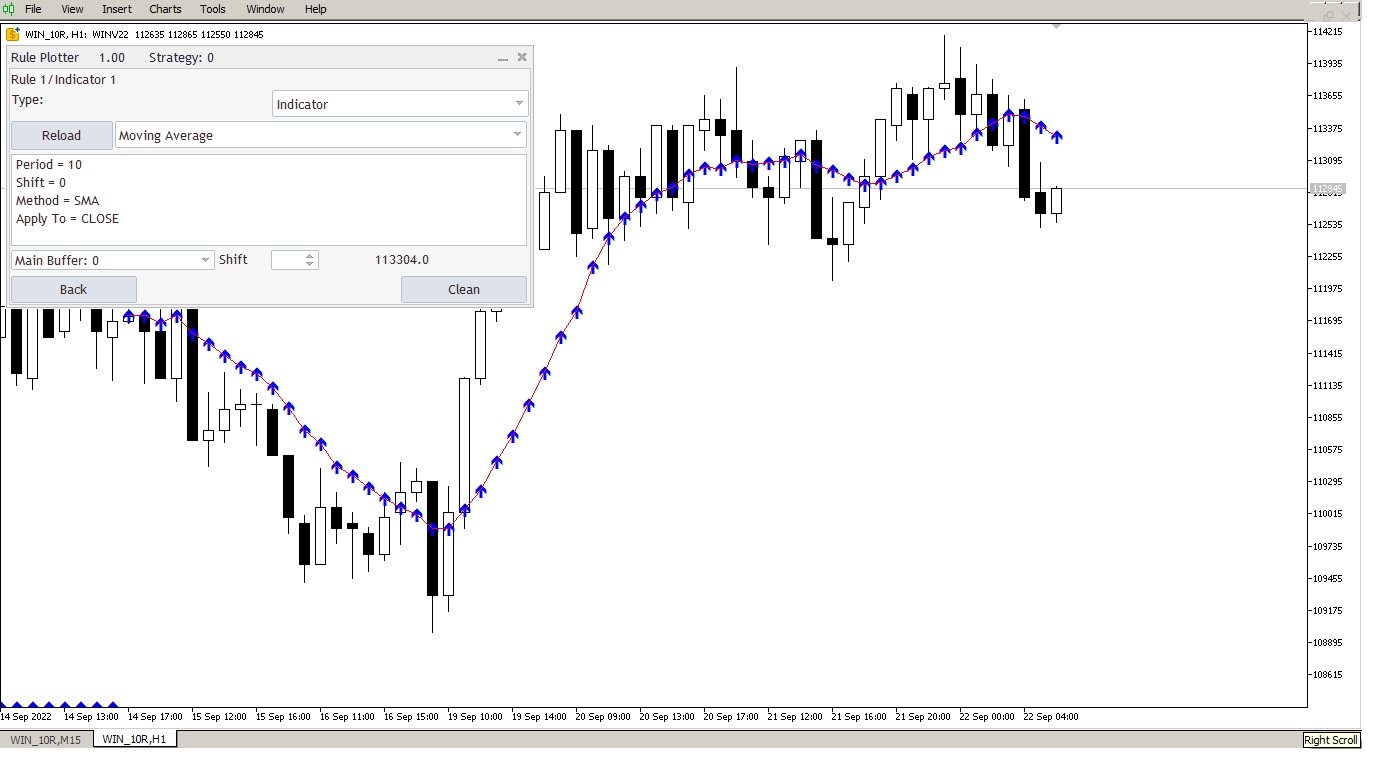
Çok basit, sadece bu aracı çalıştırın ve gösterginizin sahip olduğu tüm bufferları otomatik olarak keşfeder ve bunları kullanarak stratejilerinizi oluşturmanız için hemen kullanılabilir hale getirir.

Bu araç, göstergelerinizin bufferlere sahip olup olmadığını ve kaç veri bufferine sahip olduklarını otomatik olarak tanımlayabilir. Yapmanız gereken tek şey bufferları doğru değerlerle ilişkilendirmektir.

MetaTrader gibi doğal göstergeler, Hareketli Ortalama, RSI, Stokastik ve MACD gibi, zaten entegre edilmiş bufferlara sahip oldukları için kullanmaları son derece basittir. Ancak internetten indirilen özel göstergeler söz konusu olduğunda, hangi bufferin hangi veriye karşılık geldiğini bilmek önemlidir. Başlayalım.

MetaTrader'a Özgü Klavye Kısayollarını Kullanmayı Öğrenin:

Kısayol Açıklama
CTRL+F Fare üzerindeki nişangahı etkinleştirmek ve hangi mumu işaret ettiğinizi kesin bir şekilde belirlemek için.
CTRL+D Göstergelerin veri penceresini göstermek için.
CTRL++ Mumları yakınlaştırmak için.
CTRL+G MetaTrader grafiğinde ızgarayı göstermek için. Bu, grafik maksimum yakınlaştırma ile mükemmel bir şekilde çalışır, böylece bufferin hangi mumla ilişkili olduğunu tam olarak bilirsiniz.

Şimdi MetaTrader kısayollarına aşina olduğunuzdan, göstergenizin hangi buffer'a atıfta bulunduğunu belirlemek daha kolay olacaktır. Veri penceresi (CTRL+D) açıkken, verileri her bir buffer ile kolayca ilişkilendirebilirsiniz.

İlk başta karmaşık gibi görünebilir, ancak bufferları ve değerleri ilişkilendirme konusunda sabırlı olursanız, internet göstergelerinin tüm bufferları, renk bufferları ve gösterge hesaplama bufferları da dahil olmak üzere tüm bufferlarla çalışabilirsiniz.

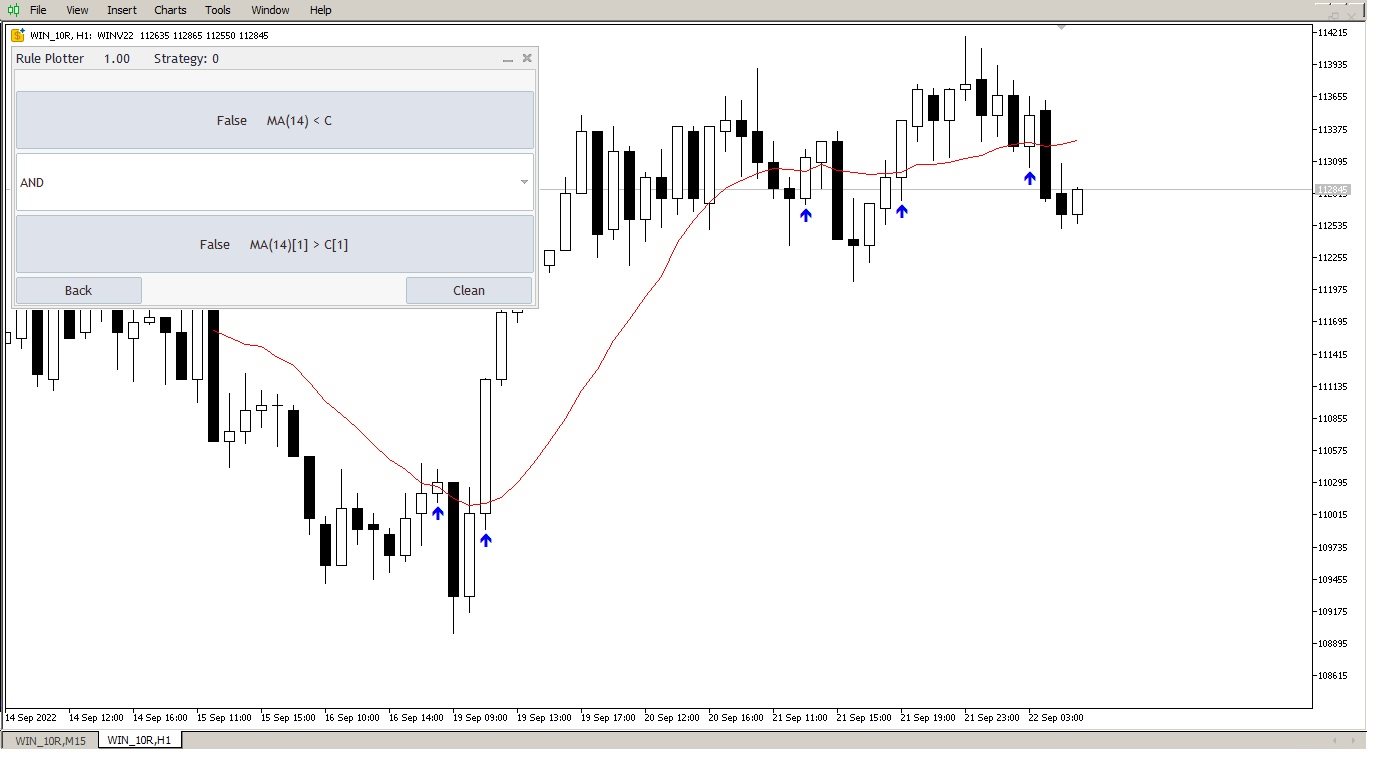
Göstergelerin Renklerine Dayalı Stratejiler Oluşturun

Renk bufferlarını veya gizli hesaplamaları keşfetmek her zaman zor bir görev olmuştur ve en kolay yol geliştiriciyle iletişim kurmaktı. Ancak şimdi sadece buffer numarasını ekranda gördüğünüz renkle ilişkilendirmeniz ve gösterge renklerine dayalı stratejiler oluşturmanız gerekiyor.

Nesne Göstergelerinden Bufferlara Dönüşüm

Şu anda sadece verileri buffer formatında sunan göstergelere uyumluluk sağlıyoruz. Verileri nesnelerle sunan göstergelere henüz uyumluluğumuz yok. Ancak endişelenmeyin, çoğu MetaTrader göstergesi bufferları kullanmak amacıyla oluşturulur çünkü Uzmanlar göstergi verilerine bufferlar aracılığıyla erişirler.

Ancak gerçekten favori göstergenizin verilerini nesneler yerine buffer formatında sahip olmasını isterseniz, sadece bu göstergeleri dönüştürmek için serbest meslek profesyonellerinden birini kiralamak mümkün olacaktır ve bu göstergeler burada çalışmaya başlayacaktır.

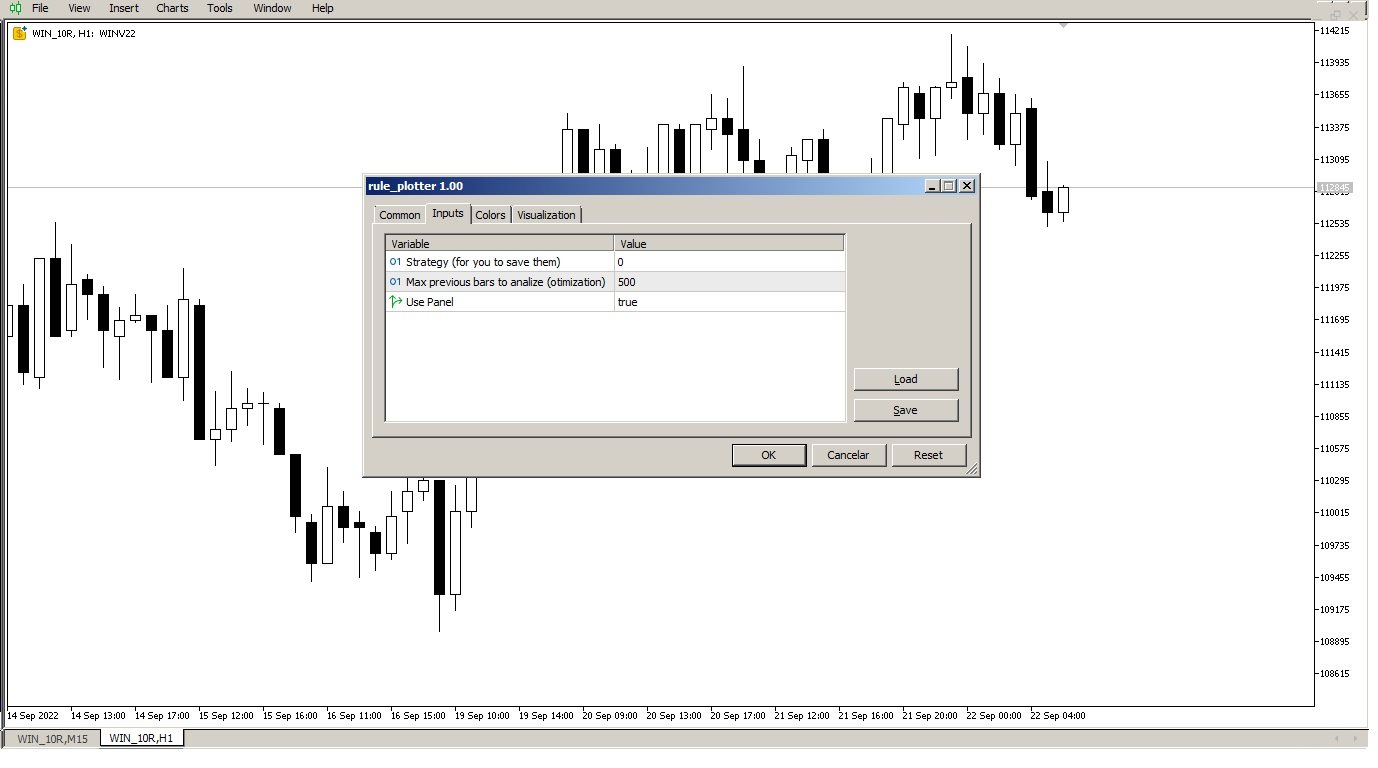
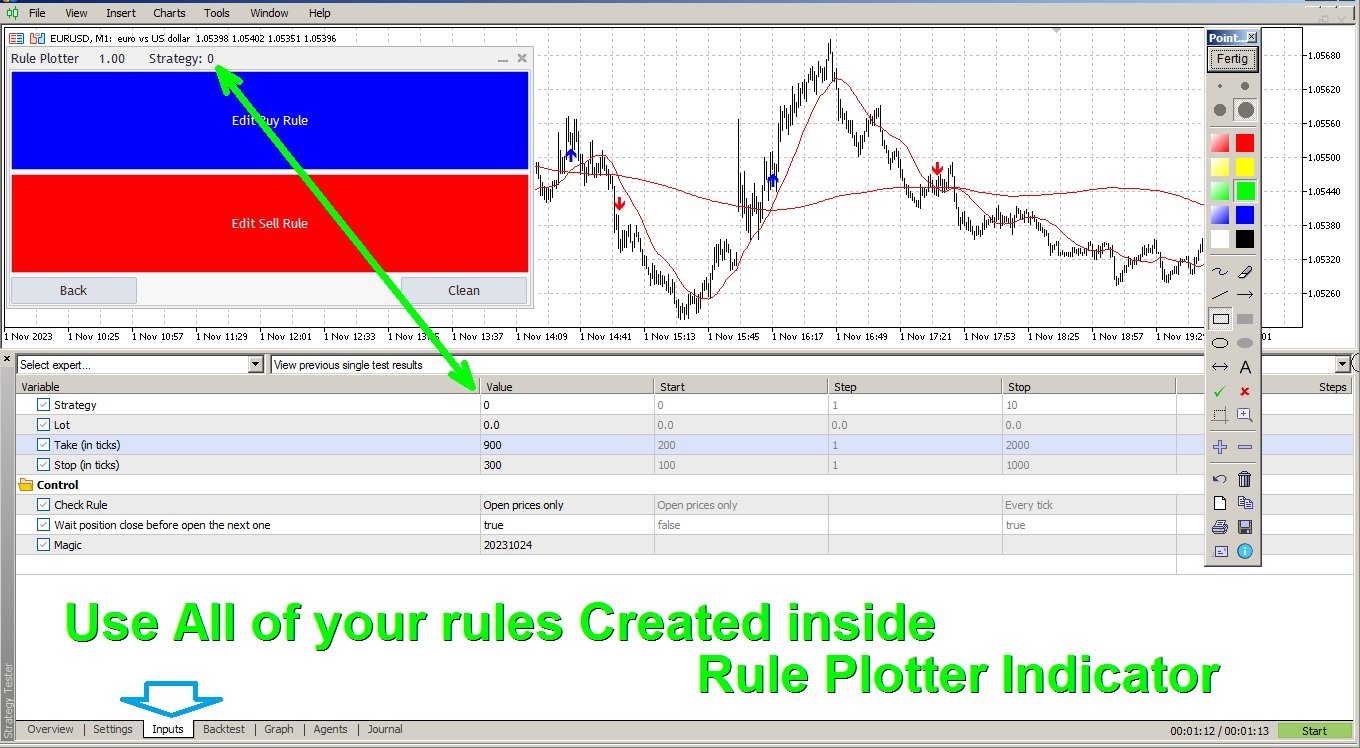
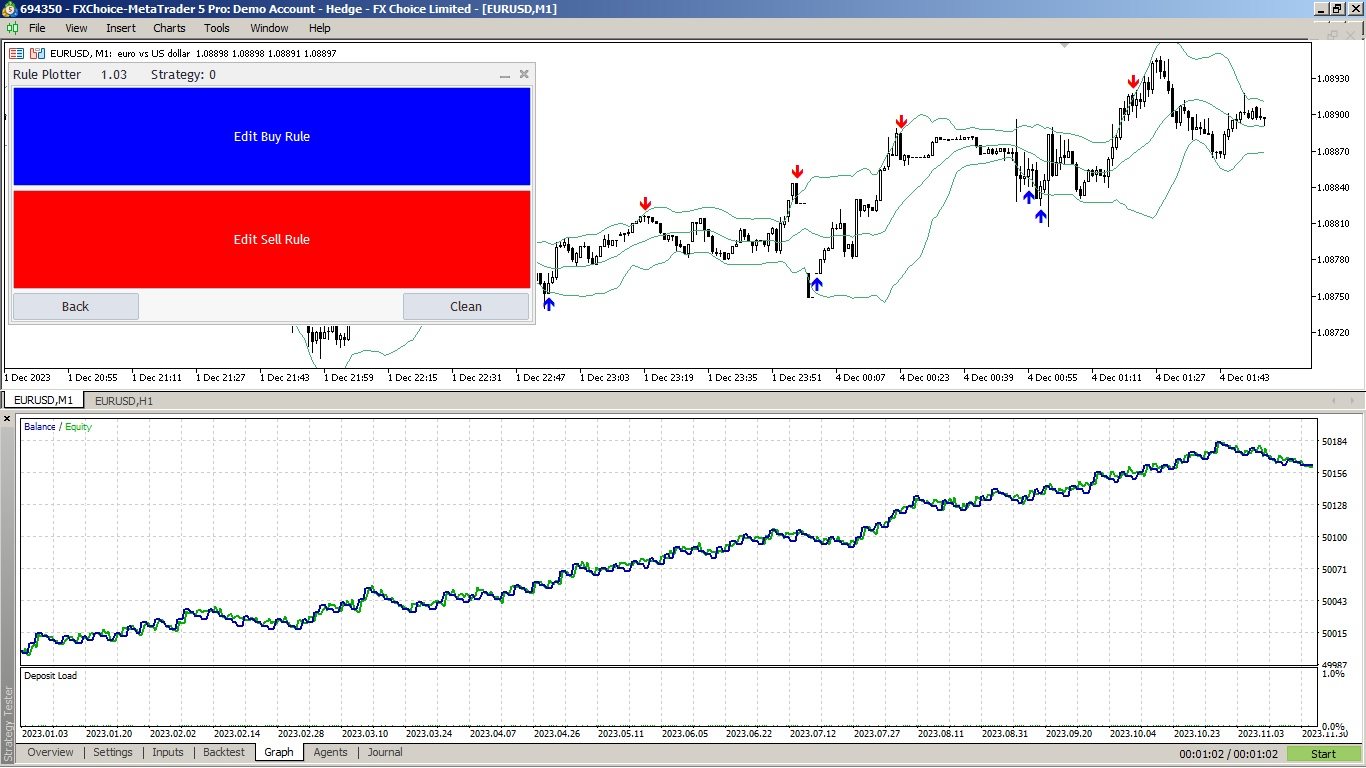
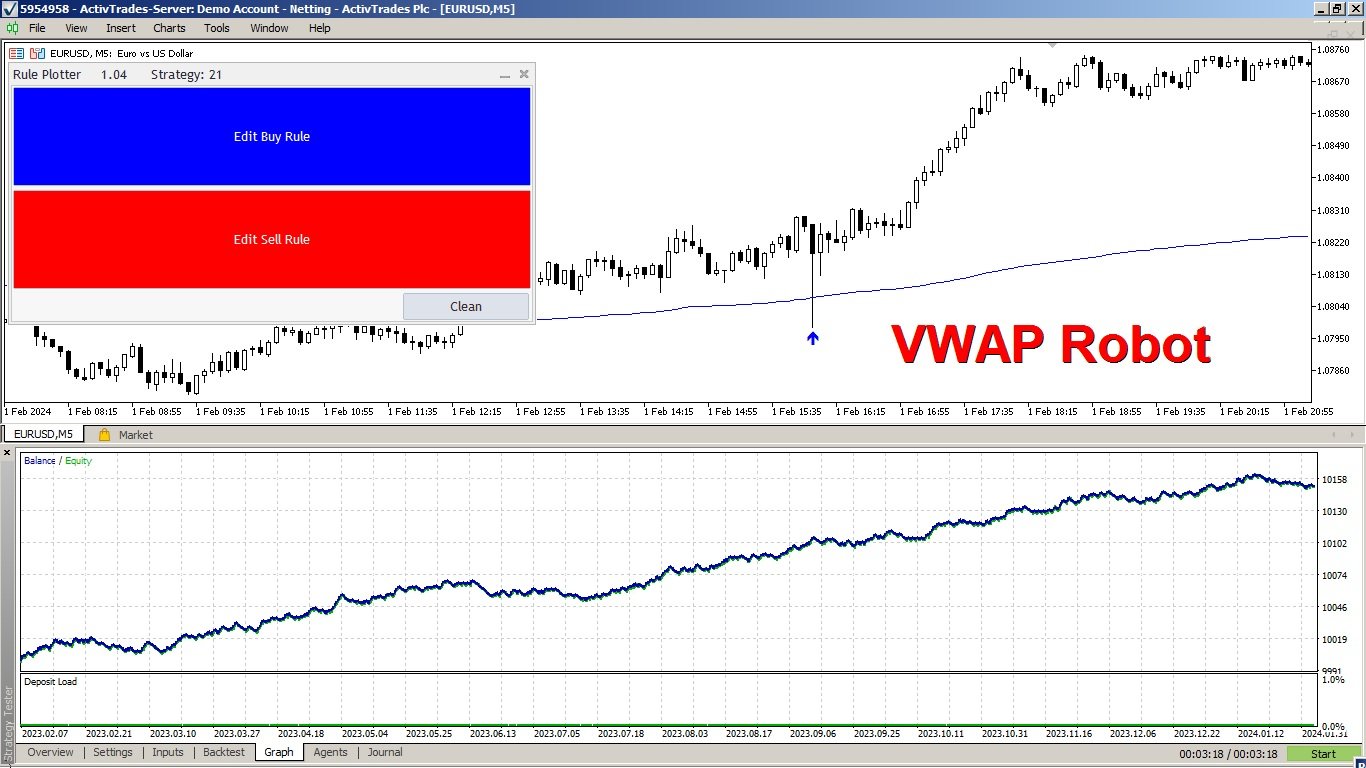
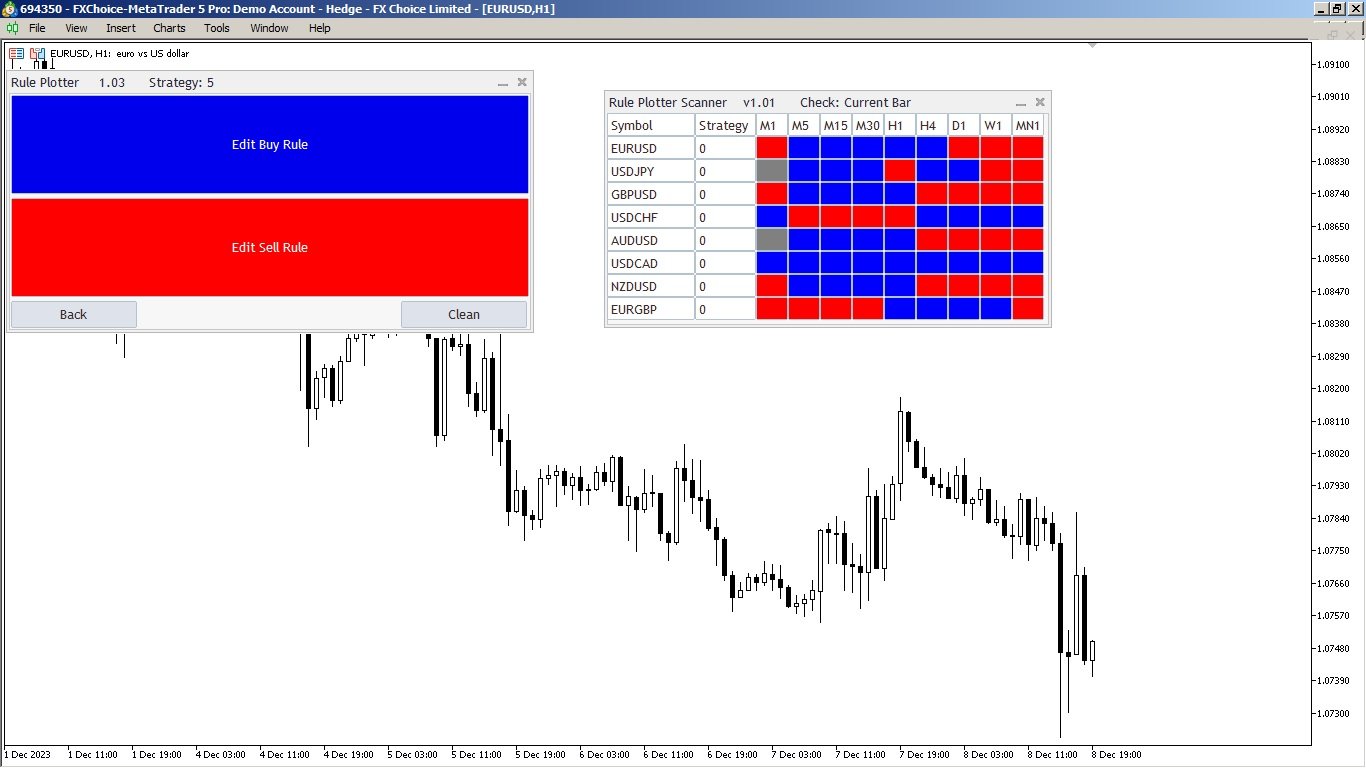
İstediğiniz Kadar Strateji Oluşturun.

Araçlarımız size varsayılan strateji (numara 0) gibi numaralarla stratejileri kurmanıza olanak tanır, ancak numara 1, 2, 3, 4 ve sonrasındaki diğer stratejileri kaydedebilirsiniz. Tek bir strateji ile sınırlamayın. Kendi kişisel strateji tabanınızı oluştururken eğlenin.

Hemen başlayabilirsiniz ve stratejileriniz, hala geliştirmekte olduğumuz bir Uzman Danışman içinde kullanılacaktır. Bu nedenle sizi MetaTrader'ın muhteşem strateji test programında oluşturduğunuz tüm stratejileri kullanmanıza olanak tanıyan Uzman Danışmanın piyasaya sürülmesi hakkında bilgilendirmek isteriz.


Yorumlarda bu aracın kullanımının kolay mı yoksa zor mu olduğunu bana bildirin.

Profilime giden bağlantı: Rule Plotter Geliştiricisi Francisco Gomes.

Rule Plotter Expert kullanarak stratejinizi strateji test cihazında test edin

İncelemeler 4
Elsier Jimenez
36
Elsier Jimenez 2024.04.07 23:29 
 

Excelente herramienta para automatizar una estrategia. Felicitaciones al desarrollador.

Moeen Ghiyas
299
Moeen Ghiyas 2024.03.10 09:30 
 

It's an excellent indicator, though difficult to understand initially as it took me a few days to comprehend. Anyhow your effort and idea are highly appreciated. ...... It needs little improvement as at present it does not provide nesting (use of parenthesis within rules for logical AND /OR operations), the same is available in Math Operation but misses logical AND / OR operation there as well. Suggested improvement will make it awesome, but I will still give it 5-star rating based on your idea and effort.

MickeBo
120
MickeBo 2024.03.02 19:35 
 

I highly recommend this tool and I'm glad to be able to use it! The purpose of this tool is to enter and save an existing strategy in order to then receive current entry signals in the form of arrows during operation according to the parameters I previously entered. It took me a while at the beginning to understand how to enter the parameters and I had a lot of help from Francisco, thank you very much for that! Once everything was entered and saved, everything worked perfectly. I receive entry arrows according to my strategy and I am very happy about this as it makes trading much clearer and easier for me. I don't want to miss it anymore, a really great tool that's worth trying. It is also possible to do a backtest with the saved parameters using the Rule Plotter EA and thus test the entered strategy - what more could you want? I can also highly recommend Francisco, his programming is flawless, he is very helpful and patient and I will always be happy to come back to him if there is a need for an indicator or an EA. Thank you, Francisco, for everything!!

Önerilen ürünler
General Clock
Fernando Lahude Ritter
A Simple clock that on the left side "Time" shows r espectively the TimeCurrent, followed beneath by the TimeLocal. On the right hand side we have the remaining minutes and seconds of the current candle. TimeLocal is synced every 500 miliseconds however, the TimeCurrent and the time left on the candle are synced every tick, so this can lead to inconsistencies on the readings so keep that in mind. This indicator have no plots or buffers so it cannot be used in any time based EA.
FREE
Nyse Usdxy
Mitchell Dean Ede
Displays a USD DXY chart in a seperate window below the main chart. YOUR BROKER MUST HAVE THESE SYMBOLS FOR THE INDICATOR TO WORK Based on EUR/USD, USD/JPY, GBP/USD, USD/CAD, USD/CHF and USD/SEK All these pairs must be added to Market Watch for the indicator to work correctly As this is calculated using a formula based on the 6 pairs it will only work when the market is open. YOUR BROKER MUST HAVE THESE SYMBOLS FOR THE INDICATOR TO WORK Displays a USD DXY chart in a seperate window below the
FREE
Color Trend
Bruno Goncalves Mascarenhas
Combining the best of Price Action , Directional Movement , and Divergence / Convergence analysis, the Candle Color Trend is the easy and reliable way to identify the direction of the trend. The indicator automatically paints the candles according to the premise that the upward trend is defined by prices that form a series of ascending tops and bottoms. On the other hand, the downward trend is defined by prices that form a series of descending tops and bottoms. Color Trend is certainly one
FREE
Standard PVSR
Ashok Kumar Singha
Standard PVSR is based on Pivot Points. Steps to Setup the Indicator: Install the Custom Indicator; Set all the Lines Color, Width and Styles; Set visualization to All Timeframe; and DONE It can be used for: All Pairs: Forex, Cryptocurrencies, Metals, Stocks, Indices etc. All Timeframe All Brokers All type of Trading Style like Scalping, Swing, Intraday, Short-Term, Long-Term etc. Multiple Chart -->> For any Type of Support, Guidance, Setup Issue, EA Optimization, Input Setup etc.
FREE
This indicator uses a different approach from the previous version to get it's trendlines. This method is derived from Orchard Forex, and the process of making the indicator is demonstrated in there video   https://www.youtube.com/watch?v=mEaiurw56wY&t=1425s . The basic idea behind this indicator is it draws a   tangent line   on the highest levels and lowest levels of the bars used for calculation, while ensuring that the lines don't intersect with the bars in review (alittle confusing? I kno
FREE
The indicator is designed for displaying the following price levels on the chart: Previous day's high and low. Previous week's high and low. Previous month's high and low. Each of the level types is customizable. In the indicator settings, you set line style, line color, enable or disable separate levels. Configurations ----Day------------------------------------------------- DayLevels   - enable/disable previous day's levels. WidthDayLines   - line width of daily levels. ColorDayLines   - lin
FREE
Trend Yakalayıcı: Alarm İndikatörü ile Trend Yakalayıcı Stratejisi, piyasa trendlerini ve potansiyel giriş ve çıkış noktalarını belirlemede yardımcı olan çok yönlü bir teknik analiz aracıdır. Piyasa koşullarına uyum sağlayarak trend yönünün net görsel temsili için dinamik bir Trend Yakalayıcı Stratejisi sunar. Tüccarlar tercihlerine ve risk toleranslarına göre parametreleri özelleştirebilirler. Gösterge, trendleri tanımlamaya yardımcı olur, potansiyel ters dönüşleri sinyaller, trailing stop m
FREE
This Mt5 Indicator Signals when there is two opposite direction bars engulfed by current bar.  has a recent Exponential Moving Average Cross and past bar was oversold/bought Expert Advisor Available in Comments  Free Version Here : https://www.mql5.com/en/market/product/110114?source=Site&nbsp ; Full Alerts for mt5 terminal , phone , email, print to file, print to journal  Buy Signal ( blue line ) Past ema cross ( set at 30 bars back ) Past bar rsi is oversold ( level 40  ) Engulfing bar closes
FREE
"Hunttern harmonic pattern finder" base on the dynamic zigzag with the notification and prediction mode This version of the indicator identifies 11 harmonic patterns and predicts them in real-time before they are completely formed. It offers the ability to calculate the error rate of Zigzag patterns depending on a risk threshold. It moreover sends out a notification once the pattern is complete. The supported patterns: ABCD BAT ALT BAT BUTTERFLY GARTLEY CRAB DEEP CRAB CYPHER SHARK THREE
FREE
Sessions are very important in trading and often good area where to look for setup. In SMC, ICT we will look for Asian session to serve as liquidity This indicator displays: High & Low of the Asia session Midnight New York time opening line Congifuration Line Style, color Label position, size, color Start of the level (Start of the day, Start of the session, Highest or Lowest point in the session) Any questions or comments, send me a direct message here  https://www.mql5.com/en/users/mvonl
FREE
HammerStar
Arismario Verissimo Neves
3.14 (7)
The HammerStar indicator is designed to search for the Hammer and Shooting Star patterns on charts of any currency pairs. Hammer Downward trend. The lower shadow is not less than 2 and no more than 3 times larger than the body. There is no upper shadow, or it is very short (no more than 10% of the candlestick range). The color of the body in the long game is not important, with the short - white hammer is much stronger than the black one. Confirmation is suggested. Shooting Star Uptrend.
FREE
The technical indicator Trend Strength Analyzer measures the deviation of the price of an instrument from average values ​​over a specific period of time. A comparative analysis of the relative strength of bulls and bears underlies the indicator. If bulls prevail, an upward trend. If bears are stronger - a downward trend.      Settings: Strike Energy (2 solid lines) = 14. Influence Power (2 dotted lines) = 50. The TSA oscillator is effective in an active market. The most commonly used indica
FREE
The idea of the system is to indentify the reversal patterns using the calculation of the composite candle. The reversal patterns is similar to the "Hammer" and "Hanging Man" patterns in Japanese candlestick analysis. But it uses the composite candle instead the single candle and doesn't need the small body of the composite candle to confirm the reversal. Input parameters: Range - maximal number of bars, used in the calculation of the composite candle. Minimum - minimal size of the composite can
FREE
Dark Bands MT5
Marco Solito
4.88 (191)
Dark Bands   is an Indicator for intraday trading. This Indicator is based on Counter Trend  strategy but use also Volatility. We can enter in good price with this Indicator, in order to follow the inversions on the current instrument. Key benefits Easily visible take profit/stop loss lines Reliable bands lines with futuristic colors, and  Intuitive directional arrows Useful statistics , which indicate the win rate of the signals Plus Package  available, leave a feedback to receive it for
FREE
Blahtech Moving Average indicator is a multitimeframe version of the standard Moving Average indicator. It is also enhanced with customisable alerts, period breaks and other configuration options. The 50 day and 200 day moving averages are widely followed by investors and traders, with breaks above and below the MA lines considered to be signals of interest. Links [  Install  |  Update  |   Training   |   All Products  ] Feature Highlights Up to three timeframes Configurable calculation variab
FREE
Free automatic Fibonacci is an indicator that automatically plots a Fibonacci retracement based on the number of bars you select on the BarsToScan setting in the indicator. The Fibonacci is automatically updated in real time as new highest and lowest values appears amongst the selected bars. You can select which level values to be displayed in the indicator settings. You can also select the color of the levels thus enabling the trader to be able to attach the indicator several times with differe
FREE
Inside Bar Radar
Flavio Javier Jarabeck
4.67 (6)
The Inside Bar pattern is a very well known candlestick formation used widely by traders all over the world and in any marketplace. This approach is very simple and adds a little confirmation candle, so it adds a third past candlestick to the count to confirm the direction of the move (upward or downward). Obviously, there is no power on this candlestick formation if the trader has no context on what it is happening on the market he/she is operating, so this is not magic, this "radar" is only a
FREE
QuantumAlert Stoch Navigator is a free indicator available for MT4/MT5 platforms, its work is to provide "alerts" when the market is inside "overbought and oversold" regions in the form of "buy or sell" signals. This indicator comes with many customization options mentioned in the parameter section below, user can customise these parameters as needful. Join our   MQL5 group , where we share important news and updates. You are also welcome to join our private channel as well, contact me for the p
FREE
QuantumAlert CCI Navigator is a free indicator available for MT4/MT5 platforms, its work is to provide "alerts" when the market is inside "overbought and oversold" regions in the form of "buy or sell" signals. This indicator comes with many customization options mentioned in the parameter section below, user can customise these parameters as needful. Join our   MQL5 group , where we share important news and updates. You are also welcome to join our private channel as well, contact me for the pri
FREE
PZ Three Drives MT5
PZ TRADING SLU
3.11 (9)
This indicator finds Three Drives patterns. The Three Drives pattern is a 6-point reversal pattern characterised by a series of higher highs or lower lows that complete at a 127% or 161.8% Fibonacci extension. It signals that the market is exhausted and a reversal can happen. [ Installation Guide | Update Guide | Troubleshooting | FAQ | All Products ] Customizable pattern sizes Customizable colors and sizes Customizable breakout periods Customizable 1-2-3 and 0-A-B ratios It implements visua
FREE
TilsonT3
Jonathan Pereira
Tillson's T3 moving average was introduced to the world of technical analysis in the article ''A Better Moving Average'', published in the American magazine Technical Analysis of Stock Commodities. Developed by Tim Tillson, analysts and traders of futures markets soon became fascinated with this technique that smoothes the price series while decreasing the lag (lag) typical of trend-following systems.
FREE
Envelopes Clouds
Samuel Manoel De Souza
The Indicator indicator draws 2 clouds based on Envelopes indicator values. The upper cloud is formed by the upper lines values and the lower cloud by the lowers lines values. The indicator allows to change the Envelopes parameters and the clouds colors the period of the base line and the deviations of each Envelopes instance. The indicator holds 5 buffer index as follow: [0] - Outer values of the upper cloud [1]  - Inner values of the upper cloud [2]  - Base/Center line values [3]  - Inner valu
FREE
PANEL OF TOPOS AND HISTORICAL BACKGROUNDS   This is a panel that does not open orders only manages all Symbols and calculates the tops and bottoms and presents the calculation in relation to the top and bottom in 5 Years, 2 Months and 1 Week. It is ideal for filtering the pairs that are in the good regions to operate. You can filter the range and choose whether to consider the body or shadow of the candle in the monthly. Good luck...
FREE
Virtual Targets MT5
Hoang Van Dien
4.71 (7)
This indicator is very useful for day traders or short term traders. (MT5 version) No need to calculate the number of pips manually, just look at the chart and you will see the Virtual Take Profit / Virtual Stop Loss target line and evaluate whether the entry point is feasible to reach the intended target or not. Enter the intended   Take Profit / Stop Loss   pips for your trade. The indicator will display   Virtual Take Profit / Virtual Stop Loss   lines for you to easily see if the target i
FREE
Supertrend Line
Flavio Javier Jarabeck
4.86 (14)
The Supertrend indicator was originally created by a french fellow named Olivier Seban , and its goal is to identify the Primary Trend of prices . Its calculation is easy and based on the average of Highs and Lows and then we add the volatility of a custom period, plus a multiplier. This way we get the Supertrend Line. You can find in the web several approaches and trading strategies using this very useful indicator. HOW TO "READ" THIS INDICATOR If the closing prices are above Supertrend Line
FREE
Graphic Alignment Context
Ricardo Alexandre Laurentino
The Graphic Alignment Context (GAC) Technical Indicator measures the vertical difference of the simple average price of a financial instrument in the context of three different timeframes determined by a defined number of bars or candles (periods) to determine the strength of the buy or sell trend. sale. Ascending average prices indicate Buying strength (1), Descending average prices indicate Selling strength (-1) and any scenario different from the previous two conditions indicates Neutrality
FREE
Alert System
Nguyen Thanh Sang
5 (3)
Alert System You use function keys to create horizontal lines for alerts. 1. Allow set horizontal line properties (line color, line style, line width, ...) for alerts. 2. Allow add text to horizotanl line. You can hide or show text when you need. You can change text and its price, but time of text will be set in input named "text_time" (0 is current time, you should test this input with -1, -2, -3 or lower). 3. It has 2 types of alert: above and bellow. You can set key to create them. If price i
FREE
PZ Chart Overlay MT5
PZ TRADING SLU
4.5 (2)
The Chart Overlay indicator displays the price action of several instruments on the same chart allowing you to evaluate how differently currency pairs fluctuate relative to each other.  [ Installation Guide | Update Guide | Troubleshooting | FAQ | All Products ] Find overbought or oversold currency pairs easily Plot up to six currency pairs overlayed on the same chart Display inverted symbols if necessary Adapt to chart size, zoom and timeframe Automatic price level calculation Customizable p
FREE
Time Session OPEN-HIGH-LOW-CLOSE This Indicator Will Draw Lines Of OHLC Levels Of Time Session Defined By User. It Will Plot Floating Lines On Current Day Chart. Time Session Can Of Current Day Or Previous Day. You Can Plot Multiple Session Lines By Giving Unique ID To Each Session. It Can Even Show Historical Levels Of Time Session Selected By User On Chart To Do Backdating Test. You Can Write Text To Describe The Lines.
FREE
Description. The basis for the formation of the Renko chart is the price range. If the price goes beyond its limits, the chart shows a box above or below the previous one. As a result, we see price movement without additional "noise" and important support and resistance levels. Features. For use in conjunction with the Expert Advisor, an additional buffer is implemented-a box counter. For convenience and to increase the speed of testing, the user can use the "new box" event, which the indicato
FREE
Bu ürünün alıcıları ayrıca şunları da satın alıyor
Öncelikle, bu Ticaret Sistemi'nin Non-Repainting, Non-Redrawing ve Non-Lagging Göstergesi olduğunu vurgulamak önemlidir, bu da hem manuel hem de robot ticareti için ideal hale getirir. "Smart Trend Trading System MT5", yeni ve deneyimli tüccarlar için özelleştirilmiş kapsamlı bir ticaret çözümüdür. 10'dan fazla premium göstergeyi birleştiriyor ve 7'den fazla sağlam ticaret stratejisi sunuyor, bu da çeşitli piyasa koşulları için esnek bir seçim yapar. Trend Takip Stratejisi: Trendleri etkili bir
Atomic Analyst MT5
Issam Kassas
4.82 (11)
Öncelikle belirtmek gerekir ki bu Ticaret Göstergesi Yeniden Çizim Yapmaz, Gecikmez ve Gecikme Göstermez, bu da hem manuel hem de robot ticareti için ideal hale getirir. Atom Analisti, Piyasada Daha İyi Bir Avantaj Bulmak İçin Fiyatın Gücünü ve Momentumunu Kullanan PA Fiyat Hareketi Göstergesidir. Gürültüleri ve Yanlış Sinyalleri Kaldırmaya ve Ticaret Potansiyelini Artırmaya Yardımcı Olan Gelişmiş Filtrelerle Donatılmıştır. Birden fazla katmanlı karmaşık göstergeler kullanarak, Atom Analisti
FX Volume MT5
Daniel Stein
4.94 (17)
Sabah Brifingimiz aracılığıyla ayrıntılar ve ekran görüntüleri ile günlük piyasa güncellemenizi alın burada mql5 ve on Telegram ! FX Volume, bir brokerin bakış açısından piyasa duyarlılığı hakkında GERÇEK bir fikir veren İLK ve TEK hacim göstergesidir. COT raporlarından çok daha hızlı bir şekilde, brokerlar gibi kurumsal piyasa katılımcılarının Forex piyasasında nasıl konumlandıklarına dair harika bilgiler sağlar. Bu bilgileri doğrudan grafiğinizde görmek, ticaretiniz için gerçek oyun değiştir
Quantum Trend Sniper
Bogdan Ion Puscasu
5 (37)
Tanıtım       Kuantum Trend Keskin Nişancı Göstergesi   , trend tersine dönmeleri belirleme ve ticaret yapma şeklinizi değiştiren çığır açan MQL5 Göstergesi! 13 yılı aşkın ticaret tecrübesine sahip deneyimli tüccarlardan oluşan bir ekip tarafından geliştirilmiştir.       Kuantum Trend Keskin Nişancı Göstergesi       trend dönüşlerini son derece yüksek doğrulukla belirlemenin yenilikçi yolu ile ticaret yolculuğunuzu yeni zirvelere taşımak için tasarlanmıştır. ***Kuantum Trend Keskin Nişancı Gö
Gold Stuff mt5
Vasiliy Strukov
4.89 (166)
Gold Stuff mt5, özellikle altın için tasarlanmış bir trend göstergesidir ve herhangi bir finansal enstrümanda da kullanılabilir. Gösterge yeniden çizilmez ve gecikmez. Önerilen zaman dilimi H1. Ayarları ve kişisel bir bonusu almak için satın alma işleminden hemen sonra benimle iletişime geçin!   AYARLAR Ok Çiz - açık kapalı. grafik üzerinde oklar çizmek. Uyarılar - sesli uyarılar kapalı. E-posta bildirimi - açık kapalı. E-posta Bildirimleri. Puch bildirimi - açık kapalı. Push bildirimleri
Trend Screener Pro MT5
STE S.S.COMPANY
4.89 (61)
Trend Göstergesi, Trend Alım Satım ve Filtreleme için Çığır Açan Benzersiz Çözüm, Tüm Önemli Trend Özellikleriyle Tek Bir Araç İçinde Yerleştirildi! Forex, emtialar, kripto para birimleri, endeksler ve hisse senetleri gibi tüm sembollerde/araçlarda kullanılabilen %100 yeniden boyamayan çoklu zaman çerçevesi ve Çoklu para birimi göstergesidir. Trend Screener, grafikte noktalarla ok trend sinyalleri sağlayan etkili bir trend trend göstergesidir. Trend analizörü göstergesinde bulunan özellikler: 1.
FX Power MT5 NG
Daniel Stein
5 (4)
Sabah Brifingimiz burada mql5 ve on Telegram! FX Power MT5 NG , uzun zamandır çok popüler olan döviz gücü ölçerimiz FX Power'ın yeni neslidir. Peki bu yeni nesil güç ölçer ne sunuyor? Orijinal FX Power hakkında sevdiğiniz her şey PLUS GOLD/XAU güç analizi Daha da hassas hesaplama sonuçları Ayrı ayrı yapılandırılabilir analiz dönemleri Daha da iyi performans için özelleştirilebilir hesaplama limiti Özel çokluDaha fazlasını görmek isteyenler için örnek ayarlar Her grafikte en sevdiğiniz renkler i
Top indicator for MT5   providing accurate signals to enter a trade without repainting! It can be applied to any financial assets:   forex, cryptocurrencies, metals, stocks, indices .  Watch  the video  (6:22) with an example of processing only one signal that paid off the indicator! MT4 version is here It will provide pretty accurate trading signals and tell you when it's best to open a trade and close it. Most traders improve their trading results during the first trading week with the help of
Öncelikle, bu Ticaret Aracının Non-Repainting, Non-Redrawing ve Non-Lagging Gösterge olduğunu vurgulamakta fayda var, bu da onu profesyonel ticaret için ideal hale getiriyor. Akıllı Fiyat Hareketi Kavramları Göstergesi, hem yeni hem de deneyimli tüccarlar için çok güçlü bir araçtır. İleri ticaret fikirlerini, Inner Circle Trader Analizi ve Smart Money Concepts Ticaret Stratejileri gibi 20'den fazla kullanışlı göstergeyi bir araya getirerek bir araya getirir. Bu gösterge, büyük kurumların tica
RelicusRoad Pro MT5
Relicus LLC
4.82 (22)
Şimdi 147 $ (birkaç güncellemeden sonra 499 $ 'a yükseliyor) - Sınırsız Hesaplar (PC'ler veya Mac'ler) RelicusRoad Kullanım Kılavuzu + Eğitim Videoları + Özel Discord Grubuna Erişim + VIP Durumu PİYASAYA BAKMAK İÇİN YENİ BİR YOL RelicusRoad, forex, vadeli işlemler, kripto para birimleri, hisse senetleri ve endeksler için dünyanın en güçlü ticaret göstergesidir ve yatırımcılara kârlı kalmaları için ihtiyaç duydukları tüm bilgileri ve araçları sağlar. Başlangıç ​​seviyesinden ileri seviyey
Auto Order Block with break of structure based on ICT and Smart Money Concepts Futures Break of Structure ( BoS )             Order block ( OB )            Higher time frame Order block / Point of Interest ( POI )    shown on current chart           Fair value Gap ( FVG ) / Imbalance   ,  MTF      ( Multi Time Frame )    Volume Imbalance     ,  MTF          vIMB Gap’s Equal High / Low’s     ,  MTF             EQH / EQL Liquidity               Current Day High / Low           HOD /
XQ Indicator MetaTrader 5
Marzena Maria Szmit
5 (1)
Step into the realm of Forex trading with confidence and precision using XQ, a cutting-edge Forex indicator designed to elevate your trading game to unprecedented heights. Whether you're a seasoned trader or just stepping into the world of currency exchange, XQ Forex Indicator empowers you with the insights and signals needed to make informed trading decisions. The signal conditions are a combination of three indicators, and XQ Forex Indicator only display  medium and long-term trends . The ind
Blahtech Supply Demand MT5
Blahtech Limited
4.57 (14)
Was: $299  Now: $99   Supply Demand uses previous price action to identify potential imbalances between buyers and sellers. The key is to identify the better odds zones, not just the untouched ones. Blahtech Supply Demand indicator delivers functionality previously unavailable on any trading platform. This 4-in-1 indicator not only highlights the higher probability zones using a multi-criteria strength engine, but also combines it with multi-timeframe trend analysis, previously confirmed swings
Advanced Supply Demand MT5
Bernhard Schweigert
4.53 (15)
Herhangi bir Acemi veya Uzman Tüccar için En İyi Çözüm! Bu gösterge benzersiz, yüksek kaliteli ve uygun fiyatlı bir ticaret aracıdır çünkü bir dizi tescilli özelliği ve yeni bir formülü bir araya getirdik. Bu güncelleme ile çift zaman dilimi dilimlerini gösterebileceksiniz. Yalnızca daha yüksek bir TF gösteremeyeceksiniz, aynı zamanda TF grafiğini ve ARTIK daha yüksek TF'yi de gösterebileceksiniz: YUVARLAK BÖLGELERİ GÖSTERMEK. Tüm Arz Talebi tüccarları buna bayılacak. :) Önemli Bilgiler Açıkland
AW Trend Predictor MT5
AW Trading Software Limited
4.76 (54)
Tek bir sistemde trend ve kırılma seviyelerinin kombinasyonu. Gelişmiş bir gösterge algoritması piyasa gürültüsünü filtreler, trendi, giriş noktalarını ve olası çıkış seviyelerini belirler. Gösterge sinyalleri, sinyal geçmişinin etkinliğini gösteren en uygun enstrümanların seçilmesine izin veren bir istatistiksel modüle kaydedilir. Gösterge Kâr Al ve Zararı Durdur işaretlerini hesaplar. Kılavuz ve talimatlar ->   BURAYA   / MT4 versiyonu ->   BURAYA Gösterge ile nasıl ticaret yapılır: Trend Pre
ICT, SMC, SMART MONEY CONCEPTS, SMART MONEY, Smart Money Concept, Support and Resistance, Trend Analysis, Price Action, Market Structure, Order Blocks, BOS/CHoCH,   Breaker Blocks ,  Momentum Shift,   Supply&Demand Zone/Order Blocks , Strong Imbalance,   HH/LL/HL/LH,    Fair Value Gap, FVG,  Premium  &   Discount   Zones, Fibonacci Retracement, OTE, Buy Side Liquidity, Sell Side Liquidity, BSL/SSL Taken, Equal Highs & Lows, MTF Dashboard, Multiple Time Frame, BigBar, HTF OB, HTF Market Structure
TPSpro TRENDPRO  - is a trend indicator that automatically analyzes the market and provides information about the trend and each of its changes, as well as giving signals for entering trades without redrawing! The indicator uses each candle, analyzing them separately. referring to different impulses - up or down impulse. Exact entry points into transactions for currencies, crypto, metals, stocks, indices!  -  Version MT4                  DETAILED DESCRIPTION        /       TRADING SETUPS       
Gann Kare Göstergesi, W.D. Gann tarafından yazılan "Piyasa Tahminleri için Matematiksel Formül" makalesine dayalı güçlü bir piyasa analizi aracıdır. Bu araç, piyasa analizi için matematiksel ve Gann teorilerini kullanarak hassas analizler gerçekleştirir. 144, 90, 52 karelerini ve ayrıca 9 karesini kullanır. Ayrıca, ın 9 karesi ve bu kareyle ilişkili kanallar ve yıldız modelleri için yöntemini içerir. Kullanıcı Kılavuzu ve Uygulama: Bu göstergeleri kullanmadan önce, kullanıcı kılavuzunu okumanız
Fiyat tersine döndükçe ve geri çekildikçe piyasa yapısından elde edilen kâr değişir. Piyasa yapısını tersine çevirme uyarısı göstergesi, bir trendin veya fiyat hareketinin ne zaman tükenmeye yaklaştığını ve tersine dönmeye hazır olduğunu tanımlar. Genellikle bir geri dönüş veya büyük bir geri çekilme meydana gelmek üzereyken meydana gelen piyasa yapısındaki değişiklikler konusunda sizi uyarır. Gösterge, olası bir tükenme noktasının yakınında her yeni yüksek veya düşük oluştuğunda, başlangıçta
Grafiğinizde otomatik olarak destek ve direnç seviyeleri PLUS itici mum boşlukları çizin, böylece fiyatın nereye gidebileceğini ve / veya potansiyel olarak tersine dönebileceğini görebilirsiniz. Bu gösterge, web sitemde (The Market Structure Trader) öğretilen pozisyon ticareti metodolojisinin bir parçası olarak kullanılmak üzere tasarlanmıştır ve hedefleme ve potansiyel girişler için temel bilgileri görüntüler. MT4 Version:  https://www.mql5.com/en/market/product/97246/ Göstergede 2 TEMEL öze
A key element in trading is zones or levels from which decisions to buy or sell a trading instrument are made. Despite attempts by major players to conceal their presence in the market, they inevitably leave traces. Our task was to learn how to identify these traces and interpret them correctly. Reversal First Impulse levels (RFI)   -  Version MT4                  INSTRUCTIONS                 RUS                 ENG                         R ecommended to use with an indicator   -  TREND PRO  
Tanıtım       Quantum Breakout PRO   , Breakout Bölgeleri ile ticaret yapma şeklinizi değiştiren çığır açan MQL5 Göstergesi! 13 yılı aşkın ticaret tecrübesine sahip deneyimli tüccarlardan oluşan bir ekip tarafından geliştirilmiştir.       Kuantum Breakout PRO       yenilikçi ve dinamik koparma bölgesi stratejisiyle ticaret yolculuğunuzu yeni zirvelere taşımak için tasarlanmıştır. Kuantum Breakout Göstergesi, size 5 kar hedefi bölgesi ile kırılma bölgelerinde sinyal okları ve kırılma kutusuna
The Volume by Price Indicator for MetaTrader 5 features Volume Profile and Market Profile TPO (Time Price Opportunity). Get valuable insights out of currencies, equities and commodities data. Gain an edge trading financial markets. Volume and TPO histogram bar and line charts. Volume Footprint charts. TPO letter and block marker charts including split structures. Versatile segmentation and compositing methods. Static, dynamic and flexible ranges with relative and/or absolute visualizations. Lay
Owl Smart Levels MT5
Sergey Ermolov
4.47 (36)
MT4 versiyonu  |  FAQ Owl Smart Levels Indicator , Bill Williams'ın gelişmiş fraktalları , piyasanın doğru dalga yapısını oluşturan Valable ZigZag ve kesin giriş seviyelerini gösteren Fibonacci seviyeleri gibi popüler piyasa analiz araçlarını içeren tek gösterge içinde eksiksiz bir ticaret sistemidir. pazara ve kar elde edilecek yerlere. Stratejinin ayrıntılı açıklaması Gösterge ile çalışma talimatı Baykuş Yardımcısı ticaretinde Danışman Yardımcısı Kullanıcıların özel sohbeti -> Satın aldıktan
TrendLine PRO MT5
Evgenii Aksenov
4.78 (49)
The Trend Line PRO indicator is an independent trading strategy. It shows the trend change, the entry point to the transaction, as well as automatically calculates three levels of Take Profit and Stop Loss protection Trend Line PRO is perfect for all Meta Trader symbols: currencies, metals, cryptocurrencies, stocks and indices Advantages of Trend Line PRO Never redraws its signals The possibility of using it as an independent strategy It has three automatic levels Take Profit and Stop Loss lev
Gartley Hunter Multi
Siarhei Vashchylka
5 (5)
Gartley Hunter Multi - An indicator for searching for harmonic patterns simultaneously on dozens of trading instruments and on all classic timeframes: (m1, m5, m15, m30, H1, H4, D1, Wk, Mn). Manual (Be sure to read before purchasing) | Version for MT4 Advantages 1. Patterns: Gartley, Butterfly, Shark, Crab. Bat, Alternate Bat, Deep Crab, Cypher 2. Simultaneous search for patterns on dozens of trading instruments and on all classic timeframes 3. Search for patterns of all possible sizes. Fr
Trend Line Map Pro MT5
STE S.S.COMPANY
4.67 (9)
Trend Line Map indicator is an addons for   Trend Screener Indicator . It's working as a scanner for all signals generated by Trend screener ( Trend Line Signals ) . It's a Trend Line Scanner based on Trend Screener Indicator.  If you don't have Trend Screener Pro Indicator,   the Trend Line Map Pro will not work.     LIMITED TIME OFFER : Trend Line Map Indicator is available for only 50 $ and lifetime. ( Original price 125$ ) By accessing to our MQL5 Blog,  you can find all our premium indica
TrendDecoder Premium MT5
Christophe, Pa Trouillas
5 (1)
Aralıkları ve bir sonraki olası hamleleri belirleyin     |    Trendlerin en erken sinyallerini ve gücünü alın     |    Geri dönüşten önce net çıkışlar alın     |    Fiyatın test edeceği Fibo seviyelerini tespit edin   |  Gecikmesiz, takip edilmeyen gösterge - manuel ve otomatik ticaret için ideal - tüm varlıklar ve tüm zaman birimleri için uygun 50 İNDİRİM   - lansman için sonra tekrar   >>   149 $ Satın aldıktan sonra, kişiselleştirilmiş ayarlar için   bu kanaldan benimle iletişime geçin . MT4
MetaBands M5
Vahidreza Heidar Gholami
4.67 (3)
MetaBands uses powerful and unique algorithms to draw channels and detect trends so that it can provide traders with potential points for entering and exiting trades. It’s a channel indicator plus a powerful trend indicator. It includes different types of channels which can be merged to create new channels simply by using the input parameters. MetaBands uses all types of alerts to notify users about market events. Features Supports most of the channel algorithms Powerful trend detection algorith
Was: $249  Now: $99   Market Profile defines a number of day types that can help the trader to determine market behaviour. A key feature is the Value Area, representing the range of price action where 70% of trading took place. Understanding the Value Area can give traders valuable insight into market direction and establish the higher odds trade. It is an excellent addition to any system you may be using. Inspired by Jim Dalton’s book “Mind Over Markets”, this indicator is designed to suit the
Yazarın diğer ürünleri
Supports And Resistances Lines
Francisco Gomes Da Silva
4.78 (40)
Destek ve Direnç bölgeleri Göstergesi MT5 bu gösterge, tepeleri ve dipleri otomatik olarak nasıl belirleyeceğini bilir. Bu destek ve direnç göstergesi, üst ve alt noktalara göre destek çizgileri ve direnç çizgileri oluşturur. destek ve direnç çizgileri nasıl yapılır? Bu, otomatik destek ve direnç çizgileri oluşturmanın bir göstergesidir. gösterge ile destek seviyesi nasıl bulunur? bu gösterge, tepeleri ve dipleri otomatik olarak bulur. Gösterge, "ZigZag" otomatik olarak bir dip oluşturduğunda ve
FREE
Sweet VWAP MT5
Francisco Gomes Da Silva
4.36 (14)
Büyük kurumların işlem yaptığı yerleri keşfedin ve VWAP Anchor Göstergesi ile yatırımlarınızı optimize edin Bu gösterge, VWAP Anchor stratejilerine uzmanlaşmış traderlar için tasarlanmış olup, fare imlecinizi kullanarak belirli çapa noktalarından VWAP'ın davranışını analiz etmek için hızlı bir şekilde işlem yapma olanağı sunar. Temel Özellikler: VWAP Anchorlama: Bu göstergenin temel işlevi, traderın seçtiği bir noktaya bağlanmış gibi VWAP'ın nasıl davranacağını göstermektir. Bu, farklı zaman per
FREE
Sweet VWAP Anchored MT5
Francisco Gomes Da Silva
5 (3)
Tasaruf edin ve VWAP'lerle daha doğru kararlar verin Bu aracın gücünü test etmek istiyorsanız, ücretsiz MetaTrader 5 için bağlı VWAP göstergisini indirebilirsiniz. Bu gösterge bağımsız olarak çalışmanın yanı sıra aynı zamanda ücretsiz Sweet VWAP'in bir uzantısıdır. Çünkü ücretsiz sürüme tıkladığınızda, fare imlecinde gördüğünüz VWAP, bu gösterge olarak sabitlenecektir. Ve daha iyi anlamak için, sabitlenen şey bu göstergedir ve sahip olduğu tüm özelliklere sahiptir. Bu gösterge, MetaTrader 5 için
Sweet VWAP Aux
Francisco Gomes Da Silva
4.25 (4)
Sweet VWAP Aux ile Zaman Kazanın ve Daha İsabetli Kararlar Verin Hala MetaTrader 4 için ücretsiz VWAP göstergemizi indirmediyseniz şimdi indirin ve sabit VWAP görselleştirme yeteneklerini deneyin. Daha sonra buraya dönün ve Sweet VWAP Aux'u keşfedin - Sweet VWAP göstergeniz için mükemmel bir eklenti. Tek bir tıklama ile, Sweet VWAP, VWAP göstergenizi seçtiğiniz noktada sabitlemenize olanak tanır, zamanınızı kurtarır ve manuel olarak yapılandırmaya gerek kalmadan işlem yapmanıza olanak sağlar. Ay
Supports And Resistances Lines MTF MT4
Francisco Gomes Da Silva
4.89 (9)
Destekler ve Dirençler, birkaç farklı zaman diliminde tepe ve dipleri otomatik olarak belirlemenize ve böylece mevcut tablo üzerinde bu tepe ve dipleri çizmenize yardımcı olmak için oluşturulmuştur. Dirençlerin oluşturulmasının açıklamasına geçelim. Üst ve alt kuralın ne olduğunu tanımlayabileceğiniz bir kural alanı vardır, üst kural varsayılan olarak şu şekilde ayarlanır: H[ 0 ]<=H[1] and H[ 1 ]=>H[ 2 ] Nerede: eleman Tanım H Yüksek    anlamına gelir [0] mevcut   mum  anlamına gelir [1] ö
FREE
VWAP With Alerts
Francisco Gomes Da Silva
5 (2)
Bu VWAP, basit bir VWAP'tir, ancak fiyatın basit VWAP'a dokunduğunda veya fiyatın VWAP'ı geçtiğinde bildirimler almanız için bu VWAP'a uyarılar ekledik. Bu gösterge, MetaTrader 5 (MT5) için geleneksel bir VWAP göstergesidir. Varsayılan parametreler normal VWAP'inki gibidir, ancak yeni hesaplamaları ve daha iyisini kullanma yeteneğiniz vardır: Fiyat VWAP'a dokunduğunda veya VWAP'ı geçtiğinde, bildirimler, cep telefonu bildirimleri, e-posta veya ses olayları aracılığıyla bilgilendirileceksiniz. Me
FREE
Bar Number
Francisco Gomes Da Silva
5 (2)
Mum sayacı Bu gösterge mumları sayar ve sayılarını daha uzun bir süreye göre gösterir daha büyük zaman çerçevesi Günlük zaman aralığını " Bigger Timeframe " olarak seçebilir ve en küçük zaman aralığına sahip olan grafikte çalıştırabilirsiniz. sayacın çubukları günlük çizelgeye göre sayacağını. Parametre olarak " H1 " zaman dilimini geçerseniz, gösterge H1 grafiğindeki çubukları nasıl sayacağını bilecektir, yalnızca daha küçük zaman dilimlerine sahip grafiklerde çalıştırması gerekir. Ana parametr
FREE
Paula Bollinger Bands
Francisco Gomes Da Silva
5 (1)
MetaTrader yatırımcı robotu için Uzman Danışman ile yatırım stratejinizi dönüştürün. Joe Ross tarafından oluşturulan ve ünlü Brezilyalı tüccar Rodrigo Cohen tarafından Paula olarak adlandırılan güçlü Bollinger Bantları stratejisine dayalı olarak, karınızı en üst düzeye çıkaracak ve risklerinizi en aza indirecek ileri teknolojiye erişebileceksiniz. Eski ve verimsiz stratejilerle daha fazla zaman kaybetmeyin. Yatırımcı robotumuzla, piyasa trendlerinin teknik analizini Joe Ross ve Rodrigo Cohen'
FREE
OHLC Shifted
Francisco Gomes Da Silva
5 (3)
Önceki Günün Kapanışı ve MetaTrader için Bar Kaydırma! Önceki Günün Kapanışı ve Bar Kaydırma Göstergesi, teknik analizi ve işlem yapma kararlarınızı geliştirmek için tasarlanmış bir araçtır. Bu gösterge ile herhangi bir çubuğun açılış, maksimum, minimum ve kapanış seviyeleri hakkında ayrıntılı bilgilere erişebilir ve piyasa hareketlerinin doğru ve kapsamlı bir şekilde analizini yapabilirsiniz. Bir zaman aralığını diğerinin içine yerleştirebilme hayalini kurun, böylece mevcut zaman aralığınızda f
FREE
VWAP With Alerts MT4
Francisco Gomes Da Silva
Bu VWAP basit bir VWAP'tir, ancak fiyatın VWAP çizgisine ulaştığında veya geçtiğinde bilgi veren bildirimler ekledik. Bu gösterge, MetaTrader 4 (MT4) için geleneksel bir VWAP göstergesidir. Varsayılan parametreler normal VWAP'inkilerdir, ancak VWAP hesaplamasını ve en iyisini değiştirme yeteneğine sahipsiniz: Fiyat VWAP'a dokunduğunda veya geçtiğinde, sizi uyarılar, cep telefonu bildirimleri, e-posta veya ses olayları aracılığıyla bilgilendirir. MetaTrader 4 için VWAP göstergesi . Parametreler:
FREE
Sweet VWAP
Francisco Gomes Da Silva
3.67 (3)
Büyük kurumların işlem yaptığı yerleri keşfedin ve MetaTrader 4 için Ücretsiz Bağlı VWAP Göstergesi ile yatırımlarınızı optimize edin. Büyük kurumların işlem yaptığı fiyatı keşfedin - MetaTrader 4 için Ücretsiz Bağlı VWAP Göstergemizle! Şimdi, VWAP'lerinizi piyasanın tepelerine ve diplerine bağlı hale getirerek zamanınızı otomatik hale getirerek tasarruf edebilirsiniz. Ücretsiz sürümümüz, fare imlecinin grafikteki hareketini takip ederek VWAP'ı anında görüntülemenizi sağlar. Böylece, fiyatın VWA
FREE
Auto Anchored VWAPs MT4
Francisco Gomes Da Silva
5 (1)
Otomatik Bağlı VWAP'lar ile Ticaretteki İçgörüleri Keşfedin: Otomatik Bağlı VWAP'lar , ticaret dünyasında rehberiniz olarak hizmet eder. Bu göstergeler, kritik piyasa dönüm noktalarını belirler ve VWAP çizgilerini kullanarak grafiğinizde gösterir. Bu, bağlı VWAP stratejilerini kullanan tüccarlar için bir oyun değiştiricidir. Nasıl Çalışır? Yüksek Noktaları Tanımlama: Eğer mevcut mumun en yüksek fiyatı önceki mumun en yüksek fiyatından düşükse, Ve önceki yüksek, ondan öncekinden daha yüksekse, Bi
FREE
Bar Counter MT4
Francisco Gomes Da Silva
5 (6)
şamdan sayaç göstergesi bu gösterge, herhangi bir zaman diliminde yer alan mumları sayar mt4'te indirebileceğiniz ücretsiz bir bar sayacı şamdan sayacı, daha büyük bir grafiğin içinde kaç mum olduğunu sayar Bu mum sayacıyla otomatik mum sayımı yapabilirsiniz Çubukları otomatik olarak indirip saymanız için ücretsiz şamdan sayım göstergesi bar counter to count the bars count candle counter indicator mt4 count candle MT5 için mum sayacı Bu göstergeyle ilgileniyorsanız, onu geliştirmeye devam edebil
FREE
Auto Anchored VWAPs
Francisco Gomes Da Silva
Otomatik Bağlı VWAP'lar ile Ticaretteki İçgörüleri Keşfedin: Otomatik Bağlı VWAP'lar , ticaret dünyasında rehberiniz olarak hizmet eder. Bu göstergeler, kritik piyasa dönüm noktalarını belirler ve VWAP çizgilerini kullanarak grafiğinizde gösterir. Bu, bağlı VWAP stratejilerini kullanan tüccarlar için bir oyun değiştiricidir. Nasıl Çalışır? Yüksek Noktaları Tanımlama: Eğer mevcut mumun en yüksek fiyatı önceki mumun en yüksek fiyatından düşükse, Ve önceki yüksek, ondan öncekinden daha yüksekse, Bi
FREE
Rule Plotter MT4
Francisco Gomes Da Silva
5 (1)
Rule Plotter ile Otomatik Ticaret Robotu Nasıl Oluşturulur Sadece birkaç fare tıklaması ile ticaret stratejilerinizi otomatikleştirebilmenin ne kadar güçlü olabileceğini hiç düşündünüz mü? Karmaşık kodlara dalmadan farklı ticaret stratejilerini oluşturup test etmenin özgürlüğünü hayal edin. Rule Plotter ile bu vizyon gerçek oluyor. Burada kendi özel ticaret robotunuzu nasıl oluşturabileceğinizi ve Rule Plotter'ı kullanarak ticaret sistemi oluşturmayı keşfedeceğiz, tüm süreci basitleştiren bir ti
FREE
OHLC Shifted MT4
Francisco Gomes Da Silva
5 (2)
Önceki Günün Kapanışı ve MetaTrader için Bar Kaydırma! Önceki Günün Kapanışı ve Bar Kaydırma Göstergesi, teknik analizi ve işlem yapma kararlarınızı geliştirmek için tasarlanmış bir araçtır. Bu gösterge ile herhangi bir çubuğun açılış, maksimum, minimum ve kapanış seviyeleri hakkında ayrıntılı bilgilere erişebilir ve piyasa hareketlerinin doğru ve kapsamlı bir şekilde analizini yapabilirsiniz. Bir zaman aralığını diğerinin içine yerleştirebilme hayalini kurun, böylece mevcut zaman aralığınızda f
FREE
My Candle Patterns
Francisco Gomes Da Silva
5 (1)
Bu gösterge, buradan indirilebilen My Candle Complete'in bir demo sürümüdür: Candle Patterns Creator Tam sürümü ile kendi candle kurallarınızı oluşturabilir ve stratejinize göre geleneksel candle desenlerini daha doğru hale getirebilirsiniz. Gösterge, birkaç örnek candle kuralı içerir, ancak burada sadece bazılarını göstereceğim: Pattern Rule Candle Green C > O Candle Red C < O Doji C = O Hammer (C > O and (C-O) *2 < O-L and (C-O) *0.5 > H-C) or (C < O and (O-C) *2 < C-L and (O-C) *0.5 > H-O) Ha
FREE
Paula Bollinger Bands Strategy
Francisco Gomes Da Silva
4 (2)
Bollinger bands out/in strategy A strategy created by Joe Ross, and very useful for finding trades when the market is overloaded. Indicator You don't need to find where there are entries on the chart, this indicator shows them for you. The entrance The trade is confirmed when the price closes outside the bollinger bands on a candle and the candle after the price closes inside the bands. comment I want to improve this indicator, so you can help me sending me your reviews and comments, thanks :).
FREE
First Bar
Francisco Gomes Da Silva
Ticaret Sistemi İşlem yapacağınız gün bir çubuk seçerseniz, bu çubuk kapandığında robot en yüksekte ve mumun en altında iki emir gönderir, bu da tekrar alırsa diğeri iptal edilir Kayıp Durdur durdurma, satın alma durumunda en düşük seviyenin bir tık altında veya satış durumunda en yüksek seviyenin bir tık üstünde olacaktır Kâr Al StopLoss aralığından ne kadar almak istediğinizi ayarlayabilir, strateji optimizasyonunda özelleştirebilirsiniz Otimizasyon Bu robot, risk getirisi elde etmek için gird
FREE
Fibonacci on ZigZag
Francisco Gomes Da Silva
4.93 (15)
Mouse You can draw fibonaccis moving the mouse over the zigzag indicator Pin them You can click on fibonacci with this option and it will no longer be deleted unless you click on it again :) Precision The tuned fibonacci gets the precise point in lower timeframes Enjoy it You can ask me for add more features, so please comment and leave your ranting for me to be happy, thank you :)
FREE
Rule Plotter Scanner
Francisco Gomes Da Silva
Hiç düşündün mü, tüm stratejileri tarayan ve bu varlığın tüm zaman dilimlerinde alım ve satım noktalarını gösteren bir tarayıcıya sahip olmayı? İşte tam olarak bu tarayıcı bunu yapar. Bu tarayıcı, Rule Plotter: programlama olmadan strateji oluşturucu 'da oluşturduğunuz alım ve satım sinyallerini göstermek ve bunları farklı varlıklarda ve zaman dilimlerinde çalıştırmak için tasarlanmıştır. Rule Plotter'ın varsayılan stratejisi yalnızca yükselen ve düşen mumlardır; yani Rule Plotter içinde herhang
FREE
Rule Plotter Expert
Francisco Gomes Da Silva
5 (1)
Bu Uzman Danışman, Rule Plotter göstergesi içinde oluşturduğunuz stratejilerinizi test etmek ve çalıştırmak için tasarlanmıştır. Nasıl Kullanılır: Rule Plotter - Programlama bilgisi olmadan ticaret sistemi oluşturmak için araç göstergisini ücretsiz indirin. Ardından, Rule Plotter göstergisinin içindeki stratejilerinizi geliştirin. Son olarak, bu Uzman Danışmanı kullanarak oluşturduğunuz stratejileri çalıştırın. Parametreler: Strateji: Rule Plotter göstergisi içinde oluşturduğunuz ticaret sistemi
Bu araç, konumlarınıza duraklar yerleştirir Metatrade Strateji Test Cihazı ile hızlıca test edin. Uzun bir pozisyon durumunda stopunuz son dipte olacaktır. Ya da kısa pozisyon durumunda stopunuz son zirvede olacaktır. Ayrıca, bu araç açık pozisyonlarınızın takibini yönetir. Durağınızı daima en son oluşan yüksek veya en son oluşan dibe yerleştirin üstleri ve dipleri oluşturmak için şu bağlantıdan indirilebilen ücretsiz "Destekler ve Dirençler Çizgileri" göstergesini kullanıyorum: metatrade
Stop Loss Pozisyonlama İçin Price Action'un Risk Yönetimi Gücünü Keşfedin! Giriş noktasını tam olarak bildiğiniz ancak çıkış için doğru zamanı seçmekte kararsız kaldığınız durumu yaşadınız mı? Endişelenmeyin, yalnız değilsiniz! Birçok trader günlük olarak bu zorluğa katlanıyor. İyi haber şu ki, price action temelli risk yönetimi aracımız bu sorunu çözmek için burada. Siz ideal giriş noktalarını belirlemeye odaklanırken, aracımız sizin için çıkışı kontrol altına alıyor. Price action temelli risk
Pattern Wizard
Francisco Gomes Da Silva
Patterns Wizard, candlestick desenleri oluşturmak için bir araçtır. Bu araçla çeşitli farklı desenler oluşturabilir ve grafiğinizde istediğiniz kadar bu göstergeye ait örneği ekleyebilirsiniz, her biri farklı bir desenle. Oluşturma formüllerinin nasıl çalıştığını daha iyi anlamak için   70'ten fazla candlestick deseni örneği içeren My Candle göstergesinden örnekleri alabilirsiniz. Bu göstergenin temel farkı 30 kural parametresine sahip olmasıdır, bu da her biri önceki 30 mum için farklı bir kura
FREE
Rule Plotter Expert MT4
Francisco Gomes Da Silva
5 (1)
Rule Plotter Göstergesi ile Oluşturduğunuz Stratejileri Rule Plotter Uzmanı ile Uygulayın: Artık Rule Plotter Göstergesi'ni kullanarak özelleştirilmiş stratejilerinizi oluşturdunuz ve grafikte giriş ve çıkış noktalarını gösteren okları gördünüz, şimdi bu stratejileri finansal piyasalarda hayata geçirmenin zamanı geldi. Rule Plotter Uzmanı ile bu oklar temel alınarak otomatik ve kesin bir şekilde işlem yapabilir, stratejilerinizin potansiyelini en üst düzeye çıkarabilirsiniz. Okları Eyleme Dönüşt
Hide Scale
Francisco Gomes Da Silva
5 (1)
Ekranınızda Daha Fazla Alan İsteyen Traderlar İçin Gizle Ölçek Aracı Talimatlar Zaman ölçeğini gizlemek için "T" tuşuna, fiyat ölçeğini gizlemek için "P" tuşuna basın. Bu tuşları özelleştirebilirsiniz, ilgili düğmeye tıklayarak ve klavyedeki yeni bir tuş girerek. Her iki seçeneğe de aynı tuşu atayarak her iki ölçeği aynı anda gizleyebilirsiniz. Ölçekleri yeniden göstermek için sadece ilgili tuşa tekrar basın. Neden Bu Aracı Oluşturduk Biz, Tatlı VWAP göstergemizi kullanan traderlara daha fazla e
FREE
TrendPlator
Francisco Gomes Da Silva
TrendLines Plator: Gelişmiş Eğilim Projeksiyon Göstergesiyle Ticaret Stratejilerinizi Güçlendirin Yenilikçi göstergemizin potansiyelini keşfedin! Daha geniş zaman aralıklarındaki eğilim çizgilerini doğrudan mevcut zaman aralığınıza analiz edebilme ve projekte edebilme yeteneği, genel olarak tüccarların dikkatini çeken stratejik bir destek sunar. Bu noktalar, işlemleriniz için stratejik destek veya direnç seviyelerine dönüşür ve ticaret stratejinizi güçlendirir. Price action göstergeleri koleksiy
Hide Scale MT4
Francisco Gomes Da Silva
5 (2)
Grafik Alanını Maksimize Etmek İsteyen Tüccarlar İçin İdeal Aracı - Hide Scale Hide Scale Nasıl Kullanılır Zaman ölçeğini gizlemek için "T" tuşuna basın ve fiyat ölçeğini gizlemek için "P" tuşuna basın. Her iki seçeneği aynı anda gizlemek isterseniz, her iki seçenek için aynı tuşu atayabilirsiniz. Ölçekleri yeniden görüntülemek için ilgili tuşa tekrar basmanız yeterlidir. Bu Aracın Oluşturulmasının Nedeni Sweet VWAP göstergemizi kullanan tüccarlara, ticaret ekranlarında kullanılabilir alanı maks
FREE
Patterns Wizard, candlestick desenleri oluşturmak için bir araçtır. Bu araçla çeşitli farklı desenler oluşturabilir ve grafiğinizde istediğiniz kadar bu göstergeye ait örneği ekleyebilirsiniz, her biri farklı bir desenle. Oluşturma formüllerinin nasıl çalıştığını daha iyi anlamak için   70'ten fazla candlestick deseni örneği içeren My Candle göstergesinden örnekleri alabilirsiniz. Bu göstergenin temel farkı 30 kural parametresine sahip olmasıdır, bu da her biri önceki 30 mum için farklı bir kura
Filtrele:
Elsier Jimenez
36
Elsier Jimenez 2024.04.07 23:29 
 

Excelente herramienta para automatizar una estrategia. Felicitaciones al desarrollador.

Francisco Gomes Da Silva
72737
Geliştiriciden yanıt Francisco Gomes Da Silva 2024.04.08 20:49
Muchas gracias por usar y por esta gratificante reseña, Sr. Elsier
Moeen Ghiyas
299
Moeen Ghiyas 2024.03.10 09:30 
 

It's an excellent indicator, though difficult to understand initially as it took me a few days to comprehend. Anyhow your effort and idea are highly appreciated. ...... It needs little improvement as at present it does not provide nesting (use of parenthesis within rules for logical AND /OR operations), the same is available in Math Operation but misses logical AND / OR operation there as well. Suggested improvement will make it awesome, but I will still give it 5-star rating based on your idea and effort.

Francisco Gomes Da Silva
72737
Geliştiriciden yanıt Francisco Gomes Da Silva 2024.03.10 14:20
Thank you very much for your 5 star rating and your review Moeen, in fact it is a little difficult to understand initially, as the previous knowledge should be programming logic, but after mastering the tool, we can automate infinite combinations, especially after fix this alignment that you said, even I didn't understand exactly, but perhaps what you said can be resolved by pressing the back button and revisiting the rule by pressing the edit button again, in the current version Rule Plotter 1.7, will make it have more fields available for add more AND/OR logic
MickeBo
120
MickeBo 2024.03.02 19:35 
 

I highly recommend this tool and I'm glad to be able to use it! The purpose of this tool is to enter and save an existing strategy in order to then receive current entry signals in the form of arrows during operation according to the parameters I previously entered. It took me a while at the beginning to understand how to enter the parameters and I had a lot of help from Francisco, thank you very much for that! Once everything was entered and saved, everything worked perfectly. I receive entry arrows according to my strategy and I am very happy about this as it makes trading much clearer and easier for me. I don't want to miss it anymore, a really great tool that's worth trying. It is also possible to do a backtest with the saved parameters using the Rule Plotter EA and thus test the entered strategy - what more could you want? I can also highly recommend Francisco, his programming is flawless, he is very helpful and patient and I will always be happy to come back to him if there is a need for an indicator or an EA. Thank you, Francisco, for everything!!

Francisco Gomes Da Silva
72737
Geliştiriciden yanıt Francisco Gomes Da Silva 2024.03.03 20:52
Thank you so much for sharing your experience with Rule Plotter, MickeBo! I truly appreciate your fantastic review and the time you took to provide it. Your feedback means a lot to me, and I am thrilled to hear that you found the tool helpful in your trading journey. I also want to extend our gratitude for your patience and cooperation throughout the process. It's customers like you that motivate us to continually improve and provide the best service possible. If you ever need further assistance or have any questions, please don't hesitate to reach out. We're here to help and support you every step of the way. Thanks again for choosing Rule Plotter, and I wish you continued success in your trading endeavors!
Evgeny Belyaev
87639
Evgeny Belyaev 2023.11.01 00:16 
 

Convenient tool.

Francisco Gomes Da Silva
72737
Geliştiriciden yanıt Francisco Gomes Da Silva 2023.11.01 08:54
thank you for your reviews Evgeny Belyaev
İncelemeye yanıt
Sürüm 1.9 2024.03.10
+ Temiz kuralları kaydet
- Strateji sıfırın varsayılan değerle doldurulmasını önle
Sürüm 1.7 2024.02.22
Artık pozisyonu kapatmak için bir sinyal kuralı tanımlamak mümkün.
Sürüm 1.6 2024.02.19
Daha fazla göstergeyle uyumluluk
Sürüm 1.5 2024.02.06
Bu sürümde, stratejiyi foruma eklemek için kabul edilen bir format olduğu için .txt formatında dışa aktarıyoruz.
Sürüm 1.4 2024.01.31
- Gösterge penceresindeki değer şimdi fare konumundaki grafik noktasında güncelleniyor
Sürüm 1.3 2023.12.02
+ Mum kapanınca mum ilerleme uyarısını tekrar kontrol edin.
Sürüm 1.2 2023.11.30
Bir sinyal oku göründüğünde:
+ Ses Bildirimi
+ MetaTrader'da Uyarı
+ Akıllı Telefon Bildirimi
+ E-posta Uyarısı
Sürüm 1.1 2023.11.26
Stratejileri içe ve dışa aktarmak için düzen