• Genel bakış
  • İncelemeler
  • Yorumlar

Control Candle Multiple Inside Bars

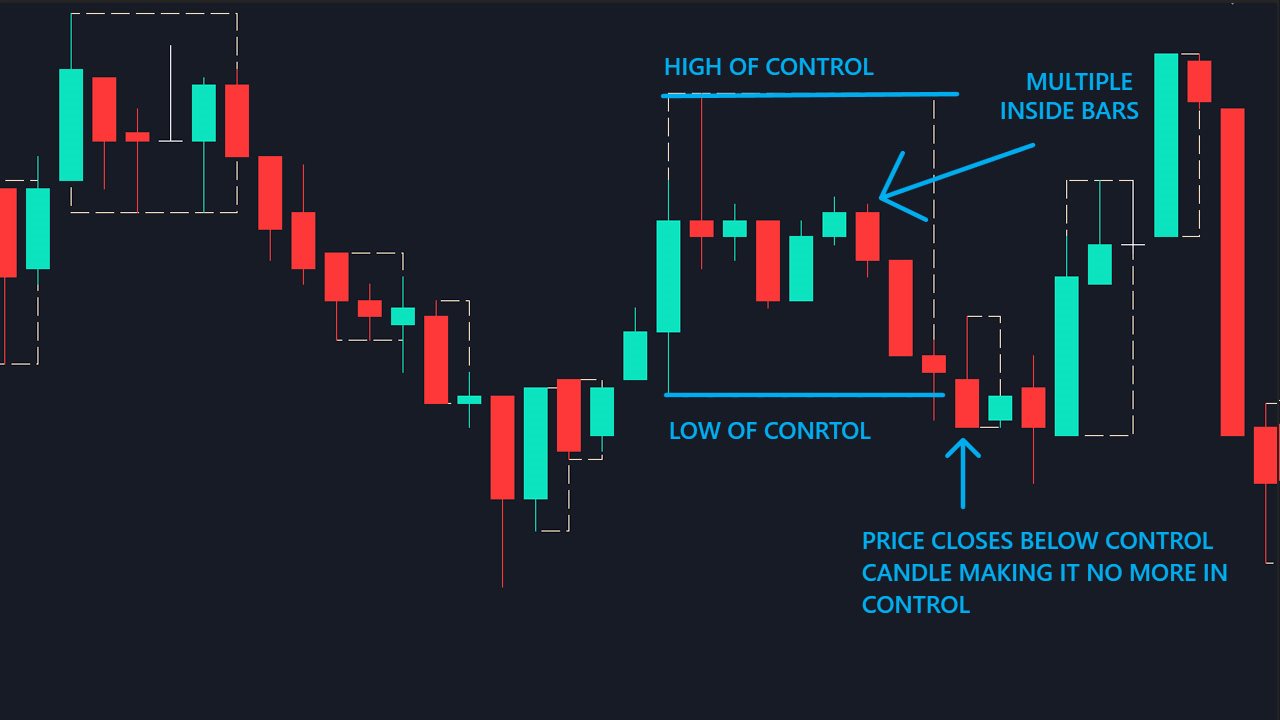
Control Candle is the candlestick which holds multiple inside bars and are in control until its high low range is broken by close of any candlestick.

When control candle is broken, price may act on these control candle as support and resistance.

This indicator create rectangles on chart which will help you find control candles fast.


Control candle indicator box is customizable by color, style, width and other options in indicator settings.

Önerilen ürünler
KT Raff Channel MT5
KEENBASE SOFTWARE SOLUTIONS
The KT Raff Channel is an enhanced and refined iteration of the original Raff channel concept pioneered by Gilbert Raff in 1996. This indicator builds upon Raff's initial work, incorporating modifications and advancements to provide traders with a more sophisticated and powerful tool. Gilbert Raff, a renowned name in the field of financial market analysis, is the developer of the Raff Regression Channel. This technical tool is designed for discerning and validating possible market price trends.
My PVSR
Ashok Kumar Singha
My PVSR   is based on All Type of Pivot Points. Use this Indicator to get proper Support / Resistance Zone and Trade accordingly.. Recommendation: Use this Indicator along with my another Indicator --->>> Dr. Trend   <<<--- Click Here ; To get the best output result feel free to contact me ; Best of Luck It can be used for: All Pairs: Forex, Cryptocurrencies, Metals, Stocks, Indices etc. All Timeframe All Brokers All type of Trading Style like Scalping, Swing, Intraday, Short-Term, Lon
KT Price Border MT5
KEENBASE SOFTWARE SOLUTIONS
KT Price Border creates a three-band price envelope that identifies potential swing high and low areas in the market. These levels can also be used as dynamic market support and resistance. The mid-band can also be used to identify the trend direction. As a result, it also functions as a trend-following indicator. In addition, its ease of use and more straightforward conveyance of trade signals significantly benefit new traders. Features It works well on most of the Forex currency pairs. It
CandelTimer MT5
Kambiz Shahriarynasab
300 downloads without review ? !!!! If continued. I will not share any product for free. :( Small and very simple timer next to the current price to show the end time of the current candle Very useful and important for scalpers and those who work on price action.   We assure you that we welcome any suggestions to improve this indicator and make the necessary changes to improve this indicator. You can contact us via Instagram, Telegram, WhatsApp, email or here. We are ready to answer you.
Bollinger Bands Alert MT5
KEENBASE SOFTWARE SOLUTIONS
KT Bollinger Bands Alert is a modified version of the classic Bollinger Bands added with price touch alerts and visible price tags for each band separately. Alert Events When the current price touches the upper Bollinger band. When the current price touches the middle Bollinger band. When the current price touches the lower Bollinger band. Features Separate alert events for each band. Ability to specify a custom interval between each alert to prevent repetitive and annoying alerts. Added
Multi Temporalities Osw MT5
William Oswaldo Mayorga Urduy
MULTI-TIMES FOR METATRADER 5 This indicator, in a lower window, shows the current chart in different timeframes, this can help you better decipher the market, taking into account the higher timeframes. Among the settings that you can modify are: view of prices in charts view of the temporalities in the graphs enable each of the graphics in the different temporalities (M1, M5, M15, H1, H4, D1, W1, MN1).
Hello There, i introduce about Swing Premium Forex Mt5 Indicator it work all currency pair it work all time frame, 100% non repaint, no delay Swing trading is a method in which traders attempt to take advantage of market fluctuations. They buy a security when they believe the market will rise and sell if they feel the market will fall, which, as you can imagine, is common in most trading strategies, irrespective of trading style. The four most frequently occurring patterns in the swing t
Three Candles Pattern
Edson Cavalca Junior
5 (1)
The patterns of 3 (three) Candles: Three White Soldiers; Three Black Crows; These are reversal patterns widely used by traders, as they have a high probability of showing the inversion of the current market movement. For example, if in a bullish trend there are three black crows, there is a high probability of reversing the current bullish movement. The Three White Soldiers have the following characteristics: There are 3 consecutive candles with a good body, that is, the difference between
Volatility Index Pro Indicator
Savia Forex Software Solutions
Volatility Index Pro Indicator The Savia Forex Solutions Volatility Index Pro Indicator gives you highly accurate entries on all Volatility Indices and Jump Indices. The Volatility Index Pro Indicator is dynamic and powerful and is optimized for all timeframes. Trade with improved confidence and maximize your success rate. Benefits Dynamic and Powerful. Volatility Index Pro Indicator is fully optimized for all chart timeframes. Volatility Index Pro Indicator works with Volatility Indices and Jum
The Retracement Feeder  checks for retracement opportunities after the first move has occurred.  Basically it scans for the second wave of trend. Works with any financial instrument,  It does not repaint/change color or cancel arrows, Easy to set and use. Works great with Renko Charts MT4 version:  https://www.mql5.com/en/market/product/67443 How it works The indicator is based on RSI and Stochastics.  The algorithm used in the Retracement Feeder allows the Stochastic and RSI to minimize the t
Price Break MT5
Miguel Antonio Rojas Martinez
The "Price Break" indicator is a powerful tool for any trader. If the price breaks the levels the indicator shows, there is aproximatelly a 77% chance it will go in the same direction. If it exceeds the blue line, there are many possibilities for the price to rise. On the contrary, if it passes down the red line, it means that there are many possibilities for the price to drop. We should always consider the latest indicator signal, so we should rely only on the last blue arrow and the last red a
Limitless MT5
Dmitriy Kashevich
Limitless MT5 is a universal indicator suitable for every beginner and experienced trader. works on all currency pairs, cryptocurrencies, raw stocks Limitless MT5 - already configured and does not require additional configuration And now the main thing Why Limitless MT5? 1 complete lack of redrawing 2 two years of testing by the best specialists in trading 3 the accuracy of correct signals exceeds 80% 4 performed well in trading during news releases Trading rules 1 buy signa
Ali Levels Pro is an indicator designed to identify and draw levels of interest including: Opening Range High/Low with seconds precision,  Previous Session High/Low (if you are a Intraday trader who trades Indices or Commodities maybe you want to know yesterday New York Session high and low),  Overnight Session High/Low,  Previous Day High/Low,  Previous Week High/Low, and  Previous Month High/Low. Traders use this levels as support and resistance levels.  By searching for confluences between
The indicator is designed to close positions on the market in time. For example: to take profits ahead of schedule if the price has not reached TakeProfit, and the market is turning around. The indicator analyzes the momentum, not the trend. He does not give any information about the trend. The indicator is well suited for finding divergence. The Ershov 38 Parrots indicator dynamically adjusts to the market and detects price movement impulses of medium and high amplitude. It almost does not rea
SR levels true
Egidijus Bikulcius
Indicator SR levels true in small time frames is very useful for scalping while in bigger ones it is good for day or position trading. SR levels true can draw 4 support/resistance levels based on defined maximum rebouds from price level. Indicator scans  defined number of bars in time axis and defined number of pips in price axis (both sides - up and down) and calculates how much times price was rejected from scanned price levels. At the price levels where maximum rebounds are counted, support
Bu gösterge, aynı grafikte izlemek istediğiniz diğer zaman dilimi mum çubuklarını verimli bir şekilde izler 1. Aynı grafikteki çubukları yüklemek için daha yüksek bir zaman dilimini seçin 2. Şamdanların renklerini ve stilini özelleştirin 3. Şamdanları çizmek için çubuk sayısını seçin 4. Daha yüksek zaman dilimindeki komple mumları fitil ve gövdeyle birlikte takip edin 5. Grafiği değiştirmek istemeyenler için kolay ve kullanışlı.
KT Asian Breakout indicator scans and analyzes a critical part of the Asian session to generate bi-directional buy and sell signals with the direction of a price breakout. A buy signal occurs when the price breaks above the session high, and a sell signal occurs when the price breaks below the session low. MT4 Version is available here  https://www.mql5.com/en/market/product/41656 Things to remember If the session box is vertically too wide, a new trade should be avoided as most of the price
Five Candles Pattern MT5
Miguel Antonio Rojas Martinez
The "Five Candle Pattern" indicator is a novel way to see the market, because with it we can compare and/or seek training or the pattern of the past 4 or 5 Candles, and identify them in the same graph, to view your behavior at an earlier time. The indicator creates a pattern of those 4 or 5 candles and searches backward, identifies, and marks the same formation or pattern. With that information you adjust the strategy that is operating, or create a new one, because you can compare the past devel
Candle Timer MT5
KEENBASE SOFTWARE SOLUTIONS
KT Candle Timer shows the remaining time in the closing of the current bar. You can use the bar closing time for multiple purposes, including time and trade management during the trading hours. Features It also shows the Symbol spreads along with the remaining time. It offers two convenient timer display positions, i.e., chart corner or next to the current bar. From colors to text size, it offers full customization according to user preferences. It is optimized to work without using extensiv
This indicator identifies and displays zones, as it were areas of strength, where the price will unfold. The indicator can work on any chart, any instrument, at any timeframe. The indicator has two modes. The indicator is equipped with a control panel with buttons for convenience and split into two modes. Manual mode: To work with manual mode, you need to press the NEW button, a segment will appear. This segment is stretched over the movement and the LVL button is pressed. The level is displayed
//////////////////////////////////////////////// //////////////////////////////////////////////// ///////////////////////////////////// Go My Way is an ultra-accurate indicator of trend direction or price movement. This indicator is calculated on the basis of a dozen other indicators and has a very complex mechanism. //////////////////////////////////////////////// //////////////////////////////////////////////// ///////////////////////////////////// The settings are very simple, but it
- This is an implementation of OCC ==> open close cross - This indicator applies twelve different averaging methods to open and close prices separately to signal the trend switching. - All MA methods are set as input as well as period and different offsets applied to linear regression and ALMA averaging. - Buffers 16 and 17 can be used in EAs to detect trend direction. - You can message in private chat for further changes you need.
Trigger Cash
Felipe Correa Carneiro
Triggers are business rules that you define for immediate execution after tickets are created or updated. For example, a trigger can be used to notify the customer when a ticket has been opened. The other can be created to notify the customer when the ticket is resolved. This program indicates to the user when a trend reversal trigger is triggered. This program gave me a lot of comfort in my trades on the mini index. Take the free back-test !! Thanks in advance for your attention!
Altın Hedefler en iyi trend göstergesidir. Göstergenin benzersiz algoritması, teknik ve matematiksel analiz faktörlerini dikkate alarak varlık fiyatının hareketini analiz eder, en karlı giriş noktalarını belirler, ok şeklinde bir sinyal ve fiyat seviyesini (SATIN ALMA Girişi / SAT Girişi) verir. bir sipariş açın. Gösterge aynı zamanda Zararı Durdur için fiyat seviyesini ve Kâr Al için beş fiyat seviyesini anında görüntüler. DİKKAT:   Göstergenin kullanımı çok kolaydır. Göstergeyi tek tıklamay
Pips on Candles shows the number of pips involved in each candle on the chart. It is possible to set 3 different ranges for counting on each single candle via the RangeType parameter: With "HighLow" you count the pips present between the minimum and the maximum. The number is shown under each candlestick on the chart. With "OpenClose" you count the pips present between the opening and closing price of the candle. The number is shown under each candlestick on the chart. With "HighDistAndLowDist"
Italo Volume Indicator MT5
Italo Santana Gomes
4.73 (15)
BUY INDICATOR AND GET EA FOR FREE AS A BONUS + SOME OTHER GIFTS! ITALO VOLUME INDICATOR  is the best volume indicator ever created, and why is that? The Indicator works on all time-frames and assets, indicator built after 7 years of experience on forex and many other markets. You know many volume indicators around the internet are not complete, does not help, and it's difficult to trade, but the Italo Volume Indicator is different , the Italo Volume Indicator shows the wave volume, when market
Introduce This is a trading assistant, information panel indicators, aggregate currency statistics, account statistics, position information, server and local time, currency strength, K-line remaining time, support and resistance lines, server time offset, currency fluctuations Rate and other functions. Can be used for all types of accounts and currencies. Excellent performance, very few resources You can customize the position, color, font size Any module can be individually displayed or disab
It's a multi-symbol and multi-timeframe scanner for our indicator - ACB Breakout Arrows . With default settings, it scans for the buy/sell signals on 28 currency pairs and 9 time-frames concurrently.   Features It can scan 252* combinations of symbols and time-frames from a single chart. Open the signal's chart loaded with a predefined template with a single click.  Easy drag n drop anywhere on the chart. Real-time alerts with popup, sound, push-notifications and email alerts.  Input Para
CZSC Fraktal tip indeksi Özellikler: Dahil etme ilişkisinin kapsamlı bir şekilde işlenmesini gerçekleştirdi "Stok Yapmayı Öğretmek 93: İki Tablo Arasındaki İlişki ve Trend Yapısının İçi 2" deki durumu ve üst-alt bir sınıflandırma olup olmadığını değerlendirmek için EA çağrısını kullanmak uygundur. Yukarıdan aşağıya sınıflandırmayı oklarla göster Olası kalemleri farklı renklerde göster İki bitişik K-çizgisinin dahil etme ilişkisi bir tanım verir: bir K-çizgisinin yüksek ve alçak nokt
The indicator scans for Dinapoli thrust pattern in multiple timeframes for a specific market. Key Features Indicator can be used for all markets It can scan for thrust pattern on W1, D1, H4, H1, M30, M15 and M5 timeframes Ability to choose number of bars required above/below displaced moving average to define thrust Able to move display label on chart by single click Parameters Minimum Bars: Least amount of bars to account for Thrust DMA Period: Moving average period DMA Shift: Number or bars re
Bu ürünün alıcıları ayrıca şunları da satın alıyor
Öncelikle, bu Ticaret Sistemi'nin Non-Repainting, Non-Redrawing ve Non-Lagging Göstergesi olduğunu vurgulamak önemlidir, bu da hem manuel hem de robot ticareti için ideal hale getirir. "Smart Trend Trading System MT5", yeni ve deneyimli tüccarlar için özelleştirilmiş kapsamlı bir ticaret çözümüdür. 10'dan fazla premium göstergeyi birleştiriyor ve 7'den fazla sağlam ticaret stratejisi sunuyor, bu da çeşitli piyasa koşulları için esnek bir seçim yapar. Trend Takip Stratejisi: Trendleri etkili bir
Öncelikle belirtmek gerekir ki bu Ticaret Göstergesi Yeniden Çizim Yapmaz, Gecikmez ve Gecikme Göstermez, bu da hem manuel hem de robot ticareti için ideal hale getirir. Atom Analisti, Piyasada Daha İyi Bir Avantaj Bulmak İçin Fiyatın Gücünü ve Momentumunu Kullanan PA Fiyat Hareketi Göstergesidir. Gürültüleri ve Yanlış Sinyalleri Kaldırmaya ve Ticaret Potansiyelini Artırmaya Yardımcı Olan Gelişmiş Filtrelerle Donatılmıştır. Birden fazla katmanlı karmaşık göstergeler kullanarak, Atom Analisti
FX Volume MT5
Daniel Stein
4.94 (17)
Sabah Brifingimiz aracılığıyla ayrıntılar ve ekran görüntüleri ile günlük piyasa güncellemenizi alın burada mql5 ve on Telegram ! FX Volume, bir brokerin bakış açısından piyasa duyarlılığı hakkında GERÇEK bir fikir veren İLK ve TEK hacim göstergesidir. COT raporlarından çok daha hızlı bir şekilde, brokerlar gibi kurumsal piyasa katılımcılarının Forex piyasasında nasıl konumlandıklarına dair harika bilgiler sağlar. Bu bilgileri doğrudan grafiğinizde görmek, ticaretiniz için gerçek oyun değiştir
Quantum Trend Sniper
Bogdan Ion Puscasu
5 (37)
Tanıtım       Kuantum Trend Keskin Nişancı Göstergesi   , trend tersine dönmeleri belirleme ve ticaret yapma şeklinizi değiştiren çığır açan MQL5 Göstergesi! 13 yılı aşkın ticaret tecrübesine sahip deneyimli tüccarlardan oluşan bir ekip tarafından geliştirilmiştir.       Kuantum Trend Keskin Nişancı Göstergesi       trend dönüşlerini son derece yüksek doğrulukla belirlemenin yenilikçi yolu ile ticaret yolculuğunuzu yeni zirvelere taşımak için tasarlanmıştır. ***Kuantum Trend Keskin Nişancı Gö
Trend Screener Pro MT5
STE S.S.COMPANY
4.89 (61)
Trend Göstergesi, Trend Alım Satım ve Filtreleme için Çığır Açan Benzersiz Çözüm, Tüm Önemli Trend Özellikleriyle Tek Bir Araç İçinde Yerleştirildi! Forex, emtialar, kripto para birimleri, endeksler ve hisse senetleri gibi tüm sembollerde/araçlarda kullanılabilen %100 yeniden boyamayan çoklu zaman çerçevesi ve Çoklu para birimi göstergesidir. Trend Screener, grafikte noktalarla ok trend sinyalleri sağlayan etkili bir trend trend göstergesidir. Trend analizörü göstergesinde bulunan özellikler: 1.
FX Power MT5 NG
Daniel Stein
5 (4)
Sabah Brifingimiz burada mql5 ve on Telegram! FX Power MT5 NG , uzun zamandır çok popüler olan döviz gücü ölçerimiz FX Power'ın yeni neslidir. Peki bu yeni nesil güç ölçer ne sunuyor? Orijinal FX Power hakkında sevdiğiniz her şey PLUS GOLD/XAU güç analizi Daha da hassas hesaplama sonuçları Ayrı ayrı yapılandırılabilir analiz dönemleri Daha da iyi performans için özelleştirilebilir hesaplama limiti Özel çokluDaha fazlasını görmek isteyenler için örnek ayarlar Her grafikte en sevdiğiniz renkler i
Top indicator for MT5   providing accurate signals to enter a trade without repainting! It can be applied to any financial assets:   forex, cryptocurrencies, metals, stocks, indices .  Watch  the video  (6:22) with an example of processing only one signal that paid off the indicator! MT4 version is here It will provide pretty accurate trading signals and tell you when it's best to open a trade and close it. Most traders improve their trading results during the first trading week with the help of
Öncelikle, bu Ticaret Aracının Non-Repainting, Non-Redrawing ve Non-Lagging Gösterge olduğunu vurgulamakta fayda var, bu da onu profesyonel ticaret için ideal hale getiriyor. Akıllı Fiyat Hareketi Kavramları Göstergesi, hem yeni hem de deneyimli tüccarlar için çok güçlü bir araçtır. İleri ticaret fikirlerini, Inner Circle Trader Analizi ve Smart Money Concepts Ticaret Stratejileri gibi 20'den fazla kullanışlı göstergeyi bir araya getirerek bir araya getirir. Bu gösterge, büyük kurumların tica
RelicusRoad Pro MT5
Relicus LLC
4.82 (22)
Şimdi 147 $ (birkaç güncellemeden sonra 499 $ 'a yükseliyor) - Sınırsız Hesaplar (PC'ler veya Mac'ler) RelicusRoad Kullanım Kılavuzu + Eğitim Videoları + Özel Discord Grubuna Erişim + VIP Durumu PİYASAYA BAKMAK İÇİN YENİ BİR YOL RelicusRoad, forex, vadeli işlemler, kripto para birimleri, hisse senetleri ve endeksler için dünyanın en güçlü ticaret göstergesidir ve yatırımcılara kârlı kalmaları için ihtiyaç duydukları tüm bilgileri ve araçları sağlar. Başlangıç ​​seviyesinden ileri seviyey
Auto Order Block with break of structure based on ICT and Smart Money Concepts Futures Break of Structure ( BoS )             Order block ( OB )            Higher time frame Order block / Point of Interest ( POI )    shown on current chart           Fair value Gap ( FVG ) / Imbalance   ,  MTF      ( Multi Time Frame )    Volume Imbalance     ,  MTF          vIMB Gap’s Equal High / Low’s     ,  MTF             EQH / EQL Liquidity               Current Day High / Low           HOD /
XQ Indicator MetaTrader 5
Marzena Maria Szmit
5 (1)
Step into the realm of Forex trading with confidence and precision using XQ, a cutting-edge Forex indicator designed to elevate your trading game to unprecedented heights. Whether you're a seasoned trader or just stepping into the world of currency exchange, XQ Forex Indicator empowers you with the insights and signals needed to make informed trading decisions. The signal conditions are a combination of three indicators, and XQ Forex Indicator only display  medium and long-term trends . The ind
Blahtech Supply Demand MT5
Blahtech Limited
4.57 (14)
Was: $299  Now: $99   Supply Demand uses previous price action to identify potential imbalances between buyers and sellers. The key is to identify the better odds zones, not just the untouched ones. Blahtech Supply Demand indicator delivers functionality previously unavailable on any trading platform. This 4-in-1 indicator not only highlights the higher probability zones using a multi-criteria strength engine, but also combines it with multi-timeframe trend analysis, previously confirmed swings
Advanced Supply Demand MT5
Bernhard Schweigert
4.53 (15)
Herhangi bir Acemi veya Uzman Tüccar için En İyi Çözüm! Bu gösterge benzersiz, yüksek kaliteli ve uygun fiyatlı bir ticaret aracıdır çünkü bir dizi tescilli özelliği ve yeni bir formülü bir araya getirdik. Bu güncelleme ile çift zaman dilimi dilimlerini gösterebileceksiniz. Yalnızca daha yüksek bir TF gösteremeyeceksiniz, aynı zamanda TF grafiğini ve ARTIK daha yüksek TF'yi de gösterebileceksiniz: YUVARLAK BÖLGELERİ GÖSTERMEK. Tüm Arz Talebi tüccarları buna bayılacak. :) Önemli Bilgiler Açıkland
AW Trend Predictor MT5
AW Trading Software Limited
4.76 (54)
Tek bir sistemde trend ve kırılma seviyelerinin kombinasyonu. Gelişmiş bir gösterge algoritması piyasa gürültüsünü filtreler, trendi, giriş noktalarını ve olası çıkış seviyelerini belirler. Gösterge sinyalleri, sinyal geçmişinin etkinliğini gösteren en uygun enstrümanların seçilmesine izin veren bir istatistiksel modüle kaydedilir. Gösterge Kâr Al ve Zararı Durdur işaretlerini hesaplar. Kılavuz ve talimatlar ->   BURAYA   / MT4 versiyonu ->   BURAYA Gösterge ile nasıl ticaret yapılır: Trend Pre
ICT, SMC, SMART MONEY CONCEPTS, SMART MONEY, Smart Money Concept, Support and Resistance, Trend Analysis, Price Action, Market Structure, Order Blocks, BOS/CHoCH,   Breaker Blocks ,  Momentum Shift,   Supply&Demand Zone/Order Blocks , Strong Imbalance,   HH/LL/HL/LH,    Fair Value Gap, FVG,  Premium  &   Discount   Zones, Fibonacci Retracement, OTE, Buy Side Liquidity, Sell Side Liquidity, BSL/SSL Taken, Equal Highs & Lows, MTF Dashboard, Multiple Time Frame, BigBar, HTF OB, HTF Market Structure
TPSpro TRENDPRO  - is a trend indicator that automatically analyzes the market and provides information about the trend and each of its changes, as well as giving signals for entering trades without redrawing! The indicator uses each candle, analyzing them separately. referring to different impulses - up or down impulse. Exact entry points into transactions for currencies, crypto, metals, stocks, indices!  -  Version MT4                  DETAILED DESCRIPTION        /       TRADING SETUPS       
Gann Kare Göstergesi, W.D. Gann tarafından yazılan "Piyasa Tahminleri için Matematiksel Formül" makalesine dayalı güçlü bir piyasa analizi aracıdır. Bu araç, piyasa analizi için matematiksel ve Gann teorilerini kullanarak hassas analizler gerçekleştirir. 144, 90, 52 karelerini ve ayrıca 9 karesini kullanır. Ayrıca, ın 9 karesi ve bu kareyle ilişkili kanallar ve yıldız modelleri için yöntemini içerir. Kullanıcı Kılavuzu ve Uygulama: Bu göstergeleri kullanmadan önce, kullanıcı kılavuzunu okumanız
Fiyat tersine döndükçe ve geri çekildikçe piyasa yapısından elde edilen kâr değişir. Piyasa yapısını tersine çevirme uyarısı göstergesi, bir trendin veya fiyat hareketinin ne zaman tükenmeye yaklaştığını ve tersine dönmeye hazır olduğunu tanımlar. Genellikle bir geri dönüş veya büyük bir geri çekilme meydana gelmek üzereyken meydana gelen piyasa yapısındaki değişiklikler konusunda sizi uyarır. Gösterge, olası bir tükenme noktasının yakınında her yeni yüksek veya düşük oluştuğunda, başlangıçta
Grafiğinizde otomatik olarak destek ve direnç seviyeleri PLUS itici mum boşlukları çizin, böylece fiyatın nereye gidebileceğini ve / veya potansiyel olarak tersine dönebileceğini görebilirsiniz. Bu gösterge, web sitemde (The Market Structure Trader) öğretilen pozisyon ticareti metodolojisinin bir parçası olarak kullanılmak üzere tasarlanmıştır ve hedefleme ve potansiyel girişler için temel bilgileri görüntüler. MT4 Version:  https://www.mql5.com/en/market/product/97246/ Göstergede 2 TEMEL öze
A key element in trading is zones or levels from which decisions to buy or sell a trading instrument are made. Despite attempts by major players to conceal their presence in the market, they inevitably leave traces. Our task was to learn how to identify these traces and interpret them correctly. Reversal First Impulse levels (RFI)   -  Version MT4                  INSTRUCTIONS                 RUS                 ENG                         R ecommended to use with an indicator   -  TREND PRO  
Tanıtım       Quantum Breakout PRO   , Breakout Bölgeleri ile ticaret yapma şeklinizi değiştiren çığır açan MQL5 Göstergesi! 13 yılı aşkın ticaret tecrübesine sahip deneyimli tüccarlardan oluşan bir ekip tarafından geliştirilmiştir.       Kuantum Breakout PRO       yenilikçi ve dinamik koparma bölgesi stratejisiyle ticaret yolculuğunuzu yeni zirvelere taşımak için tasarlanmıştır. Kuantum Breakout Göstergesi, size 5 kar hedefi bölgesi ile kırılma bölgelerinde sinyal okları ve kırılma kutusuna
The Volume by Price Indicator for MetaTrader 5 features Volume Profile and Market Profile TPO (Time Price Opportunity). Get valuable insights out of currencies, equities and commodities data. Gain an edge trading financial markets. Volume and TPO histogram bar and line charts. Volume Footprint charts. TPO letter and block marker charts including split structures. Versatile segmentation and compositing methods. Static, dynamic and flexible ranges with relative and/or absolute visualizations. Lay
Owl Smart Levels MT5
Sergey Ermolov
4.47 (36)
MT4 versiyonu  |  FAQ Owl Smart Levels Indicator , Bill Williams'ın gelişmiş fraktalları , piyasanın doğru dalga yapısını oluşturan Valable ZigZag ve kesin giriş seviyelerini gösteren Fibonacci seviyeleri gibi popüler piyasa analiz araçlarını içeren tek gösterge içinde eksiksiz bir ticaret sistemidir. pazara ve kar elde edilecek yerlere. Stratejinin ayrıntılı açıklaması Gösterge ile çalışma talimatı Baykuş Yardımcısı ticaretinde Danışman Yardımcısı Kullanıcıların özel sohbeti -> Satın aldıktan
TrendLine PRO MT5
Evgenii Aksenov
4.78 (49)
The Trend Line PRO indicator is an independent trading strategy. It shows the trend change, the entry point to the transaction, as well as automatically calculates three levels of Take Profit and Stop Loss protection Trend Line PRO is perfect for all Meta Trader symbols: currencies, metals, cryptocurrencies, stocks and indices Advantages of Trend Line PRO Never redraws its signals The possibility of using it as an independent strategy It has three automatic levels Take Profit and Stop Loss lev
Gartley Hunter Multi
Siarhei Vashchylka
5 (5)
Gartley Hunter Multi - An indicator for searching for harmonic patterns simultaneously on dozens of trading instruments and on all classic timeframes: (m1, m5, m15, m30, H1, H4, D1, Wk, Mn). Manual (Be sure to read before purchasing) | Version for MT4 Advantages 1. Patterns: Gartley, Butterfly, Shark, Crab. Bat, Alternate Bat, Deep Crab, Cypher 2. Simultaneous search for patterns on dozens of trading instruments and on all classic timeframes 3. Search for patterns of all possible sizes. Fr
Trend Line Map Pro MT5
STE S.S.COMPANY
4.67 (9)
Trend Line Map indicator is an addons for   Trend Screener Indicator . It's working as a scanner for all signals generated by Trend screener ( Trend Line Signals ) . It's a Trend Line Scanner based on Trend Screener Indicator.  If you don't have Trend Screener Pro Indicator,   the Trend Line Map Pro will not work.     LIMITED TIME OFFER : Trend Line Map Indicator is available for only 50 $ and lifetime. ( Original price 125$ ) By accessing to our MQL5 Blog,  you can find all our premium indica
TrendDecoder Premium MT5
Christophe, Pa Trouillas
5 (1)
Aralıkları ve bir sonraki olası hamleleri belirleyin     |    Trendlerin en erken sinyallerini ve gücünü alın     |    Geri dönüşten önce net çıkışlar alın     |    Fiyatın test edeceği Fibo seviyelerini tespit edin   |  Gecikmesiz, takip edilmeyen gösterge - manuel ve otomatik ticaret için ideal - tüm varlıklar ve tüm zaman birimleri için uygun 50 İNDİRİM   - lansman için sonra tekrar   >>   149 $ Satın aldıktan sonra, kişiselleştirilmiş ayarlar için   bu kanaldan benimle iletişime geçin . MT4
MetaBands M5
Vahidreza Heidar Gholami
4.67 (3)
MetaBands uses powerful and unique algorithms to draw channels and detect trends so that it can provide traders with potential points for entering and exiting trades. It’s a channel indicator plus a powerful trend indicator. It includes different types of channels which can be merged to create new channels simply by using the input parameters. MetaBands uses all types of alerts to notify users about market events. Features Supports most of the channel algorithms Powerful trend detection algorith
Was: $249  Now: $99   Market Profile defines a number of day types that can help the trader to determine market behaviour. A key feature is the Value Area, representing the range of price action where 70% of trading took place. Understanding the Value Area can give traders valuable insight into market direction and establish the higher odds trade. It is an excellent addition to any system you may be using. Inspired by Jim Dalton’s book “Mind Over Markets”, this indicator is designed to suit the
TPA True Price Action indicator reveals the true price action of the market makers through 100% non-repainting signals strictly at the close of a candle! TPA shows entries and re-entries, every time the bulls are definitely stronger than the bears and vice versa. Not to confuse with red/green candles. The shift of power gets confirmed at the earliest stage and is ONE exit strategy of several. There are available now two free parts of the TPA User Guide for our customers. The first "The Basics"
Yazarın diğer ürünleri
Bu kütüphane, herhangi bir EA'nızı kullanarak işlemleri yönetmenize izin verecektir ve açıklamalarda belirtilen komut dosyası koduyla ve ayrıca tüm süreci gösteren videodaki demo örnekleriyle kendi başınıza yapabileceğiniz herhangi bir EA'ya entegrasyonu çok kolaydır. - Limit Ver, SL Limit Ver ve Kar Al Limit Emirleri - Market, SL-Market, TP-Market siparişlerini verin - Limit emrini değiştirin - Siparişi iptal et - Siparişleri Sorgula - Kaldıraç, marjı değiştir - Pozisyon bi
MT5 için Kripto Para Tabloları. Özellikler : 1. Websocket (wss) aracılığıyla canlı OHLC Grafiği 2. API'den Barların Geçmişini Güncelleyin 3. Çubuklarda eksik veri olmadığından ve yerel grafik gibi her zaman güncel tutulduğundan emin olmak için MT5 yeniden başlatıldığında grafiklerde Otomatik Güncelleme geçmişi 4. API'den Zamanlanmış Geçmiş Güncellemesi : Bir milisaniye süreyle internet bağlantısının kesilmesi durumunda, websocket akış protokolü olduğundan bar ohlc değeri hatalı ol
Çoklu Para Birimi Önceki Mum veya Önceki Çubuk Tarayıcı, gösterge ayarlarından seçtiğiniz herhangi bir özel zaman diliminde çoklu sembol grafiklerini taramanıza yardımcı olur. Ürün bazında: https://www.mql5.com/en/market/product/110229 Önceki Günün en yüksek en düşük, Önceki haftanın en yüksek en düşük, Önceki ayın En yüksek en düşük veya herhangi bir özel zaman dilimi için çoklu sembolleri taramak için kullanılabilir; Önceki 4 saatlik grafik yüksek düşük Gürültüyü filtreler ve fiyat Y
Perfect Seconds grafik göstergesi, dakika mumlarını saniyelere dönüştürmenize olanak tanır 1. Bir çubuğu doğru zamanla %100 kapatmak için istediğiniz sayıda saniyeyi seçin. 2. Bu oranlara dayalı bir veridir, işaretler mevcut olmasa bile çalışır. 3. Harici DLL gerekmez, VPS'de sorunsuz çalışır 4. Hızlı ve optimize edilmiş kod 5. BInance, Kucoin gibi Kripto Çiftlerini ve Vadeli İşlem grafiğinin kolayca saniyelere dönüştürülebildiği diğer tüm borsaları destekler. 6. Altın ve Forex
Bu kütüphane, herhangi bir EA'nızı kullanarak işlemleri yönetmenize olanak tanır ve açıklamada belirtilen komut dosyası koduyla ve ayrıca tüm süreci gösteren videodaki demo örnekleriyle kendi başınıza yapabileceğiniz herhangi bir EA'ya entegrasyonu çok kolaydır. Bu ürün, API aracılığıyla alım satım işlemlerine izin verir ve grafikler içermez. Kullanıcılar, Crypto grafikleri sağlayan ve Binance'e emir gönderen brokerlerin grafiklerini kullanabilir - Tek Yönlü ve Hedge Modunu destekler - Lim
This indicator finds Double Top and Double bottom Example : What is Double Top When price establishes a new high and then falls, then reverse to the same candle area of High then its considered a valid double top and vice versa for double bottom. 1. It plots and high and low on visible chart if ChartChange is set to true else it searches on new bar opening 2. If there is double top and double bottom found in visible chart window then it plots a line 3. It has options to customize text color, te
FREE
Gerçek Dönen Top Göstergesi Dönen topaçın gerçek anlamı olan dengeli gövde ve fitil yükseklik oranı ile grafik üzerinde doğru topacı algılar ve onu Hammers and Doji veya Null Candlestick'ten ayırır. Bu gösterge, grafikte bulunan topaç sayısına bir kanat simgesi çizer. Ayarlar şunları içerir: Çubuk Sayısı : Aramayı çubuk sayısına göre ayarlamak için Simgenin Rengi: simgenin rengini değiştir Simge kodu: simge için kanatların kodunu değiştirin
FREE
Bu göstergeyi grafiğe ekleyin ve ZigZag'ın ExtDepth Ayarını ayarlayın Fiyat trend çizgisi Üst, Alt veya Orta kanala dokunduğunda anında uyarı verir Özellikler : -Üst, alt veya orta satırda uyarıları etkinleştirin / devre dışı bırakın - Saniyeler içinde bir uyarıdan sonra duraklama ekleyin - Grafikteki düğme ile Trend kanalını Duraklat veya Duraklattan Kaldır - Giriş alanına puan ekleyerek erken uyarılar ekleyin, örneğin ETH fiyatı 2900.25 burada 25 rakamı "nokta", yani giriş alanına puan
EA için Kripto Para Birimi Canlı Tick Verileri Teklif ve Talep ve Rezervasyon Derinliği Mevcut Değişim: 1. Binance Spot (Aktif grafik penceresinde Emir Defteri Derinliğini destekler) ve Vadeli İşlemler (Birden fazla Emir Defteri Derinliğini destekler) 2. Kucoin Spot ve Vadeli İşlemler, Aktif grafik penceresinde Sipariş Defteri derinliğini destekler 3. Bybit Vadeli İşlemler ve Ters Vadeli İşlemler Verileri İşaretle Teklif Al Son Yaklaşan Borsa: OKX, MEXC ve daha fazlası.. Özelli
Çoklu Sembol Fiyat uyarısı ayarlamak ve Terminal Uyarısı veya Push Bildiriminden bildirim almak için grafikte herhangi bir yere Çift Tıklayın 1. EA Yardımcı Programını tabloya ekleyin 2. <- sol veya -> sağ ok tuşlarıyla çizelgeye göz atın 3. Grafikte herhangi bir yere çift tıklayın ve bir satır ekleyecektir, istediğiniz fiyatı ayarlamak için bu satırı sürükleyin ve işte, uyarı ayarlandı! Fiyat hatta ulaştığında, yardımcı programın ayarlarına göre terminal veya push bildirimi ile sizi bi
MT5 için Binance Ticaret Aracı 1. Bu ürün websocket'ten canlı grafik, tarihsel grafik, Binance'te sorunsuz bir şekilde işlem yapmanızı sağlayan sıfır manuel müdahale ile sorunsuz çalışmasını sağlamak için mt5 terminali yeniden başlatıldığında otomatik güncellemeler. Spot ve Vadeli İşlemler için Ticaret, Canlı Grafik ve Geçmiş Veriler Mevcuttur Nasıl kullanılır : 1. API anahtarınızı ve sırrınızı bu yardımcı programın Giriş alanına eklemeniz gerekir. API'nizi oluşturduğunuzda Vadeli İ
Cobra Levels
Rajesh Kumar Nait
Kobra Seviyeleri Bunlar, forex, kripto, emtia, şık ve banknifty dahil olmak üzere evrensel piyasada çalışan iki frekans moduna sahip 6 seviye setidir. Finansal araçlara ilişkin en iyi araştırmalardan sonra yayınlanırlar. Üst seviyeler U1 ila U5, alt seviyeler ise D1 ila D5 olarak adlandırılır. Piyasa, normal durumda U3 veya D3'e kadar iç kanallardan veya değişken durumda U4'ten U5'e veya D4'ten D5'e kadar dış kanallardan hareket edebilir. Fiyat U3 U4 U5 veya D3 D4 D5'e ulaştığında, geri d
Bu gösterge, tüccarın ihtiyacına göre grafiği daha temiz hale getirmek için etkinleştirilebilen / devre dışı bırakılabilen 6 seviyeye kadar çizer Bu 6 seviye 2 set halindedir: Yüksek ve Düşük Her set için farklı zaman aralığı seçilebilir Fiyatın Günlük, Haftalık veya Aylık En Düşük seviyeye ulaştığında genellikle 5dk gibi daha küçük bir zaman diliminde reddedildiği düşünüldüğünden, Önceki Yüksek Düşük tersine çevirme stratejisine dayanır. Özellikler : - Tek bir grafikte 6 Zaman Çerçev
Crypto.com'dan MT5'e Crypto.com websocket'ten Metatrader 5'e Canlı Şamdan Akışı OHCLV (Açık Yüksek Düşük Yakın Gerçek Hacim) Canlı Oran Verisi  tüccarlar, eğer bir dakikalık grafikte OHLC verileri doğru değilse, teknik tablo çalışmasında yanlış analiz verebilir, Bu ürün, manuel analizde yardımcı olabilecek gerçek zamanlı olarak doğru veriler verdiğini garanti eder diğer kripto ürünüme profilimden bakabilirsin https://www.mql5.com/en/users/rajeshnait/seller 1. OHLCV Verileri 2. Çoklu
Piyasa yapıları, daha yüksek bir zaman diliminde kırıldığında, bir tüccar için bir eğilimi temizlemeye yardımcı olabilecek yapılardır. 1. Bu gösterge ZigZag'ı yalnızca son 2 yapıya çekecektir (önceki ZigZag'ın en yüksek ve en düşük seviyesi) ve yeni bir ZigZag çubuğu yalnızca yapı kırılması gerçekleştiğinde oluşacaktır 2. Yapının bozulması durumunda Terminal ve Push bildirimi verir. 3. Salınımı ayarlamak için [ ve ] tuşlarından ZigZag Derinliğini Artırın ve Azaltın 4. Line AB BC ve C
Cobra Pivot Noktaları, DEMO'yu indirerek kendinizi test edebileceğiniz en iyi optimize edilmiş pivot noktalarını çizmeye yönelik bir göstergedir. 1. En İyi İki Pivot Modunu Seçin: Cobra Pivots veya Camrilla Pivots 2. D1 ile sınırlı olmamak üzere istediğiniz zaman dilimini kullanabilirsiniz. 3. Shift parametresi ile Önceki gün Yüksek Düşük Kapanış değeri ile oynayabilirsiniz. 1 = Önceki Çubuk, 2 = Önceki çubuktan önceki Çubuk vb.. Bu parametreler pivotlar üzerinde araştırma ve geliştirme
Pivot Noktaları Çoklu Sembol Tarayıcısı, Marketwatch'ta bulunan tüm sembolleri Floor, Woodie, Camarilla, Demark veya Fibonacci Pivot Noktaları için tarar. Pivot noktalarını hesaplamak için herhangi bir zaman dilimini seçebilir ve fiyat bu destek ve direnç seviyelerine dokunduğunda uyarı alabilirsiniz. Görsel Pivot Noktaları için Bu ürün ilginizi çekebilir: https://www.mql5.com/en/market/product/110231 Çeşitli uyarı türlerini seçme seçenekleri vardır Tarama sıklığını milisaniye cinsi
Simetrik üçgen, asimetrik üçgen veya dik açılı üçgen gibi Üçgen modeli için Model Gezgini, Yükselen kama veya Düşen kama gibi Kama modeli, Genişleme modeli ve Trend Kanalı Bu gösterge, mevcut kalıpların yanı sıra geçmiş kalıpları da araştırır, Trend çizgisini veya üçgeni manuel olarak çizerek zamandan tasarruf etmeye çalışanlar ve bunu grafikte en iyi kalıpları çizmenin otomatik analizi için kullanmak isteyenler için en iyi göstergedir. Özellikler : - En iyi deseni ayarlamak ve bulmak içi
Bu gösterge, tüccarın ihtiyacına göre grafiği daha temiz hale getirmek için etkinleştirilebilen / devre dışı bırakılabilen 6 seviyeye kadar çizer Bu 6 seviye 2 set halindedir: Yüksek ve Düşük Her set için farklı zaman aralığı seçilebilir Fiyatın Günlük, Haftalık veya Aylık En Düşük seviyeye ulaştığında genellikle 5dk gibi daha küçük bir zaman diliminde reddedildiği düşünüldüğünden, Önceki Yüksek Düşük tersine çevirme stratejisine dayanır. Özellikler : - Tek bir grafikte 6 Zaman Çerçev
Kraken Crypto Exchange Vadeli İşlemler Geçmişi Güncelleme Paneli Özellikler : 1. Sembol için Kraken API'sinden temin edilebilen ayar ve güncelleme geçmişine dayalı olarak sembol oluşturacaktır. Bu panel Kraken Vadeli İşlem sembollerindeki geçmişi Açık Yüksek Düşük Kapat verileriyle günceller, Ayrıca Geçmiş Güncellemesi tamamlandığında mesajı yazdırır. Lütfen bunun CANLI Veri olmadığını unutmayın.   3. Araçlar > Seçenekler > URL'den Webrequest'e İzin Ver sekmesinde belirtildiği gibi Krak
5 EMA Scalping Strategy Multi Symbol Scanner This EA utility will scan all symbols which are selected in marketwatch and alert when such condition is formed in chart when Candle low is above EMA 5 for Sell alert and Candle high is lower from EMA5 so you can be ready before selling or buying for scalping purpose on 5min chart For more details watch attached video Logic : When a candle closes above 5 EMA in 5 mins chart, Wait for its low to break and Sell when low is broken by wick, Your SL sh
Çoklu Sembol ZigZag Breakout Tarayıcı, marketwatch'da seçilen tüm sembolleri tarar. Fiyat bu seviyelere ulaşmak üzereyken çift tepe, çift dip veya herhangi bir fibonacci uzantı seviyesini kolayca bulmanıza yardımcı olacaktır. Zaman Çerçevesini ve Zigzag'ın birden fazla Genişletme Derinliğini (3'e kadar) seçebilirsiniz. Önerilen ZigZag, her türlü Zigzag ve filtre gürültüsünü kapsayan 21,34 ve 55'tir. Terminal uyarısı veya push bildirimi veya her ikisini birden alacak şekilde ayarlayabili
Fibo Musang FMBCR CB1 koparma tarayıcı MT5 Fibo Musang CB1 veya Candle Break 1, Gold XAUUSD ve diğer forex sembollerinde çok iyi çalışan bir stratejidir. Bu tarayıcı, çoklu sembol para birimlerini çok hızlı bir şekilde taramanıza ve FMCBR CB1 çıkışı hakkında uyarılar almanıza yardımcı olacaktır. Lütfen tüccarın tercihine göre tamamen özelleştirilebilen daha fazla ayrıntı için videoyu izleyin: 1. Zaman dilimini ve Bar Geçmişini seçebilirsiniz. 2. Tercih ettiğiniz ZigZag ayarını deği
Çoklu Sembol Fiyat uyarısı ayarlamak ve Terminal Uyarısı veya Push Bildiriminden bildirim almak için grafikte herhangi bir yere Çift Tıklayın 1. EA Yardımcı Programını tabloya ekleyin 2. <- sol veya -> sağ ok tuşlarıyla çizelgeye göz atın 3. Grafikte herhangi bir yere çift tıklayın ve bir satır ekleyecektir, istediğiniz fiyatı ayarlamak için bu satırı sürükleyin ve işte, uyarı ayarlandı! Fiyat hatta ulaştığında, yardımcı programın ayarlarına göre terminal veya push bildirimi ile sizi bi
Bu gösterge fibonacci düzeyleri etiketlerini büyük yazı tipi boyutunda göstermenize olanak tanır . 25'ye kadar fibonacci seviyesini destekler - Fibonacci'yi çizdiğiniz anda giriş parametresi olarak eklediğiniz seviyeleri seçtiğiniz renk ve yazı tipiyle büyük yazı boyutunda gösterir. Özelleştirilebilir seçenekler: 1. Fibo Metin Yazı Tipi 2. Fibo Metin Boyutu 3. Fibo Metin Rengi 3. Her seviyeye açıklama ekleyin 4. Çapalar ve Dereceler gibi diğer seçenekler
Bu gösterge, aynı grafikte izlemek istediğiniz diğer zaman dilimi mum çubuklarını verimli bir şekilde izler 1. Aynı grafikteki çubukları yüklemek için daha yüksek bir zaman dilimini seçin 2. Şamdanların renklerini ve stilini özelleştirin 3. Şamdanları çizmek için çubuk sayısını seçin 4. Daha yüksek zaman dilimindeki komple mumları fitil ve gövdeyle birlikte takip edin 5. Grafiği değiştirmek istemeyenler için kolay ve kullanışlı.
Cobra Pivot Noktaları, DEMO'yu indirerek kendinizi test edebileceğiniz en iyi optimize edilmiş pivot noktalarını çizmeye yönelik bir göstergedir. 1. En İyi İki Pivot Modunu Seçin: Cobra Pivots veya Camrilla Pivots 2. D1 ile sınırlı olmamak üzere istediğiniz zaman dilimini kullanabilirsiniz. 3. Shift parametresi ile Önceki gün Yüksek Düşük Kapanış değeri ile oynayabilirsiniz. 1 = Önceki Çubuk, 2 = Önceki çubuktan önceki Çubuk vb.. Bu parametreler pivotlar üzerinde araştırma ve geliştirme
Çoklu Para Birimi Önceki Mum veya Önceki Çubuk Tarayıcı, gösterge ayarlarından seçtiğiniz herhangi bir özel zaman diliminde çoklu sembol grafiklerini taramanıza yardımcı olur. Ürün bazında: https://www.mql5.com/en/market/product/78657 Önceki Günün en yüksek en düşük, Önceki haftanın en yüksek en düşük, Önceki ayın En yüksek en düşük veya herhangi bir özel zaman dilimi için çoklu sembolleri taramak için kullanılabilir; Önceki 4 saatlik grafik yüksek düşük Gürültüyü filtreler ve fiyat Yü
Pivot Noktaları Çoklu Sembol Tarayıcısı, Marketwatch'ta bulunan tüm sembolleri Floor, Woodie, Camarilla, Demark veya Fibonacci Pivot Noktaları için tarar. Pivot noktalarını hesaplamak için herhangi bir zaman dilimini seçebilir ve fiyat bu destek ve direnç seviyelerine dokunduğunda uyarı alabilirsiniz. Görsel Pivot Noktaları için Bu ürün ilginizi çekebilir: https://www.mql5.com/en/market/product/110072 Çeşitli uyarı türlerini seçme seçenekleri vardır Tarama sıklığını milisaniye cinsi
Filtrele:
İnceleme yok
İncelemeye yanıt