YouTube'dan Mağaza ile ilgili eğitici videoları izleyin
Bir ticaret robotu veya gösterge nasıl satın alınır?
Uzman Danışmanınızı
sanal sunucuda çalıştırın
sanal sunucuda çalıştırın
Satın almadan önce göstergeyi/ticaret robotunu test edin
Mağazada kazanç sağlamak ister misiniz?
Satış için bir ürün nasıl sunulur?
MetaTrader 4 için ücretli teknik göstergeler - 88

Ready scalping system!
F1 Scalping for MT4 is a complete trading system that analyzes the market instead of you, shows you when you need to open orders and at what level to place TakeProfit and StopLoss in order to get a good result. This is a whole trading complex of tools, packed into one technical indicator. Also, this system can send signals to the trader on the phone. This greatly facilitates the trading process. You receive a signal on your phone, go to your PC and see where you need to

Welcome to Investment Castle products This product is exclusively available in the MQL5 market and is not available and will not be available anywehere else. The Combined indicator is a multi-time frame indicator and it is built using 3 indicators: Bands indicator which draws the support and resistance key levels using up to 5 different time frames Patterns indicator which draws the chart patterns using up to 6 different time frames Spots indicator which shows the common candlestick pattern

Night Crawler is a moving average trend trading strategy and delivers over 89 to 90% wining ratio when applied and traded properly. It work for all Timeframe and for every currency pairs trading on the MQL4 Platform. To have a clear trend bias of the market Apply EMA 50 and EMA 21 to your chat to get the best out of this strategy for your overall Trend View.
The Best Timefarme to use is H1 or H4
ENTRY RULES :
For Buy trades :
1. Wait for EMA 21 to Cross Above 50 2. When the arrow (Bl

66% discount only for the first 5 buyers (4 left), main price: 300 $
Show the signal as a line graph Prediction of 10 future candles and advanced display Prediction of individual candles graphically Can be used in the gold symbol Can be used in 15 minutes time frame Can be used only in gold symbol and only 15 minutes time frame
How the indicator works:
Using complex mathematical calculations, it predicts the future 10 candles. The predictions of this indicator are based on price. Ther
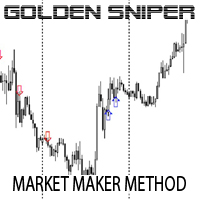
Indicator is based on Market Maker Strategy. NO REPAINT.
MM's are traders and their objective is to make money. This includes strategies to trade against retails traders. The major difference between them and other traders is that they have the ability, through access to massive volumes, to move price at their will. So to make money, they aim to buy at a lower price and then sell at a higher price. They achieve this by: 1. Inducing traders to take positions. This is achieved by using a ran
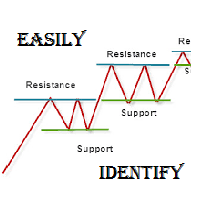
SUPPORT RESISTANCE
Function: Trader will find rejections, Movements & Easily understand to take positions Time Frames: 1 Hour, 4 Hours, Daily Types: Standard, Woodie, Fibonacci Font size & Name: Any Colours: Default black, Trader will find their own Finally this is very important to understand what is indicator. Indicator is just use for indicate not confirmation therefore, experienced traders always guide that do proper cash management & trade wisely. Good Day, Best of Luck :)
Beta Fort Trader is a moving average trend trading method and gives above over 75 to 90% wining ratio when used according to the given instructions.
The Best Timeframe to use is H1 or H4
It work for all Timeframe and for every currency pairs trading on the MQL4 Platform. To have a clear trend bias of the market Apply EMA 50 and EMA 21 to your chat to get the best out of this strategy for your overall Trend View.
TRADING INSTRUCTION :
For Sell trades :
1. Look out for EMA 21 to Cross

What does this do? It shows you on the chart which stop belongs to which entry. Have you ever had multiple positions or trades open on a single pair and were confused which stop loss goes with what entry? Even worse, the stop loss orders for buy and sells are the same color on the chart. Well, your problem has been solved! This indicator will show you which stop belongs to which entry. It will place a vertical line and an arrow on the chart for each open trade. A yellow line connects the entry
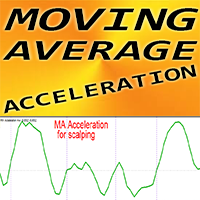
Forex Indicator MA Acceleration for MT4, No Repaint. MA Acceleration - is scalping indicator, designed as auxiliary tool for MA SPEED indicator The calculation of this indicator is based on equations from physics. It will show you the acceleration of moving average line. There are plenty of opportunities to upgrade even standard strategies with MA Acceleration. It is possible to use for SMA, EMA and LWMA. Indicator set up is very easy. MA Acceleration indicator shows how fast MA Speed indica

HFT Ölçekleyici Tarayıcı, Çoklu Semboller ve Çoklu Zaman çerçevelerinden doğru teknik göstergeden pazar trendlerini tarar ve bunu grafik üzerinde hareketli bir panelde görüntüler. Tüccar, görüntüleme için kendi seçtiği birden fazla çifti seçebilir.
Trendin yönünü görmek için harika bir araçtır ve trende göre yalnızca alım veya satım emirlerine izin vererek manuel ticaret veya EA ticareti için kullanılabilir.
Trend Support Resistance is a fairly simple indicator that provides traders with confirmed immediate support and resistance in whatever timeframe you monitor. It's good for short-term and long-term order blocks. With the default settings, the indicator identifies critical support and resistance areas. Bearish Order Blocks are around the OrangeRed areas while Bullish Order Blocks almost always form near the LawnGreen areas. We have also added a Multi-timeframe feature that can be helpful to allow

Trender is a special TrendLine Indicator because it is combined with a NON-REPAINT Signal Settings: showBars = if showBars= 0 so the indicator will be shown for all the chart PointLevel = Point Levels; 2 = central bar will be higher (lower) then 2 bars on the left side and 2 bars on the right one. qSteps = number of steps/ no more than 3 BackStep = number of steps back startBar= if startBar=0 so we have recommendation for the current bar, if 1 - for possible next bar TrendLine= True = Trendli

This trend following system was designed by Dennis Gartman and Bill Eckhart , and relies on breakouts of historical highs and lows to take and close trades: it is the complete opposite to the "buy low and sell high" approach. This trend following system was taught to a group of average and normal individuals, and almost everyone turned into a profitable trader.
The main rule is "Trade an N-day breakout and take profits when an M-day high or low is breached (N must me above M)" . Example
GO Universal Scanner is a simple scanner tool that can be used to scan any indicator on multiple symbols and timeframes. From now on, you don't have to ask anyone for a scanner of your favorite indicator, this scanner can do all the job for you.
You can also jump to the desired symbol and timeframe by simply clicking on the signal on the scanner dashboard. More than that, you the scanner can load your desired template on the newly opened chart. However, please note that, due to mt4 limitations

At the heart of any form of trading is the need to anticipate the direction the markets will go. To make this decision traders cannot afford to ignore trend analysis. Apply this before taking any trades otherwise you will loose. Market Trend Analysis is fundamental part of trading that's based on many indicators, patterns to predict future prices. The process of analysing each symbol can take weeks. This indicator saves the time of sitting and determining the direction of the markets. This indic

Triangle patterns are chart formations that signal a possible breakout in either direction. In the case of symmetrical triangles, the probability of a breakout to the upside or downside is about 50%. For more detailed information, I recommend the numerous publications on the Internet on this subject. What is special about this indicator is that it can be integrated into your own MT4 applications, such as scripts, Expert Advisers, etc. using the implemented indicator buffer via the iCustom() func
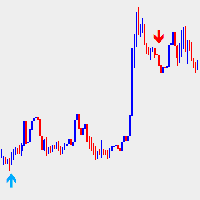
Yükseliş ve düşüşe yönelik hisse senedi satın alma / satma sinyallerine atıfta bulunarak. İndikatör sinyali ، الاتجاه dönüşlerini veya devamını belirlemek için yükseliş ve düşüşe yönelik hisse senedi satın alma / satma sinyalleri oluşturur ve uyarılar verir. Adından da anlaşılacağı gibi، bu sinyal hakim trende dayanmaktadır ve Trendi takip etme prensibiyle kullanıldığında daha etkilidir. İndikatör manuel olarak ayarlanabilir ve isteğe göre değiştirilebilir. İyi sinyallerin kullanımı، uyarılar a

View the institutional support and resistance on every time frame with alerts on and off buttons for each timeframe for instant chart decluttering. Monthly, Weekly, Daily, 4hour, 1hr, 30 min, 15min,5min etc. Ability to change colors each timeframe Solid or Outline Use bottom or top of Order Blocks as stop loss = defined risk
My Trading Story Began in 2013 in the wild west of the crypto market, I’ve spent over $10,000 on trading courses and what I've learned from this experience is that man

Waterstrider Band Waterstrider Band Indicator is a custom Indicator based on my experience in fx trade. This indicator also gives buy or sell signal when the condition are meet the open position rules. For Stop Loss you can put in the highest 3 previous candle + some pips (if SELL position) or put the lowest 3 previous candles + some pips (if BUY position).Trailing stop loss is good when the profit reach 20 pips. Do with your own risk, as we not guaranteed if any loss happen. Thanks H
Hiç hızlı bir şekilde anında 5 - 10 pip'e ihtiyacınız oldu mu? Sizin için güçlü bir çözüm geliştirdik. Önemli - Aşağıdaki açıklamayı okuyun!
Karşınızda InstaScalper Dash. İşlem gününün HERHANGİ bir saatinde, hatta piyasa kapanışından hemen önce bile size birkaç pip vermesi GARANTİ EDİLEN gerçek bir algoritmik canavar!
Hem acemi hem de uzman tüccarlar için kullanışlıdır, yapmanız gereken tek şey basittir. Anında birkaç pip için Güçlü bir Para Birimi ile Zayıf bir Para Birimi Ortalamasını
This indicator changes all the open charts to one single currency pair. This is useful when scanning multiple timeframes for setups and when backtesting strategies across multiple currency pairs.
The image combines this indicator (Set Symbol For All Charts) with the ABHSyncScroller and a Currency Picker. IF you have this indicator and the ABHSyncScroller , send me a message and I will send you the Currency picker and a template for FREE.
Simply add the indicator to one open chart. All th

Indicator of peaks and direction of the trend Adapter Trend. Uses all one parameter for settings. When choosing a parameter, it is necessary to visually similarize so that there is a slight projection of the peaks on the corresponding graph. The indicator displays both entry points and the trend itself. Then confirm the signal with some oscillator, for example RSI. It also does not hurt to correct your actions, taking into account some kind of flat indicator.
Options:
Length - the number of

Smart indicator Smart trend allows you to find the most likely trend reversal points. You will not find this indicator anywhere else. A simple but effective system for determining the forex trend. From the screenshots you can see for yourself the accuracy of this tool. Works on all currency pairs, stocks, raw materials, cryptocurrencies. This is a trend indicator for the MetaTrader 4 trading platform.
The alert system (alert, email notifications) will help you monitor several trading instrume

The Recommendation Trend indicator reflects price fluctuations, which already contain all the information about the market. For many traders, this postulate is a reasonable justification not to use fundamental analysis when working in the stock market, focusing only on what is happening on the chart, but using this indicator you will not regret the tips. The indicator shows favorable moments for entering the market. The intelligent algorithm of the indicator determines the trend, filters out mar

The Trend Live indicator is a development for trend trading. Trend indicators make it possible to classify the direction of price movement by determining its strength. Solving this problem helps investors enter the market on time and get a good return. The Trend Live indicator helps to analyze the market on the selected time interval. They define the mainstream. Easy to set up and works on all pairs and all time frames. Trend Live is a trend trading and filtering solution with all the important
M1 Arrow Scalping - shows signals on the M1 period, does not redraw entry points and can work on all major currency pairs + metals (gold/silver). The indicator analyzes the market using algorithms for determining price patterns and shows the trader the price reversal points on the chart. The red dot shows that the price will turn down and the blue dot shows that the price will turn up. The indicator also sends signals to the phone in the form of PUSH notifications. Therefore, you do not need to

Acceleration Force Meter Indicator - is a trend system that join market in trend phase and after trend pull-back. AFM indicator - is the system that watchs market phases from flat to extreme volatility and prefers to enter in market when it's active, more volatility, ignoring most flat places. This is 100% complete trading system including enter and exit points. It works well with profitable trades - maximizing take profit targets(analysis of recent market volatility, its pips range to adapt cur

Market Chopper Indicator - is the manual system for market scalping. Indicator uses most accurate points to enter, when current trend has lost it's power and new one starts. Indicator shows : Enter points(buy/sell arrows), Exit points(Stoploss/Takeprofit arrows). Indicator makes market analysis and adapts to any market, any timeframe showing most relevant strategy for exact conditions. Main Indicator's Features Signals are NOT repaint, late or disappear; Every signal comes at the open of new bar

ImbaTrend Runner - is the trend following manual system for forex/crypto market. It defines medium-term trends and works with it in intraday mode. System shows enter points, profit and loss targets. As a rule profit targets are 2-3 X bigger than loss targets. Indicator is AutoAdaptive and it automatically updates it's settings during trading. Indicator is sensitive to market changes, regular updates helps to stay in relevant trend. Main Indicator's Features Signals are not repaint, late or disap

Early WPR divergence - is the manual system to define trend reverse. Green histogram shows main trend, Orange one - shows "short"/local trend. System is looking for clear divergence between both trends and pick up position(plot buy/sell arrows). When main trend is up, but local trend reverses to bearish trend and get's big power - sell arrow is plotted; When main trend is down, but local trend reverses to bullish trend and get's big power - buy arrow is plotted; Main inputs are : mediumTrend

Trend Gain Oscillator - is the manual system for defining trend phase(bullish/bearish). When histogramm is pink - market is up/bullish and when histogramm is blue - market is down/bearish. Arrows is plotted on zero cross, in case if additionally market has power for future movement. Main inputs are : trendPeriod- main indicator's period for trend calculation; trendPowerPeriod - period for market's power(volatility+volume) calculation ; trendPowerTrigger - arrows is not plotted if market's power

24 Hours BO is designed for trading manually on brokers like iq option,alpari,pocket option,quotex,olymp trade,binomo etc.
The indicator allows you to trade binary options. The recommended timeframe is М5 and the expiration time is 5-15 minutes. The indicator works on any currency pairs. Arrows are not re-painted and appear only when a new candle appears! Trade sessions: any (24 hours); Currency pairs: any. Working timeframe: M5; Expiration time: 5-15 minutes. Entry Type - INTRBAR

OFFER! OFFER! NEXT Price Will be 650$ and the rental option will be removed after this. Don't miss the current price offer before it is too late. Dear Traders I am so glad to introduce my Super Powers Indicator. The purpose of this trading tool is to help serious traders who want to make trading one of their main source of income. I know trading is not an easy task but if you have the right tools, knowledge and motivation to trade then you are ready to go in this industry. My role is to help y

StarSwing è un indicatore NO REPAINT che unisce in un unico strumento oscillatori e indicatori di forza. I parametri esterni permettono di bilanciare il peso delle componenti e di regolare a proprio piacimento l'indicatore stesso. StarSwing, graficamente, è composto da segmenti di 2 colori: uno rappresentante il rialzo e uno il ribasso. Il colore non dipende dalla pura direzione del segmento ma dal trend di fondo calcolato dall'indicatore stesso. Sul grafico, si può far disegnare una media mobi

ROC acceleration-deceleration is the manual system for medium-term scalping. Indicator based on custom ROC system which defines bullish/bearish market and especially acceleration-deceleration of tendention in the market's main direction. Buy arrow is plotted during bearish market when current trend decelerates and sell arrow is plotted during bullish market when current trend decelerates. Main Indicator's Features Signals are not repaint,non-late or disappear(exept cases when system recalculat

ArchIntel Strength meter is different from the conventional strength meter. It displays correlation index for currency pair and individual currencies, see image 4 and image 6 for the currency pair correlation index and currency strength index. This strength meter displays correlated pair. EURJPY is used to explain the formula, EURUSD and USDJPY must be going up before I can buy (Long ) EURJPY , vice-versa is for sell. When any of the currency pair is correlated using this formular the the rectan

ASI fractals with DPO filter - is the manual trend-following system. ASI fractals are the base of every trend. System plots an arrow when fractal pattern appears on ASI indcator and DPO direction is same as incomming signal. System has several ways of usage : simply indicator, indicator with suggested arrows, arrows with single targets and arrows with common profit targets. User can simply switch indicator's modes directly from chart. Main Indicator's Features Signals are not repaint,non-late or

Asterysc SL & TP Values Info, is an indicator which will allow you to see on the chart in a visual way the potential profit/loss you could have if your trade touches TP or SL.
It will also allow you to see the total accumulated TP/SL of all open trades in a very simple way on each chart.
You will also be able to quickly visualize the current Drawdown of your account.
*The indicator is customizable, so you can change the colors, size and fonts of each section.

Trend reversal index - is the manual trading system that works with overbought , oversold levels and reversal patterns. Sell arrow is plotted when indicator is higher than overbought level and here forms reversal pattern, all pattern points located higher than overbought level. Opposite with buy arrow : ndicator is lower than oversold level and here forms reversal pattern, all pattern points located lower than overbought level. Main Indicator's Features Signals are not repaint, late or disapp

Use with disciplined risk management. Fibonacci entry system based on the golden zone 38.2 - 61.8 where the entry is confirmed at 23.6 with indications of Take Profit 3:1. Automatically plotted Fibonacci contains retracement and expansion Fibonacci in a single indicator. Up to 77% win rate with this system. FTMO challenge pass with 0.50% risk and 1.50% R:R.

StarBounce è un indicatore NO REPAINT che sfrutta i livelli importanti dei timeframe superiori. StarBounce disegna i livelli di Apertura, Chiusura, Massimo e Minimo delle candele di uno specifico timeframe e su questi livelli cerca dei re-test. Si cercano candele con corpo sopra/sotto un livello e minimo/massimo oltre il medesimo livello. Si possono filtrare le candele segnale con diversi filtri selezionabili, attivabili, disattivabili con variabili esterne. Number of trending candles: permette

Dema divergence points - is the manual trading system based on double exponental moving divergence. Histogram represents 4 colors : yellow - strong up trend, orange - up movement, blue - down movement and aqua - strong down trend. Up arrow is poltted when dema crosses current price up - but phase is still strong down (aqua color), down arrow is poltted when dema crosses current price down - but phase is still strong up (yellow color). Main inputs : mainPeriod - main dema calculation period; f

Demarker pullback system - is the manual trading system for choppy markets. It show 2 colored histogram. When histogram is blue - market is quite bullish, when histogram ir orange - market is more bearish. Up arrow is plotted when histogram is in oversold zone but blue color. Down arrow is plotted when histogram is in overbought zone but orange color. These patterns shows false breakout and possible soon reverse(price is overbought but shows bearish signs and price is oversold but shows bullis
Super Signal Buy And Sell Indicator
Pairs - XAUUSD - XAGUSD - Oil - BTCUSD - EURUSD - GBPUSD - USDJPY - AUDUSD - GBPJPY .... etc TimeFrame - 15Mins - 30Mins - 1Hour - 4Hour - 1Day - 1Week - 1Month
Setting : - Once Show On Green Arrow And Next Engulfing For Candle You Can Place The Buy Order Once Show For Red Arrow And Next Engulfing For Candle You Can Place The Sell Order Otherwise Please Wait For Conformation Push Notification Alert
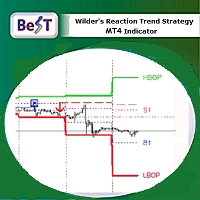
Best _Wilder’s Trend Reaction Strateg y is a Metatrader indicator that is based on the J.W.Wilder’s corresponding work as we can find it at his own legendary book:
“ NEW CONCEPTS IN TECHNICAL TRADING SYSTEMS ”(1978) and on pages 71-86/SECTION VII.
This strategy is both an anti-trend system (named as REACTION_MODE ) and a trend system (named as TREND_MODE ). The REACTION_MODE reverses at each Buy point and most Sell points while the TREND_MODE usually exits the market at a Trailing Stop.
T

This indicator uses a special algorithm to plot the 4 lines for trading. Great for scalping. Features alerts. Settings for trend filters. How to use: Simply attach to any chart with default settings. Buy when the three pink lines converge below the green line. Sell when the three pink lines converge above the green line. Best results when looking at three or more time frames, and the three blue lines have just converged below or above the green line.
Use as you see fit for your strategy. Best r

Precautions for subscribing to indicator This indicator only supports the computer version of MT4 Does not support MT5, mobile phones, tablets The indicator only shows the day's entry arrow The previous history arrow will not be displayed (Live broadcast is for demonstration) The indicator is a trading aid Is not a EA automatic trading No copy trading function
The indicator only indicates the entry position No exit (target profit)
The entry stop loss point is set at 30-50 PIPS Or the front

The Magic MA Moving Average Indicator is a market analysis tool that has more than 30 types of moving averages that the trader can use to gauge the market trend.
Among the types of moving averages that the trader can visualize are the most common MAs (SMA, EMA and SMMA), adaptive moving averages such as FRAMA and KAMA and other MAs based on innovative calculation and analysis methods such as LSMA, ZLEMA and others.
The indicator is designed to display all these moving averages on a single c
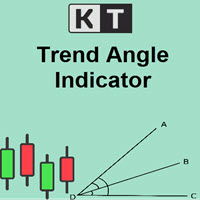
The KT Trend Angle helps to identify ranging and trending markets. The idea is to only enter a trade following the market trend if the slope is steep enough.
An angle is the ratio of the number of bars to the number of points: The bars mean the time offered by standard (M1, M5, etc.) and non-standard time frames. Points represent the unit of price measurement with an accuracy of 4 or 5 decimal places.
Input Parameters Period: An integer value to define the intensity of angled trendlines. A

KT Forex Blau Balance combines elements of momentum and volatility. It helps you identify entry and exit points.
Blau Balance consists of two moving averages (a slow-moving average and a fast-moving average) intersecting key transition points in market price. The indicator turns green or red when one is above or below the other, signaling to buy or sell trade signals.
It can be used in currency pairs and other markets that your MT4 or MT5 platform supports. Both short-term and long-term tra

Levels indicator. It works on a neural network and is formalized according to professional rules for building horizontal levels. The indicator redraws the levels every day and notifies you when the price approaches or cross the levels. The indicator is suitable for both professionals and beginners who have only recently begun to learn how to trade in the market. PrimeTools is a series of products designed for correct and professional trading. [PrimeTools Levels | PrimeTools Range ]
Panel Show
Zig Zag Multi Time Frame Indicator counts in how many consecutive candlesticks the current Zig Zag "lit" on the different Time Frames. It can be used for both trend signal strategies and range breakout strategies. Shows simultaneously on all Frames in how many candles we have had Zig Zag value in the current swing. The Zig Zag period can be adjusted in the Indicator settings.
Antabod indicator is a trading system worth being sold for $999, but now $120. For a short period of time the price is now reduce to $60, but may soon go back up to $120 . This forex indicator analyzes the price behavior on the chart every second and determines the ideal entry points, based on the built-in algorithm, informing you when you need to open a deal and close it, to take profit.
It catches very fast and profitable price movements and gives you easy BUY/SELL signals, by Up and Do
The KT De Munyuk is a trend-based indicator that uses Parabolic SAR to identify the market direction. The indicator shows the PSAR in the form of green/red dots using a separate window. Buy Signal: When a green dot appears after a series of at least three red dots. Buy Exit: When a red dot appears on the current or next higher time frame. Sell Signal: When a red dot appears after a series of at least three green dots. Sell Exit: When a green dot appears on the current or next higher

In MetaTrader, plotting multiple horizontal lines and then tracking their respective price levels can be a hassle. This indicator automatically plots multiple horizontal lines at equal intervals for setting price alerts, plotting support and resistance levels, and other manual purposes. This indicator is suitable for Forex traders who are new and looking for chances to make quick profits from buying and selling. Horizontal lines can help traders find possible areas to start trading when the
KT XMaster Formula is a buy & sell signal indicator that works magically on most of the timeframes and currency pairs when used correctly.
The indicator uses calculations based on moving averages, RSI, and MACD. It is usually appropriate for scalping and trend trading - whether you are a novice or an experienced trader, the signals generated by this indicator are simple to understand and implement.
Overview The indicator comprises green and red dots arranged in wavy lines. These dots corre

KT Forex Trend Rider uses a trend following algorithm developed specifically for the Forex market to provide reliable buy & sell signals across the major currency pairs. It works best on major FX pairs and all time-frames.
Features
It comes with a Multi-Timeframe scanner that can search for upcoming signals across all the time-frames. It comes with four preset profiles to facilitate trading for scalpers, tick-trend, swing, and trend traders. It marks the potential reversal points in the mark
Gold Scalping Indicator - an indicator for intraday trading on XAUUSD gold. The indicator determines price reversal points and draws signals on the chart. The indicator also sends signals to the phone. When the indicator draws a red dot, it means that the price may turn down now. When the indicator draws a blue arrow, it means that the price may turn up now. Given this information, every trader will be able to build an effective trading system on gold. Gold is a very liquid instrument that is w

The BSI stands for Bar Strength Index. It evaluates price data using a unique calculation. It displays readings in a separate window. Many financial investors mistake this indicator for the Relative Strength Index (RSI), which is incorrect because the BSI can provide an advantage through its calculation method that the RSI indicator does not. The Bar Strength Index (BSI) is derived from the Internal Bar Strength (IBS), which has been successfully applied to many financial assets such as commodit

The KT Tether Line is a trend-following tool consisting of three indicators that work together to generate trading signals. It can correctly identify market trends while signaling trade entries. It was first introduced by Bryan Strain in the Stock & Commodities magazine in 2000 in "How to get with the trend and out at the end."
The Concept
When a market trend is confirmed, the most challenging part is determining the timing of the entries. This indicator alerts you to potential trend reversal
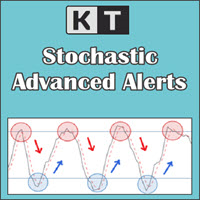
KT Stochastic Alerts is a personal implementation of the Stochastic oscillator that provide signals and alerts based on six custom events: Bullish Crossover: When Stochastic main line cross above the signal line. Bearish Crossover: When Stochastic main line cross below the signal line. When Stochastic enter in an overbought zone. When Stochastic exit from an overbought zone. When Stochastic enter in an oversold zone. When Stochastic exit from an oversold zone.
Features
A perfect choice for
Current strength of the 8 major currencies My #1 Utility: includes 65+ functions, including this indicator | Contact me if you have any questions The indicator is displayed in a separate window, it can be moved to any place on the chart. In the input settings you can adjust: Interface theme : dark / white; Prefix and Suffix, if the currency pairs on your broker have it:
(e.g. if Symbol is "EURUSD .pro ", please set " .pro " as a Suffix); Panel size Font size
Supply / demand zones: observable areas where price has approached many times in the past. My #1 Utility: includes 65+ functions, including this indicator | Contact me if you have any questions The indicator shows where the price could potentially be reversed again. Usually, the more times the price has been rejected from the level, the more significant it is. In the input settings you can adjust: Enable or disbale Weak zones; Show or hide zone description; Font size; Set the basic col

The Th3Eng Ninja indicator is based on an analysis of the right trend direction with perfect custom algorithms. It show the true direction and the best point of the trend. With Stop Loss point and Three Take Profit points. Also it provides a secondary entry points in dots arrows style. And Finally it draws a very helpful lines from entry level to TP1, TP2, TP3, SL levels or the reverse signal, and all current/old signals status.
How to use the indicator
No complicated steps , Just follow 2
Absolute volatility for each day for the last 4 weeks My #1 Utility: includes 65+ functions, including this indicator | Contact me if you have any questions The indicator is displayed in a separate window, it can be moved to any place on the chart. In the input settings you can adjust: Interface theme : dark / white; Calculation method: price, pips, points, % change;
Panel size Font size
That is my master piece invented new Forex indicator Copyright 2010 to 2100 (316009) for Sami A. Saydam. This indicator is showing the real Support and Resistance levels in dynamical ways as movable red lines with time, also works on all time charts' intervals. The price movements are strongly respecting those red lines and either confirmed break them or just touching them and can't break them up or down then move toward the right directions. This new techniques are the real alerting system ca

This indicator takes input from the RSI, combined with a trend filter. Great for scalping. Does not feature any alerts and is best used manually. Settings: TrendFilterPeriod RSIPeriod Set these parameters to your preference. How to use: Attach to any chart with default settings. Can be used on any time frame. If used on lower time frames, check higher time frames too. Buy : - Wait for blue histo color to cross above level 50, then open buys. **Best results when checking the higher time frames to

XFlow shows an expanding price channel that helps determine the trend and the moments of its reversal. It is also used when accompanying transactions to set take profit/stop loss and averages. It has practically no parameters and is very easy to use - just specify an important moment in the history for you and the indicator will calculate the price channel.
DISPLAYED LINES ROTATE - a thick solid line. The center of the general price rotation. The price makes wide cyclical movements around the

TPM Cross (trend power moving cross) - is a trend following strategy based on custom signal points. Indicator consists from main custom moving chart line and trend power line. Indicator defines up and down movements by it's trend power and custom moving direction. When current market's trend looses it's power and opposite trend starts - power trend line crosses moving and indicator plots an arrow. Main indicator's adjustable inputs : movingPeriod - period of moving line trendPeriod - period

Impulse fractals indicator - is counter-trend oriented complex market fractal pattern. Market creates bull/bear impulse, trend starts, fractals on impulsed wave are an agressive pullback signals. Buy arrow is plotted when market is bearish and it's impulse showed up-side fractal, and sell arrow is plotted when market is bullish and it's impulse showed dn-side fractal. Main indicator's adjustable inputs : impulsePeriod - main period of impulse histogram filterPeriod - smoothes impulse accordi
MetaTrader Mağaza, geçmiş verilerini kullanarak test ve optimizasyon için ticaret robotunun ücretsiz demosunu indirebileceğiniz tek mağazadır.
Uygulamaya genel bakışı ve diğer müşterilerin incelemelerini okuyun, doğrudan terminalinize indirin ve satın almadan önce ticaret robotunu test edin. Yalnızca MetaTrader Mağazada bir uygulamayı tamamen ücretsiz olarak test edebilirsiniz.
Ticaret fırsatlarını kaçırıyorsunuz:
- Ücretsiz ticaret uygulamaları
- İşlem kopyalama için 8.000'den fazla sinyal
- Finansal piyasaları keşfetmek için ekonomik haberler
Kayıt
Giriş yap
Gizlilik ve Veri Koruma Politikasını ve MQL5.com Kullanım Şartlarını kabul edersiniz
Hesabınız yoksa, lütfen kaydolun
MQL5.com web sitesine giriş yapmak için çerezlerin kullanımına izin vermelisiniz.
Lütfen tarayıcınızda gerekli ayarı etkinleştirin, aksi takdirde giriş yapamazsınız.