 Tüm siparişler
 Kurallar
Bir alım-satım robotunun nasıl sipariş edileceğini izleyin
Bir sipariş vermeden veya bir siparişe başvurmadan önce Kuralları okuyun
Bir MQL5/MQL4 Alım-Satım Robotu Nasıl Sipariş Edilir?
Bir robot sipariş etmek için örnek Gereklilikler Şartnamesine bakın
Kategorideki yeni siparişler:
250 - 500 USD
30+ USD
30 - 50 USD
30 - 40 USD
30+ USD
Şartname
Hi,
I’m currently working on a trading system that should be automated. The first step will be to code an indicator for detecting special/important support and resistance areas on any forex chart and suggesting appropriate SL/TP levels for making the corresponding BUY/SELL market orders. Said indicator needs complex calculations and a lot of input parameters for the user in the GUI. Therefore the budget is up to $ 100 and I need the final product (incl. bug fixes) soon resp. within the next few days.A detailed description of the requested indicator’s functionality is attached in the postscript (see below).
Who can do this VERY accurately?
[An advanced mathematical understanding is strongly required!]
Ben
PS: Description of the requested indicator:
MT4 Indicator “SupRes_v1”
Concept:
“SupRes_v1” detects strong up/down price movements followed by a support/resistance area and draws a down(sell.order) / up(buy.order) arrow contrary to said strong movement. The requested indicator also plots lines for suggested fixed SL/TP levels along with said arrows that symbolize the recommended trading direction.
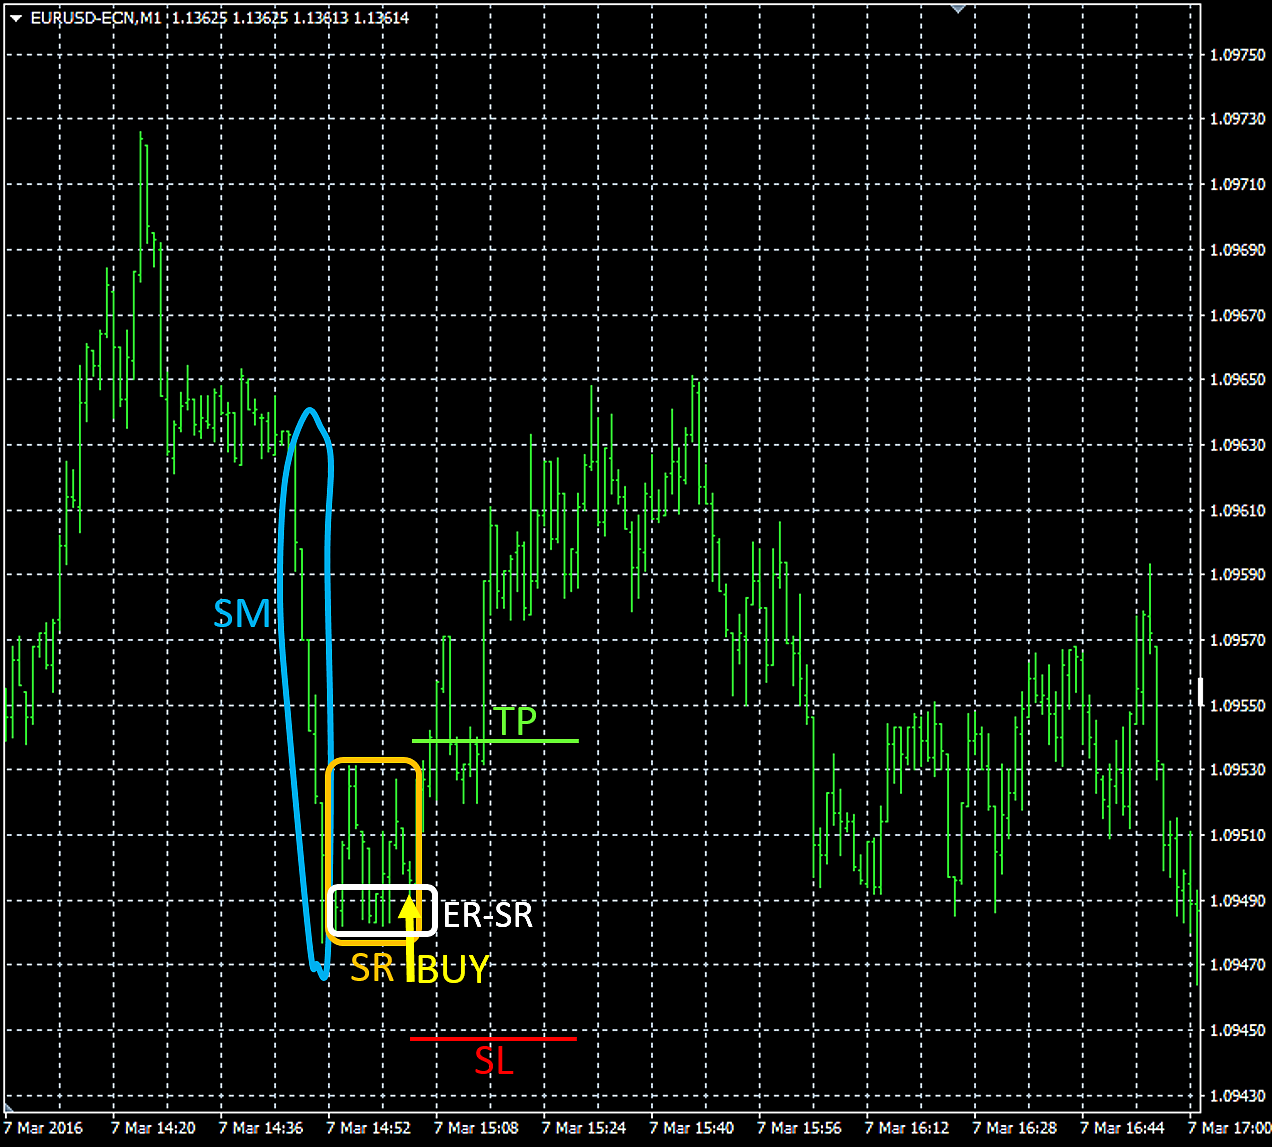
It is recommended to open the attached image in a separate browser tab etc. for a better understanding when reading the detailed description below.
Description in detail:Stage 1:
The fx chart resp. price makes a strong up(sell.order) / down(buy.order) movement for at least n bars. A “strong movement (SM)” must be calculated as follows:
SM = [(Difference in points between the highest high and the lowest low of the last n closed bars)/n]/[SUM(length of n bars)]
In the Indi’s GUI the user must also be able to define the minimum value for SM:
-> Minimum value of SM: 0.55 [etc.]
-> Minimum number n of SM bars: 5 [etc.]
If e.g. SM = 0.50, the strong movement’s bars’ “overlapping value” must be averagely at least 50 %.
If e.g. SM = 1.00, the strong movement consist of consecutive “non-overlapping” bars.
If e.g. SM > 1.00, the strong movement’s bars must have partly gaps between each other.
The indi must permanently scan the chart’s last n closed bars and recognize if all conditions for a valid “SM” are fulfilled.
Once a SM is detected the indi must “note” the value resp. price of SM’s lowest low and highest high and their positions (time/date). From then on the indi must continually check resp. recalculate if the movement stays “strong” (definition see above) when including the follow-up bars n+1, n+2, n+3, …, n+x (instead of calculating only with n) and – ONLY IN THIS CASE – update the values/dates for SM’s lowest low and highest high (see above).
Furthermore a potential SM(n) resp. SM(n+x) must be ignored by the indi if it exceeds “maximum points of distance SM” or undercuts “minimum points of distance SM”, whereby “distance” = difference between the highest high and the lowest low of all “SM valid closed bars (n+x)”:
-> Maximum points of distance SM: 300 [etc. (if TF = M1)]
-> Minimum points of distance SM: 60 [etc. (if TF = M1)]
Stage 2:
The strong movement slows down. This means that the “Minimum value for SM’s n bars: 0.55 [etc.]” is undercut by the currently closed n+x+1 bar e.g. SM’s calculated current actual value shrinks from >0.55 to 0.54 or 0.43 etc. In this case the indi must make the “final notation” of SM’s lowest low / highest high (see above) BUT EXCLUDING the last closed bar that caused the end of SM!
Now the bars of SM consist of the initial bar (IB) followed by n-1 bars + x bars that let the movement stay strong (x can also be 0!) including the final SM bar (FB), before SM is terminated by the terminating bar (TB) which already belongs to the “support/resistance area (SR)”, see below.
Stage 3:
The “strong movement (SM)” is – per definition – followed by a “support/resistance area (SR)”. Now the indi must check if at least the next k closed bars within SR – starting with TB (see above) – are fulfilling the following conditions:
1.) The difference of SR’s k bars’ highest high and lowest low must be a “maximum percentage (SR-MP)” in relation to SM:
-> Maximum value for SR-MP: 0.35 [etc.]
-> Minimum number k of SR bars: 5 [etc.]
If e.g. SR-MP = 0.35, the k bars in the support/resistance area (SR) are all swinging within a range of maximum 35 % in relation to the strong movement’s (SM) distance [calculated according to “Stage 1”).
2.) At least e bars of the k closed bars (within SR, see above) have a high(sell.order) / low(buy.order) that is close to the highest.high(sell.order) / lowest.low(buy.order) of “SM-SR”, whereby “SM-SR” includes ALL closed bars starting with IB (initial bar of SM) and ending with the last closed CURRENT bar. Said “e” bar’s upper/bottom extrema [high(sell.order) / low(buy.order)] must be in a specified range [in points]; for example 2 bars out of 5 within SR are close to each other AND close to said extremum of “SM-SR”:
-> Maximum range of SR’s e bars: 10 [etc.]
-> Minimum number e of SR bars with similar extrema: 2 [etc.]
If “Minimum number e of SR bars with similar extrema” = 0, there MUST NOT be any couple/triplet etc. of bar’s with similar extrema but CAN BE.
3.) At least the l last closed bars of k are lower(sell.order) / higher(buy.order) OR EQUAL to the corresponding extremum of SM:
-> Minimum number l of SR’s last bars with lower/higher extremum: 2 [etc.]
If “Minimum number l of SR’s last bars with lower/higher extremum” = 0, the last closed bars within k have no further restriction at this point.
NOTE:
If not all conditions of “Stage 3” are fulfilled at the close of bar k, the indi must continually check resp. recalculate them with bars k+1 (instead of k), then k+2 (instead of k+1), then k+3 (instead of k+2), … and so on. This process will end if
a) all conditions are fulfilled
or
b) “Maximum value for SR-MP” is exceeded by the currently processed bar.
If “b” occurs the indi must go back to resp. start again with “Stage 1”.
If “a” occurs the indi must proceed with “Stage 4” (see below).
Stage 4:
If all conditions of “Stage 3” are fulfilled the indi must wait until the current price reaches the end region of SR = ER-SR. The “ER-SR” is – per definition – located in the upper(sell.order) / bottom(buy.order) area of SR and finally ending with the SR’s highest.high(sell.order) / lowest.low(buy.order). ER-SR must be set in the GUI by the user as a percentage of the distance between the highest high and the lowest low of SR:
-> ER-SR’s percentage for entry price level: 0.25 [etc.]
In this case the current price must reach the top(sell.order) / bottom(buy.order) 25% of SR to fulfill this condition.
If said value is set to e.g. 1.25 (= 125%) the current price must exceed(sell.order) / undercut(buy.order) SR’s highest.high(sell.order) / lowest.low(buy.order) with a “distance of at least 25% SR”, whereby “distance of SR” = highest.high - lowest.low of the current/actual SR in points.
NOTE:
It’s very important that all follow-up bars after “Stage 3” resp. while “Stage 4” must apart from that ALSO be in the range of “Maximum value for SR-MP” [see “Stage 3: 1.)”], even the currently processed (not closed) bar!
As soon as a (current) follow-up bar of “Stage 4” exceeds “Maximum value for SR-MP” before reaching “ER-SR” (see above) the indi must go back resp. start again with “Stage 1”.
Stage 5:
If all conditions of “Stage 4” are fulfilled the indi must draw a colored down(sell.order) / up(buy.order) arrow above/below the current price reaching ER-SR (see above):
-> Color of the up/buy arrow: yellow [etc.]
-> Color of the down/sell arrow: yellow [etc.]
Furthermore the indi must calculate and draw suggested fixed SL/TP levels (horizontal thin and dotted lines with a length of 20 bars):
-> Color of the fixed SL line: red [etc.]
-> Color of the fixed TP line: lime [etc.]
The value resp. price level of SL/TP must be calculated as follows:
A user defined percentage of the difference highest.high and lowest.low of the whole movement IB->ArrowBar is converted to points and
for SL added(sell.order) to / subtracted(buy.order) from the “arrow’s price level”
resp.
for TP subtracted(sell.order) from / added(buy.order) to the “arrow’s price level”:
-> SM-SR’s percentage for calculating SL buy: 0.35 [etc.]
-> SM-SR’s percentage for calculating TP buy: 0.25 [etc.]
-> SM-SR’s percentage for calculating SL sell: 0.40 [etc.]
-> SM-SR’s percentage for calculating TP sell: 0.20 [etc.]
Furthermore the final SL/TP levels must ALWAYS be “expanded” by a user set spread (in points) that best represents the broker’s average:
-> Spread added to expand TP/SL: 12 [etc.]
Stage 6:
After an arrow and its corresponding TP/SL lines were drawn by the indi the latter must “pause” all calculations for r (recess) bars. After r bars it starts again with “Stage 1”:
-> Number of recess bars after signal: 10 [etc.]
Extra filter:
If enabled, all potential sell/buy signals will be “skipped” if not at least b bars BEFORE SM have a lower(sell.order) / higher(buy.order) extremum than the highest.high(sell.order) / lowest.low(buy.order) of SM-SR with at least p points difference:
-> Enable extra filter: true/false
-> Minimum number of lower/higher bars b before SM: 100 [etc.]
-> Minimum points of lower/higher bars before SM: 120 [etc.]
!! Please optimize the indicator for the lowest possible CPU usage – thx !!
Yanıtlandı
1
Derecelendirme
Projeler
396
28%
Arabuluculuk
70
19%
/
49%
Süresi dolmuş
121
31%
Serbest
2
Derecelendirme
Projeler
149
36%
Arabuluculuk
29
3%
/
55%
Süresi dolmuş
35
23%
Serbest
3
Derecelendirme
Projeler
370
42%
Arabuluculuk
145
17%
/
41%
Süresi dolmuş
124
34%
Serbest
Yayınlandı: 38 kod
4
Derecelendirme
Projeler
0
0%
Arabuluculuk
0
Süresi dolmuş
0
Serbest
Benzer siparişler
Custom MT5 Expert Advisor (EA) Development | MQL5 Automation Turn Your Trading Strategy into a Powerful Automated Trading System! Are you looking for a professional MT5 Expert Advisor developer to automate your trading strategy? I specialize in developing custom MetaTrader 5 (MT5) Expert Advisors and indicators using MQL5 , tailored to your trading rules, risk management preferences, and trading goals. Whether you
I am looking for an experienced MQL5 developer or development team to build a scalable Telegram-to-MT5 copy trading system. The main purpose of the system is to monitor trading signals from my Telegram channel and automatically execute those signals on connected client MT5 accounts. Core Requirements Receive and parse trading signals from Telegram Automatically execute trades on connected MT5 accounts Support more
Thana ram
30 - 200 USD
Hello, I want to develop a custom MT5 Expert Advisor (EA) for XAUUSD Gold. IMPORTANT: I want a proper rule-based automated trading EA, NOT a martingale, grid or guaranteed-profit bot. 1. MARKET & TIMEFRAME - Platform: MT5 - Symbol: XAUUSD only - Main trend timeframe: M15 - Entry timeframe: M5 - Must support broker suffixes such as XAUUSDm, XAUUSD., etc. 2. TREND RULE BUY trend: - M15 price above EMA 50 - EMA 50 above
I need a TradingView Pine Script (v6) indicator that gives BUY and SELL signals in real time on the live chart. MAIN REQUIREMENT – NO REPAINTING: 1. Signals must appear only when the candle closes (barstate.isconfirmed). Example: on 1-min chart, signal for the 10:35 candle must appear at 10:36 and never disappear or move. 2. Signals on historical bars must look exactly the same as they looked live. 3. No lookahead
Description I am looking for a highly skilled MQL5 Developer & Trader with strong experience in EA optimization, stress testing, and forward validation. The EA is already coded and running. What I need now is: 1.Simple code editing, code adjustment/upgrading and code tamplates inserting, 2.Parameter Optimization & Re-Validation – Find the best stable settings for XAUUSD (not overfitted). 3.Robustness / Stress Testing
مطلوب موشر قوية لتداول الذهب يحقق
100 - 200 USD
المطلوب موشر لتداول الذهب مجرب وقوية يعطي اشاره قوية فقط مع وقف خساره ومختبر ومجرب في حال الموافقه علي لموشر بعد التجربه لمدة ٣ ايام يتم الشراء دايم مبلغ ٢٠٠ دولار
Strategy
40 - 60 USD
yo i have a strategy i would really like to turn into a signal bot basically please this is very technical and serious to me the strategy needs more time 1 time frame and the bot most be 100% accurate
can you help me use a Tickblaze Algo NRBO on the NT platform? I have it somewhat set up, but I have other questions about running it & knowing how to operate it in NT. Thank you if anyone have experience in this kindly bib and let do it asap
I need a trading system similar to the attached files. Check attachment for details on the indicator. i guess the indicator contains some of (Rainbow MA , MTF Dashboard , Symbol Switcher , and Trend Histogram), though may not be exactly as listed
Indicies Trading Bot
90+ USD
I have a EA/Bot I’ve designed and want it to be put onto me MetaTrader5 this month. I’m new here and also need to figure out how to get a live account and add a UK broker
Proje bilgisi
Bütçe
50 - 100 USD
Son teslim tarihi
from 1 to 4 gün