 MetaTrader 5
 Uzmanlar
 Göstergeler
 Komut dosyaları
 Kütüphaneler
 Depo
Depo
Fan sayfamıza katılın

FX Dashboard - MetaTrader 5 için gösterge

- Görüntülemeler:
- 10
- Yayınlandı:
- Güncellendi:
-
 Alım-satım fırsatlarını kaçırıyorsunuz:
- Ücretsiz alım-satım uygulamaları
- İşlem kopyalama için 8.000'den fazla sinyal
- Finansal piyasaları keşfetmek için ekonomik haberler
Kayıt Giriş yapWeb sitesi politikasını ve kullanım şartlarını kabul edersiniz
Hesabınız yoksa, lütfen kaydolun -
 Bu koda dayalı bir robota veya göstergeye mi ihtiyacınız var? Freelance üzerinden sipariş edin
Freelance'e git
Bu koda dayalı bir robota veya göstergeye mi ihtiyacınız var? Freelance üzerinden sipariş edin
Freelance'e git
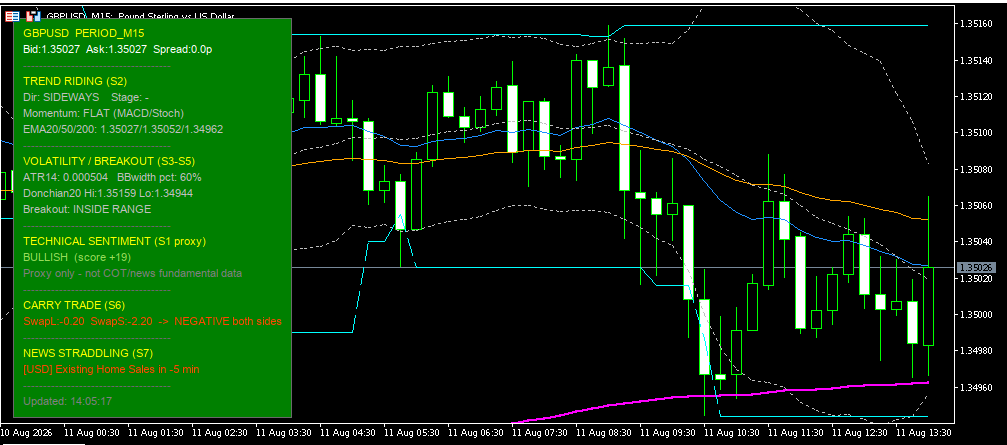
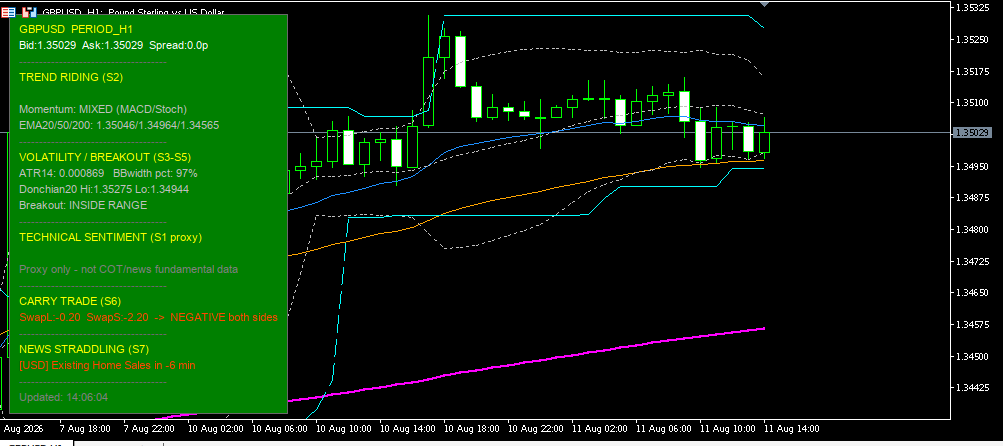
Grafikte görülenler:
- Teknik piyasa duyarlılığı (proxy) – EMA + MACD + Stokastik'ten hesaplanan yükseliş/düşüş puanı
- Trend Takibi – yön (YÜKSELİŞ TRENDİ / DÜŞÜŞ TRENDİ / YANAL SEYİR), aşama (başlangıç aşaması / yerleşik / olgunlaşma / tersine dönme riski), momentum
- Oynaklık ve Kırılma – ATR, Bollinger sıkışması, Donchian kanalı, kırılma durumu (onaylanmış / yanlış / test aşamasında)
- Taşıma Ticareti – uzun/kısa swap (gecelik faizi kim öder veya alır)
- Haber Straddling – paritedeki para birimleri için bir sonraki önemli ekonomik olay
Grafikte gösterilenler: EMA Hızlı / Orta / Yavaş, Bollinger Bantları, Donchian kanalı.
Gerçek zamanlı ticarette nasıl yardımcı olur
- Zaman kazandırır – artık 5–6 gösterge penceresi arasında gidip gelmenize gerek kalmaz; trendi, oynaklığı ve haberleri tek bir yerde görürsünüz.
- Bağlam filtresi – pozisyona girmeden önce şunları kontrol edersiniz: net bir trend var mı? sıkışma var mı? gerçek mi yoksa sahte mi bir kırılma? 30 dakika içinde haber var mı?
- Düşüncesiz girişleri azaltır – “YANLIŞ KIRILMA – GERİLEME”, “TERS DÖNÜŞ RİSKİ”, “YAN YATMA” gibi sinyaller sizi aralık hareketlerinden ve yanlış kırılmalardan uzak tutar.
- Haber zamanlaması – yüksek etkili olaylara (NFP, faiz oranları, TÜFE vb.) geri sayım, böylece oynaklıktan kaçınabilir veya bu oynaklıktan yararlanabilirsiniz.
- Carry – H4/D1 zaman dilimlerinde pozitif swap kazandıran yönü tercih edebilirsiniz.
Önemli sınırlamalar:
- Piyasa duyarlılığı teknik (vekil) bir göstergedir, COT verileri veya gerçek temel göstergeler değildir.
- Otomatik giriş/çıkış sinyali vermez; karar size aittir.
- Ekonomik takvim, brokerın sunucusuna bağlıdır.
- Bu finansal bir tavsiye değildir – eğitim amaçlı bir araçtır.
Her bir Giriş grubunun açıklaması
PANEL KİMLİĞİ
| Ayar | Ne işe yarar |
|---|---|
| Benzersiz Panel Kimliği | Aynı grafiğe 2 örnek yerleştirirseniz, nesneler arasında çakışma olmaması için farklı Kimlikler (Main, Scalp vb.) kullanın. |
PANEL KONUMU
| Ayar | Ne işe yarar |
|---|---|
| Panel köşesi | Panelin yerleştirileceği köşe (sol üst, sağ alt vb.). |
| X / Y Ofseti | Köşeden piksel cinsinden uzaklık. |
PANEL VE METİN RENKLERİ (açılır listeler)
| Ayar | Ne işe yarar |
|---|---|
| Panel arka planı | Panel arka plan rengi. |
| Kenarlık / ayırıcı | Kenarlık ve ayırıcı çizgiler. |
| Başlık / vurgu | Bölüm başlıkları (TREND RIDING, HABERLER vb.). |
| Nötr / temel metin | Normal metin (Alış/Satış, vb.) – varsayılan renk beyaz. |
| Yükseliş rengi | Olumlu sinyaller / yükseliş trendi – varsayılan renk yeşil. |
| Düşüş rengi | Olumsuz sinyaller / düşüş trendi – varsayılan kırmızı. |
| Uyarı rengi | Zayıflama, tersine dönme riski, haber yaklaşıyor. |
| Nötr renk | Yanal hareket, fiyat aralığın içinde. |
| Bilgi rengi | Sıkışma, yeni başlayan trend. |
| Eskime rengi | Eskiyen trend – varsayılan sarı. |
| Gri not rengi | İkincil notlar, sorumluluk reddi beyanları. |
METİN BOYUTU VE ÖLÇEKLENDİRME
| Ayar | Ne işe yarar |
|---|---|
| Yazı tipi | Varsayılan Arial. |
| Temel metin boyutu | Metin boyutu (nokta). |
| Panele otomatik sığdırma | Genişlik ve yükseklik metne göre otomatik olarak ayarlanır. |
| Manuel ölçek | HiDPI ekranlar için çarpan (0,5–3,0). |
| Satır aralığı | Satırlar arasında ekstra boşluk. |
GÜNCELLEME
| Ayar | Ne işe yarar |
|---|---|
| Panel yenileme aralığı | Panelin ne sıklıkta yenileneceği (varsayılan 1 saniye). |
GRAFİK ÜST KATMANLARI
| Ayar | Ne işe yarar |
|---|---|
| EMA / BB / Donchian Çiz | Grafikteki çizgileri etkinleştirir veya devre dışı bırakır. |
| EMA/BB/Donchian renkleri + genişlik | Çizginin görünümü (açılır listelerden de seçilebilir). |
STRATEJİ 2 – TRENDİ TAKİP ETME
| Ayar | Ne işe yarar |
|---|---|
| EMA Hızlı / Orta / Yavaş | EMA dönemleri (varsayılan 20 / 50 / 200). Bunların yığını YUKARI TREND veya AŞAĞI TREND'i tanımlar. |
| MACD Hızlı / Yavaş / Sinyal | Histogram ve momentum teyidi için kullanılır. |
| Stokastik %K / %D / Yavaşlama | Onay veya sapma için stokastik eğimi. |
STRATEJİLER 3/4/5 – VOLATİLİTE VE KIRILMA
| Ayar | Ne işe yarar |
|---|---|
| ATR dönemi | Mevcut volatilite. |
| BB dönemi / sapma | Sıkışma tespiti için Bollinger Bantları. |
| BB sıkışma geriye dönük analizi | Mevcut BB genişliğinin yüzdelik dilimini sıralamak için kaç çubuk kullanılır. |
| Sıkışma eşiği % | Bu yüzdelik dilimin altında [SQUEEZE] etiketi görünür. |
| Donchian dönemi | N çubuk boyunca yüksek/düşük kanal (kırılma ve gerileme için). |
| Fade geriye dönük çubuklar | Bir kırılmanın başarısız olup kanal içine geri dönmesine izin verilen çubuk sayısı. |
| Kırılma ATR kat sayısı | Kırılmanın TEYİT EDİLMESİ için fiyatın kanalın ne kadar ötesinde (ATR katları cinsinden) kapanması gerektiği. |
STRATEJİLER 1 / 6 / 7
| Ayar | Ne Yapar |
|---|---|
| Piyasa duyarlılığını gösterir | Teknik yükseliş/düşüş puanını gösterir. |
| Taşıma göstergesi | Uzun/kısa swap'ı gösterir. |
| Haberleri göster | Bir sonraki takvim etkinliğini gösterir. |
| Haber ön izleme (dk) | Haber arama penceresi (varsayılan 180 dakika). |
| Haber filtresi | Yalnızca Yüksek / Orta+Yüksek / Tümü. |
Bu göstergeyle pratik canlı işlem yöntemleri
1. H1 / H4'te Trend Takibi (ana strateji)
- YUKARI TREND veya AŞAĞI TREND + 2. aşama - KESİNLEŞMİŞ + momentum ONAYLAYICI'yı bekleyin.
- Piyasa Duygusu ≥ YÜKSELİŞ (veya kısa pozisyonda ≤ DÜŞÜŞ).
- Fiyat, EMA Fast veya Mid seviyesine geri çekilir; geri çekilme anında pozisyona girin, stop emrini EMA Mid/Slow seviyesinin ötesine veya karşıt Donchian kenarına yerleştirin.
- Aşama 4-TERS DÖNÜŞ RİSKİ ise veya momentum AYRIŞIYORSA giriş yapmaktan kaçının.
- Etkisi büyük bir haber olayından (Haberler bölümü) önce 30–60 dakika piyasadan uzak durun.
2. Sıkışmadan çıkış (S5 → S4)
- Bollinger genişliği persentilinde [SIKIŞMA] etiketini arayın.
- CONFIRMED UP BREAKOUT veya CONFIRMED DOWN BREAKOUT'u bekleyin (sadece “TESTING” değil).
- Kırılma yönünde pozisyona girin; kanalların içinde veya Bollinger bandının altında/ortasında stop koyun.
- FALSE … BREAK – FADE mesajı görünürse, kırılmayı takip etmeyin – bu bir fade kurulumudur (bkz. yöntem 3).
3. Yanlış kırılmada fade (S3)
- Panelde FALSE UP BREAK – FADE veya FALSE DOWN BREAK – FADE yazıyor.
- Fiyat, Donchian kanalından çıktı ve tekrar kanalın içine geri döndü.
- Başarısız kırılma yönünün tersine girin (yanlış yukarı kırılmanın ardından kısa pozisyon açın), stop seviyesini kırılma uç noktalarının biraz ötesine yerleştirin.
- Hedef: aralığın ortası veya karşı Bollinger bandı. Anlık haberlerin olmadığı YAN YÖNLÜ piyasalarda daha iyi sonuç verir.
4. Haberlerde straddle / kaçınma (S7)
- Haberler, 30 dakika veya daha kısa süre içinde bir olay gösteriyorsa (uyarı rengi):
- ya pozisyon açmayın,
- ya da (deneyimliyseniz) straddle yapın: haber öncesi aralığın üstünde/altında alış stop + satış stop emri verin, kırılma sonrasında karşıt emri iptal edin.
- Aynı kurulumda straddle ile Trend Riding'i karıştırmayın – bunlar farklı tarzlardır.
5. D1'de taşıma eğilimi (S6)
- Bir tarafta açıkça pozitif swap olan çiftlerde (örn. LONG carry +).
- Trend (S2) uyumlu olduğunda sadece pozitif carry yönündeki işlemleri tercih edin.
- Swap size yardımcı oluyorsa ve durum TERSİNME RİSKİ içermiyorsa, pozisyonu bir gecede tutun.
6. Basit çoklu zaman dilimi filtresi
- H4'te: KESİN trend + net piyasa duyarlılığı.
- M15/H1'de: EMA Fast/Mid'e geri çekilme veya mikro aralıktan teyit edilmiş bir kırılma bekleyin.
- H4 YAN YÖNELİM veya TERS DÖNÜŞ RİSKİ durumundaysa H1'de pozisyona girmeyin.
Canlı ticarette altın kural: paneli , bağlamsağlar; bir işlem emrideğildir. sadece yön + aşama + momentum + acil haber yok uyumlu olduğundagirin. Eğer paneli “YAN YATMA + İÇ ARALIK + sıkışmayok ”gösteriyorsa, bir kuralolarak kenarda kalın.
MetaQuotes Ltd tarafından İngilizceden çevrilmiştir.
Orijinal kod: https://www.mql5.com/en/code/76009
 GDS Renko Momentum Demo EA
This educational Expert Advisor demonstrates one simple way to trade momentum on Renko bricks in MetaTrader 5. Momentum is the difference between the latest completed Renko close and the close N bricks earlier, divided by the brick size. A crossing above the positive threshold produces a BUY signal; a crossing below the negative threshold produces a SELL signal. Staying beyond a threshold does not generate repeated signals. The EA builds classic fixed-size Renko internally from Bid ticks, with a two-brick reversal. Orders use the available market Bid/Ask rather than synthetic brick prices. If several bricks form on one tick, only a crossing on the final brick can trigger entry. There is one position at a time, with virtual take profit, virtual stop loss, a maximum holding time, a cooldown and a spread filter. No external indicator, DLL, custom symbol or offline chart is required.
PulseStrike Scalper - Statistical Burst Detection EA
PulseStrike Scalper - Statistical Burst Detection EA
Day Trader Dashboard
Day Trader Dashboard, MetaTrader 5 için geliştirilmiş, Bloomberg tarzında bir görsel paneldir; gün içi fiyat aralığını takip eder ve fiyatın bu aralığın içinde olduğu (fade zone) veya aralığın dışına çıktığı durumları işaretler. Bu araç işlem yapmaz — son çubuklardan Yüksek/Düşük aralığını hesaplayan, bu seviyeleri doğrudan grafiğe çizen ve temalı, otomatik ölçeklenebilir bir panelde canlı durum bilgisini (tarama / aralık içinde / kırılma) gösteren bir karar destek katmanıdır. Aynı grafikte birden fazla bağımsız örneği ve çeşitli renk temalarını destekler; kaldırıldığında nesnelerinin %100'ünü temizler.
EA AurumNeuro Vanguard
AurumNeuro Vanguard is an intelligent Expert Advisor (EA) specifically designed for XAUUSD / Gold trading, combining a hybrid Neural Risk Architecture with the Unified Market Dynamics Engine (UMDE).