 MetaTrader 5
 Experts
 지표
지표
 스크립트
스크립트
 라이브러리
라이브러리
 보관함
보관함
당사 팬 페이지에 가입하십시오

FX Dashboard - MetaTrader 5용 지표

- 조회수:
- 14
- 게시됨:
- 업데이트됨:
-
 이 코드를 기반으로 한 로봇이나 지표가 필요하신가요? 프리랜스로 주문하세요
프리랜스로 이동
이 코드를 기반으로 한 로봇이나 지표가 필요하신가요? 프리랜스로 주문하세요
프리랜스로 이동

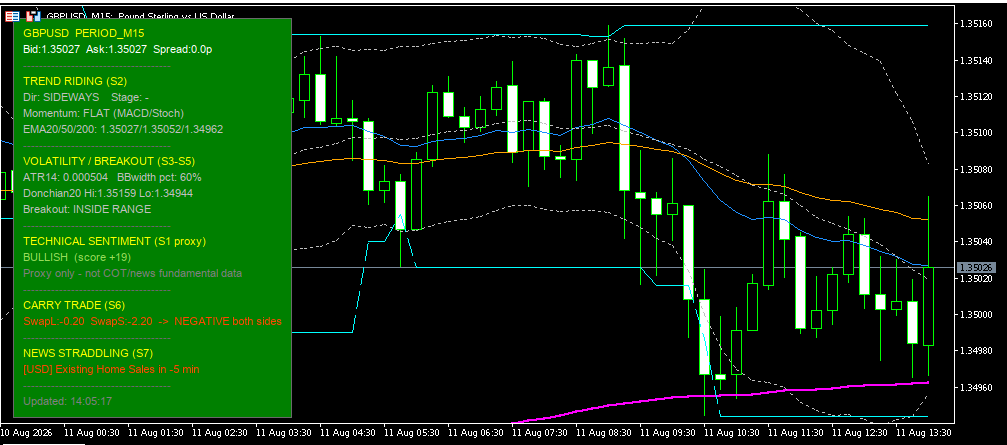
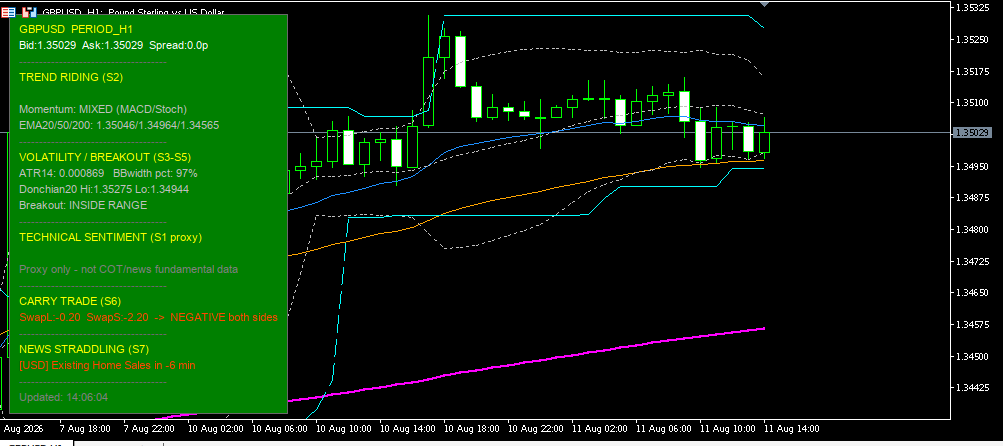
차트가 보여주는 내용:
- 기술적 심리지표(대용 지표) – EMA + MACD + 스토캐스틱을 기반으로 산출된 강세/약세 점수
- 추세 추종 – 방향(상승 추세 / 하락 추세 / 횡보), 단계(초기 / 확립 / 성숙 / 반전 위험), 모멘텀
- 변동성 및 돌파 – ATR, 볼린저 밴드 수축, 돈치안 채널, 돌파 상태(확정 / 허위 / 테스트 중)
- 캐리 트레이드 – 롱/숏 스왑 (누가 일일 이자를 지불하거나 수취하는지)
- 뉴스 스트래들링 – 해당 통화쌍에 영향을 미칠 다음 주요 경제 이벤트
차트에 표시된 항목: EMA(빠른/중간/느린), 볼린저 밴드, 돈치안 채널.
실전 거래에서 어떻게 도움이 되는가
- 시간 절약 – 더 이상 5~6개의 지표 창을 오갈 필요가 없으며, 한 곳에서 추세, 변동성 및 뉴스를 확인할 수 있습니다.
- 컨텍스트 필터 – 진입 전에 다음 사항을 확인합니다: 명확한 추세인가? 스퀴즈인가? 진짜 돌파인가, 가짜 돌파인가? 30분 이내에 뉴스가 있는가?
- 충동적인 진입 감소 – “FALSE BREAK – FADE”, “REVERSAL RISK”, “SIDEWAYS”와 같은 신호를 통해 레인지 장세와 가짜 돌파를 피할 수 있습니다.
- 뉴스 타이밍 – 영향력이 큰 이벤트(NFP, 금리, CPI 등)에 대한 카운트다운을 통해 변동성을 피하거나 활용할 수 있습니다.
- 캐리 – H4/D1 차트에서 양의 스왑 수익이 발생하는 방향을 선택할 수 있습니다.
중요한 제한 사항:
- 심리 지표는 기술적 지표(대용 지표) 이며, COT 데이터나 실제 펀더멘털이 아닙니다.
- 이 분석은 자동 진입/청산을 제공하지 않으며, 결정은 전적으로 귀하에게 달려 있습니다.
- 경제 캘린더는 브로커의 서버에 따라 달라집니다.
- 이는 금융 조언이 아니며, 교육적 맥락에서 활용되는 도구입니다.
각 입력 그룹에 대한 설명
패널 식별 정보
| 설정 | 기능 |
|---|---|
| 고유한 패널 ID | 동일한 차트에 2개의 인스턴스를 배치하는 경우, 객체 간 충돌을 방지하기 위해 서로 다른 ID(Main, Scalp 등)를 사용하십시오. |
패널 위치
| 설정 | 기능 |
|---|---|
| 패널 모서리 | 패널이 배치될 모서리(왼쪽 상단, 오른쪽 하단 등). |
| X/Y 오프셋 | 모서리로부터의 거리(픽셀 단위). |
패널 및 텍스트 색상 (드롭다운 목록)
| 설정 | 기능 |
|---|---|
| 패널 배경 | 패널 배경색. |
| 테두리/구분선 | 테두리 및 구분선. |
| 헤더 / 강조 | 섹션 제목(TREND RIDING, NEWS 등). |
| 중립 / 기본 텍스트 | 일반 텍스트(매수/매도 호가 등) – 기본 색상은 흰색. |
| 강세 색상 | 긍정적 신호 / 상승 추세 – 기본값은 녹색. |
| 약세 색상 | 부정적 신호 / 하락 추세 – 기본값은 빨간색. |
| 경고 색상 | 세력 약화, 반전 위험, 뉴스 발표 임박. |
| 중립 색상 | 횡보, 가격이 범위 내. |
| 정보 색상 | 스퀴즈, 초기 추세 형성. |
| 노화 색상 | 추세가 노후화됨 – 기본 색상은 노란색. |
| 회색 메모 색상 | 보조 노트, 면책 조항. |
글자 크기 및 확대/축소
| 설정 | 기능 |
|---|---|
| 글꼴 | 기본값은 Arial입니다. |
| 기본 텍스트 크기 | 텍스트 크기(포인트). |
| 패널 자동 맞춤 | 너비와 높이가 텍스트에 맞게 자동으로 조정됩니다. |
| 수동 크기 조정 | HiDPI 화면용 배율 (0.5–3.0). |
| 줄 간격 | 줄 사이의 추가 간격. |
업데이트
| 설정 | 기능 |
|---|---|
| 패널 새로고침 간격 | 패널이 새로 고쳐지는 빈도(기본값 1초). |
차트 오버레이
| 설정 | 기능 |
|---|---|
| EMA / BB / 돈치안 그리기 | 차트에 선을 표시하거나 숨깁니다. |
| EMA/BB/돈치안 색상 및 두께 | 선 모양 (드롭다운 목록에서도 선택 가능). |
전략 2 – 추세 추종
| 설정 | 기능 설명 |
|---|---|
| EMA(빠른/중간/느린) | EMA 기간(기본값 20 / 50 / 200). 이들의 중첩 여부에 따라 상승 추세(UPTREND) 또는 하락 추세(DOWNTREND)가 결정됩니다. |
| MACD(빠른 / 느린 / 신호선) | 히스토그램 및 모멘텀 확인용입니다. |
| 스토캐스틱 %K / %D / 슬로잉 | 확인증거나 다이버전스를 확인하기 위한 스토캐스틱 기울기. |
전략 3/4/5 – 변동성 및 브레이크아웃
| 설정 | 기능 |
|---|---|
| ATR 기간 | 현재 변동성. |
| BB 기간 / 편차 | 압박 감지를 위한 볼린저 밴드. |
| BB 스퀴즈 룩백 | 현재 BB 폭 백분위수를 산정하는 데 사용되는 바 수. |
| 압축 임계값 % | 이 백분위수 이하일 경우 [SQUEEZE] 라벨이 표시됩니다. |
| 돈치안 기간 | N 바에 걸친 고가/저가 채널(브레이크아웃 및 페이드용). |
| 페이드 룩백 바 | 브레이크아웃이 실패하고 채널 내부로 되돌아올 수 있는 최대 바 수. |
| 브레이크아웃 ATR 배수 | 브레이크아웃이 ‘확정’되기 위해 가격이 채널을 얼마나 멀리(ATR 배수로 표시) 벗어나야 하는지. |
전략 1 / 6 / 7
| 설정 | 기능 |
|---|---|
| 심리 지표 표시 | 기술적 강세/약세 점수를 표시합니다. |
| 캐리 표시 | 롱/숏 스왑을 표시합니다. |
| 뉴스 표시 | 다음 일정 이벤트를 표시합니다. |
| 뉴스 미리보기 (분) | 뉴스 검색 창(기본값 180분). |
| 뉴스 필터 | 높음만 / 중간+높음 / 모두. |
이 지표를 활용한 실용적인 실전 거래 방법
1. H1 / H4 차트에서의 추세 추종 (주요 전략)
- 상승 추세 또는 하락 추세 + 2단계 (확립 ) + 모멘텀 확인이 나타날 때까지 기다립니다.
- 시장 심리가 강세(BULLISH) 이상일 것(매도 시에는 약세(BEARISH) 이하일 것).
- 가격이 EMA Fast 또는 Mid까지 되돌림될 때 진입하고, EMA Mid/Slow 또는 반대쪽 돈치안(Donchian) 경계선 너머에 스탑을 설정합니다.
- 단계가 4-반전 위험(REVERSAL RISK )이거나 모멘텀이 발산(DIVERGING) 중일 경우 진입을 피합니다.
- 영향력이 큰 뉴스 이벤트(뉴스 섹션)가 발생하기 30~60분 전에는 포지션을 청산하십시오.
2. 스퀴즈(S5 → S4)에서 돌파
- 볼린저 밴드 폭 백분위수에서 [SQUEEZE] 라벨을 확인하십시오.
- ‘확정된 상승 돌파(CONFIRMED UP BREAKOUT )’ 또는 ‘확정된 하락 돌파(CONFIRMED DOWN BREAKOUT )’(단순한 “테스팅(TESTING)”이 아닌)을 기다리십시오.
- 브레이크아웃 방향으로 진입하고, 채널 내부 또는 볼린저 밴드 하단/중간 지점에 스탑을 설정하십시오.
- 만약 ‘FALSE … BREAK – FADE’가 표시되면, 돌파를 쫓지 마십시오. 이는 페이드(fade) 진입 신호입니다(방법 3 참조).
3. 허위 돌파 시 페이드 (S3)
- 패널에 ‘거짓 상승 돌파 – 페이드(FALSE UP BREAK – FADE )’ 또는 ‘거짓 하락 돌파 – 페이드(FALSE DOWN BREAK – FADE)’가 표시됩니다.
- 가격이 돈치안 채널을 벗어나 다시 채널 내부로 돌아왔습니다.
- 실패한 돌파 방향과 반대로 진입하고(거짓 상승 후 숏), 손절은 돌파의 극단 지점을 약간 넘어선 지점에 설정하십시오.
- 목표가: 가격 변동 범위 중간 또는 반대쪽 볼린저 밴드. 즉각적인 뉴스가 없는 횡보장( SIDEWAYS)에서 더 효과적입니다.
4. 뉴스 발생 시 스트래들 / 매매 회피 (S7)
- 뉴스에 30분 이내에 발생할 이벤트가 표시될 경우(경고 색상):
- 포지션을 유지하거나,
- 아니면 (경험이 있는 경우) 스트래들 전략을 사용하세요: 뉴스 발생 전 가격 범위 상하단에 매수 스탑 + 매도 스탑 주문을 설정하고, 가격 돌파 후 반대 방향 주문을 취소하세요.
- 동일한 진입 조건에서 스트래들 전략과 추세 추종 전략을 혼용하지 마십시오 – 이는 서로 다른 투자 스타일입니다.
5. D1 차트에서의 캐리 편향 (S6)
- 한쪽(예: 롱 캐리 +)에서 스왑이 명확히 양수인 통화쌍의 경우.
- 추세(S2)가 일치할 때만 양의 캐리 방향의 거래를 선호하십시오.
- 스왑이 유리하고 반전 위험이 없는 단계일 때만 밤새 포지션을 보유하십시오.
6. 간단한 다중 시간대 필터
- H4 차트: 확립된 추세 + 명확한 시장 심리가 있을 때.
- M15/H1에서: EMA Fast/Mid까지의 되돌림을 기다리거나, 마이크로 레인지에서 확인된 돌파를 기다립니다.
- H4 차트가 횡보 ( SIDEWAYS ) 상태이거나 반전 위험(REVERSAL RISK)인 경우 H1 차트에서는 진입하지 마십시오.
실전 거래의 황금률: 패널 은 맥락을제공하며, 거래 주문을하지 마십시오. 방향 + 단계 + 모멘텀 + 즉각적인 뉴스 부재 가 일치할때만 진입하십시오. 만약 패널 이 “SIDEWAYS + INSIDE RANGE + no squeeze”를표시한다면, 규칙 에따라 관망 을유지하십시오.
MetaQuotes Ltd에서 영어로 번역함.
원본 코드: https://www.mql5.com/en/code/76009
 GDS Renko Momentum Demo EA
This educational Expert Advisor demonstrates one simple way to trade momentum on Renko bricks in MetaTrader 5. Momentum is the difference between the latest completed Renko close and the close N bricks earlier, divided by the brick size. A crossing above the positive threshold produces a BUY signal; a crossing below the negative threshold produces a SELL signal. Staying beyond a threshold does not generate repeated signals. The EA builds classic fixed-size Renko internally from Bid ticks, with a two-brick reversal. Orders use the available market Bid/Ask rather than synthetic brick prices. If several bricks form on one tick, only a crossing on the final brick can trigger entry. There is one position at a time, with virtual take profit, virtual stop loss, a maximum holding time, a cooldown and a spread filter. No external indicator, DLL, custom symbol or offline chart is required.
PulseStrike Scalper - Statistical Burst Detection EA
PulseStrike Scalper - Statistical Burst Detection EA
Day Trader Dashboard
‘데이 트레이더 대시보드’는 메타트레이더 5용 블룸버그 스타일의 시각적 패널로, 일중 가격 변동 범위를 추적하고 가격이 해당 범위 내(페이드 존)에 있을 때나 범위를 이탈했을 때 이를 표시해 줍니다. 이 도구는 직접 매매를 실행하지 않으며, 최근 바(bar)의 고가/저가를 기반으로 가격 범위를 계산하고, 해당 수준을 차트에 직접 표시하며, 테마가 적용되고 크기가 자동으로 조정되는 패널에 실시간 상태(스캔 중 / 범위 내 / 돌파)를 보여주는 의사결정 지원 오버레이입니다. 동일한 차트에서 여러 개의 독립적인 인스턴스를 지원하며, 다양한 색상 테마를 제공하며, 제거 시 모든 객체를 100% 정리합니다.
EA AurumNeuro Vanguard
AurumNeuro Vanguard is an intelligent Expert Advisor (EA) specifically designed for XAUUSD / Gold trading, combining a hybrid Neural Risk Architecture with the Unified Market Dynamics Engine (UMDE).