 MetaTrader 5
 Experts
 Indicators
 Scripts
 Libraries
 Storage
Join our fan page

FX Dashboard - indicator for MetaTrader 5

- Views:
- 1978
- Published:
- Updated:
-
 You are missing trading opportunities:
- Free trading apps
- Over 8,000 signals for copying
- Economic news for exploring financial markets
Registration Log inYou agree to website policy and terms of use
If you do not have an account, please register -
 Need a robot or indicator based on this code? Order it on Freelance
Go to Freelance
Need a robot or indicator based on this code? Order it on Freelance
Go to Freelance
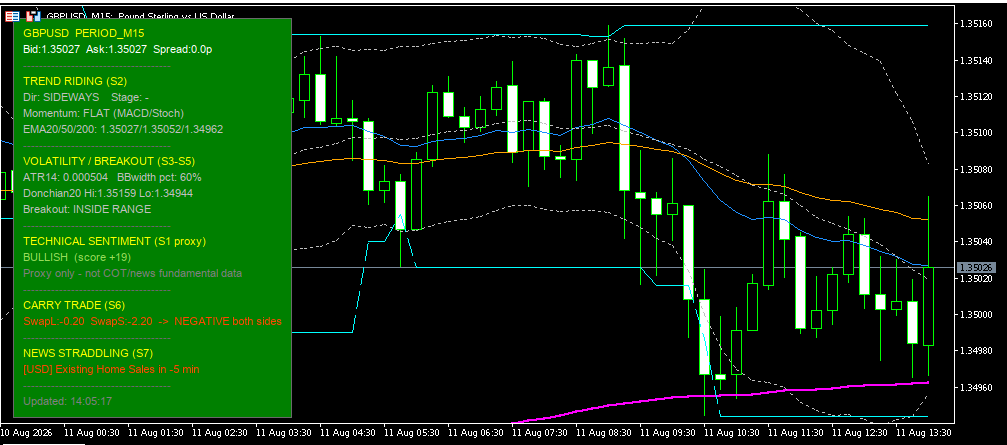
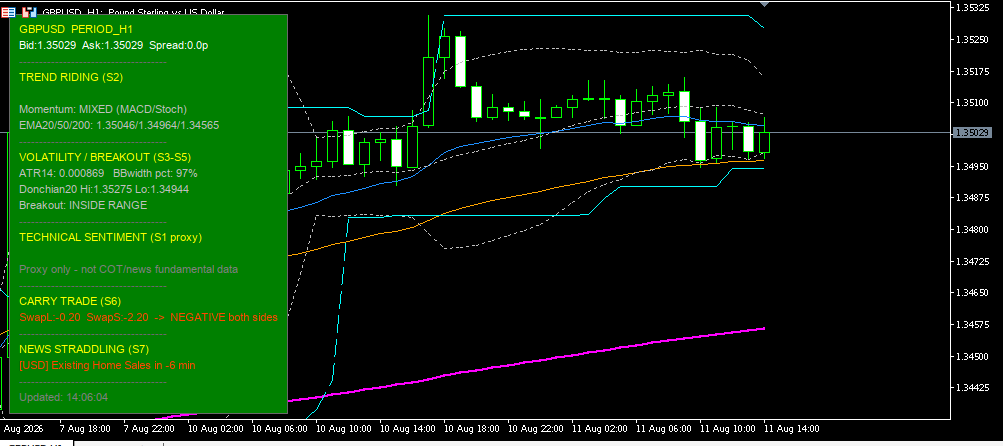
What the panel shows:
- Technical sentiment (proxy) – bullish/bearish score calculated from EMA + MACD + Stochastic
- Trend Riding – direction (UPTREND / DOWNTREND / SIDEWAYS), stage (nascent / established / aging / reversal risk), momentum
- Volatility & Breakout – ATR, Bollinger squeeze, Donchian channel, breakout state (confirmed / false / testing)
- Carry Trade – long/short swap (who pays or receives overnight interest)
- News Straddling – the next important economic event for the pair’s currencies
What is drawn on the chart: EMA Fast / Mid / Slow, Bollinger Bands, Donchian channel.
How it helps in real live trading
- Saves time – you no longer jump between 5–6 indicator windows; you see trend, volatility and news in one place.
- Context filter – before entering, you check: clear trend? squeeze? real or false breakout? news in 30 minutes?
- Reduces impulsive entries – signals such as “FALSE BREAK – FADE”, “REVERSAL RISK”, “SIDEWAYS” keep you away from ranges and false breakouts.
- News timing – countdown to high-impact events (NFP, rates, CPI, etc.) so you can avoid or straddle the volatility.
- Carry – on H4/D1 you can prefer the direction that earns positive swap.
Important limitations:
- Sentiment is technical (proxy), not COT data or real fundamentals.
- It does not give automatic entry/exit; the decision remains yours.
- The economic calendar depends on the broker’s server.
- This is not financial advice – it is an educational context tool.
Explanation of every Inputs group
PANEL IDENTITY
| Setting | What it does |
|---|---|
| Unique Panel ID | If you put 2 instances on the same chart, use different IDs (Main, Scalp, etc.) so objects do not conflict. |
PANEL POSITION
| Setting | What it does |
|---|---|
| Panel corner | Corner where the panel sits (top-left, bottom-right, etc.). |
| Offset X / Y | Distance in pixels from the corner. |
PANEL & TEXT COLORS (dropdown lists)
| Setting | What it does |
|---|---|
| Panel background | Panel background color. |
| Border / separator | Border and separator lines. |
| Header / accent | Section titles (TREND RIDING, NEWS, etc.). |
| Neutral / base text | Normal text (Bid/Ask, etc.) – default white. |
| Bullish color | Positive signals / uptrend – default green. |
| Bearish color | Negative signals / downtrend – default red. |
| Warning color | Fade, reversal risk, news approaching. |
| Neutral color | Sideways, price inside the range. |
| Info color | Squeeze, nascent trend. |
| Aging color | Aging trend – default yellow. |
| Gray note color | Secondary notes, disclaimers. |
TEXT SIZE & SCALING
| Setting | What it does |
|---|---|
| Font | Default Arial. |
| Base text size | Text size (points). |
| Auto-fit panel | Width and height auto-adjust to the text. |
| Manual scale | Multiplier for HiDPI screens (0.5–3.0). |
| Line spacing | Extra space between rows. |
UPDATE
| Setting | What it does |
|---|---|
| Panel refresh interval | How often the panel refreshes (default 1 second). |
CHART OVERLAYS
| Setting | What it does |
|---|---|
| Draw EMA / BB / Donchian | Enable or disable the lines on the chart. |
| EMA/BB/Donchian colors + width | Line appearance (also from dropdown lists). |
STRATEGY 2 – TREND RIDING
| Setting | What it does |
|---|---|
| EMA Fast / Mid / Slow | EMA periods (default 20 / 50 / 200). Their stack defines UPTREND or DOWNTREND. |
| MACD Fast / Slow / Signal | For histogram and momentum confirmation. |
| Stochastic %K / %D / Slowing | Stochastic slope for confirmation or divergence. |
STRATEGIES 3/4/5 – VOLATILITY & BREAKOUT
| Setting | What it does |
|---|---|
| ATR period | Current volatility. |
| BB period / deviation | Bollinger Bands for squeeze detection. |
| BB squeeze lookback | How many bars are used to rank current BB width percentile. |
| Squeeze threshold % | Below this percentile the [SQUEEZE] label appears. |
| Donchian period | High/low channel over N bars (for breakout and fade). |
| Fade lookback bars | How many bars a breakout is allowed to fail and return inside the channel. |
| Breakout ATR mult | How far (in ATR multiples) price must close beyond the channel for the breakout to be CONFIRMED. |
STRATEGIES 1 / 6 / 7
| Setting | What it does |
|---|---|
| Show sentiment | Shows the technical bullish/bearish score. |
| Show carry | Shows long/short swap. |
| Show news | Shows the next calendar event. |
| News look-ahead (min) | News search window (default 180 minutes). |
| News filter | High only / Medium+High / All. |
Practical live trading methods with this indicator
1. Trend Riding on H1 / H4 (main strategy)
- Wait for UPTREND or DOWNTREND + stage 2-ESTABLISHED + momentum CONFIRMING.
- Sentiment ≥ BULLISH (or ≤ BEARISH on short).
- Price pulls back to EMA Fast or Mid; enter on the retracement, stop beyond EMA Mid/Slow or the opposite Donchian edge.
- Avoid entry if stage is 4-REVERSAL RISK or momentum is DIVERGING.
- Stay out 30–60 minutes before a high-impact news event (News section).
2. Breakout from squeeze (S5 → S4)
- Look for the [SQUEEZE] label on Bollinger width percentile.
- Wait for CONFIRMED UP BREAKOUT or CONFIRMED DOWN BREAKOUT (not just “TESTING”).
- Enter in the breakout direction; stop inside the channel or under/mid the Bollinger band.
- If FALSE … BREAK – FADE appears, do not chase the breakout – it is a fade setup (see method 3).
3. Fade on false breakout (S3)
- The panel shows FALSE UP BREAK – FADE or FALSE DOWN BREAK – FADE.
- Price left the Donchian channel and came back inside.
- Enter against the failed breakout (short after false up), stop slightly beyond the breakout extremes.
- Target: middle of the range or the opposite Bollinger band. Works better in SIDEWAYS, with no immediate news.
4. Straddle / avoid on news (S7)
- When News shows an event in ≤ 30 minutes (warning color):
- either stay flat,
- or (if experienced) straddle: buy stop + sell stop above/below the pre-news range, cancel the opposite order after the break.
- Do not mix straddle with Trend Riding on the same setup – they are different styles.
5. Carry bias on D1 (S6)
- On pairs with clearly positive swap on one side (e.g. LONG carry +).
- Prefer only trades in the positive-carry direction when the trend (S2) is aligned.
- Hold overnight only if swap helps you and the stage is not REVERSAL RISK.
6. Simple multi-timeframe filter
- On H4: ESTABLISHED trend + clear sentiment.
- On M15/H1: wait for a pullback to EMA Fast/Mid or a confirmed breakout from a micro-range.
- Do not enter on H1 if H4 is SIDEWAYS or REVERSAL RISK.
Golden rule in live trading: the panel gives context, not a trade order. Enter only when direction + stage + momentum + absence of immediate news align. If the panel shows “SIDEWAYS + INSIDE RANGE + no squeeze”, as a rule stay on the sidelines.
Day Trader Dashboard
The Day Trader Dashboard is a Bloomberg-style visual panel for MetaTrader 5 that tracks an intraday price range and flags when price is inside it (fade zone) or has broken out of it. It doesn't place trades — it's a decision-support overlay that computes the range High/Low from recent bars, draws those levels directly on the chart, and shows a live status readout (scanning / within range / breakout) in a themed, auto-scaling panel. It supports multiple independent instances on the same chart, several color themes, and cleans up 100% of its objects when removed.
News Trading Dashboard
News Trading Dashboard is an informational on-chart panel (it does not trade automatically) that monitors market volatility in real time to detect "news spike" moments — the sudden price moves that occur when economic data is released (NFP, CPI, interest rate decisions, etc.).
 MT5 EA Acceptance Harness
Deterministic synthetic acceptance checks for MT5 EA entry-state logic, with no market, account or order access.
Rolling Return Autocorrelation Regime Oscillator
Tracks lag-N return autocorrelation over a rolling window as a live regime oscillator, distinguishing trending (positive autocorrelation) from mean-reverting (negative autocorrelation) market conditions. Plots a smoothed reading against dynamically-calculated statistical significance bands (±Z/√N), so you can tell a genuine regime shift from window-size noise — comparable across any symbol or timeframe since it works on returns, not raw price.